#CFX/USDT — Symmetrical Triangle: Ready for a Rally or a Breakd#CFX
The price is moving in a descending channel on the 1-hour timeframe. It has reached the lower boundary and is heading towards breaking above it, with a retest of the upper boundary expected.
We have a downtrend on the RSI indicator, which has reached near the lower boundary, and an upward rebound is expected.
There is a key support zone in green at 0.0724. The price has bounced from this level multiple times and is expected to bounce again.
We have a trend towards consolidation above the 100-period moving average, as we are moving close to it, which supports the upward movement.
Entry price: 0.0730
First target: 0.0737
Second target: 0.0747
Third target: 0.0760
Don't forget a simple principle: money management.
Place your stop-loss order below the support zone in green.
For any questions, please leave a comment.
Thank you.
Cfxusdtperp

CFX/USDT At Major Support — Last Line Before a Deeper Drop?CFX/USDT on the Daily (1D) timeframe is still trading within a medium-term bearish trend, characterized by a clear sequence of lower highs and lower lows since the peak around the 0.27–0.28 area.
Price has now declined back into a historically strong demand zone at 0.072 – 0.063, which previously acted as an accumulation base before a strong bullish impulse.
This area represents a critical decision zone for the next major move.
---
Pattern & Technical Structure
1. Descending Trendline (Bearish Control)
A well-defined descending trendline connects the major swing highs since August.
Each touch of this trendline resulted in strong rejection, confirming persistent seller dominance.
2. Descending Channel / Bearish Continuation
Price structure forms a descending channel, reflecting gradual distribution.
Current price action is located near the lower boundary of the channel, close to key support.
3. Strong Horizontal Demand Zone
The yellow zone at 0.072 – 0.063 represents:
A strong historical reaction area
Previous rebound levels
A psychological deep discount zone
This zone has the potential to act as a base for reversal if buyers step in aggressively.
---
Key Levels
Support
Major Support (Key Demand): 0.072 – 0.063
Critical Breakdown Level: 0.059
Resistance
Minor Resistance: 0.085
Mid Resistance: 0.104
Major Resistance: 0.125
Upper Resistance / Distribution Zone: 0.165 – 0.185
Macro Resistance: 0.230
---
Bullish Scenario
Bullish conditions require:
Price holding above 0.072
Formation of a base / consolidation
Appearance of a bullish daily close (pin bar, engulfing, or strong bullish body)
Potential bullish move:
1. Rebound from the 0.072–0.063 demand zone
2. Break above minor resistance at 0.085
3. Upside targets:
0.104
0.125
Strong momentum continuation → 0.165 – 0.185
Bullish Conclusion:
This area offers a high-risk, high-reward accumulation opportunity for swing traders, as long as the key support remains intact.
---
Bearish Scenario
Bearish confirmation occurs if:
A strong daily close below 0.063
Breakdown accompanied by increasing volume
Failure to reclaim the 0.072 level
Potential bearish continuation:
Further downside toward:
0.059
Possible deeper liquidity zones if panic selling occurs
Note: A breakdown of this zone confirms that the bearish continuation phase remains active.
---
Conclusion
CFX/USDT is currently trading at a major decision zone.
Bounce from 0.072 – 0.063 → potential relief rally or trend reversal
Breakdown below this area → confirmation of bearish continuation
Market is at a critical turning point.
Strict risk management is essential in this region.
---
#CFX #CFXUSDT #CryptoAnalysis #Altcoin #DailyChart #DescendingTrend #SupportResistance #DemandZone #BearishTrend #PotentialReversal

#CFX/USDT chart review#CFX
The price is moving within a descending channel on the 1-hour frame, adhering well to it, and is heading for a strong breakout and retest.
We have a bearish trend on the RSI indicator that is about to be broken and retested, which supports the upward breakout.
There is a major support area in green at 0.1410, which represents a strong support point.
We are heading for consolidation above the 100 moving average.
Entry price: 0.1442
First target: 0.1500
Second target: 0.1545
Third target: 0.1604
Don't forget a simple matter: capital management.
When you reach the first target, save some money and then change your stop-loss order to an entry order.
For inquiries, please leave a comment.
Thank you.

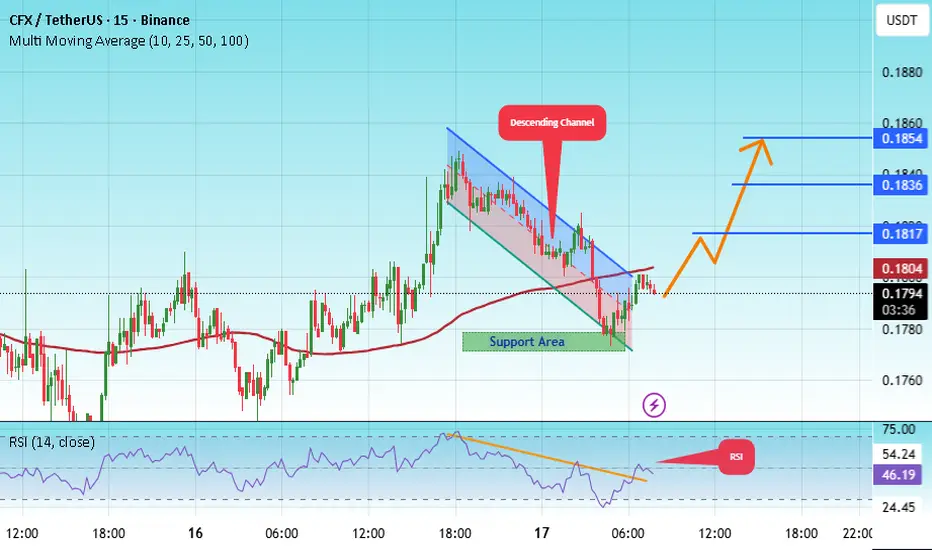
#CFX/USDT — Symmetrical Triangle: Ready for a Rally or a Breakd#CFX
The price is moving within a descending channel on the 1-hour frame, adhering well to it, and is heading for a strong breakout and retest.
We have a bearish trend on the RSI indicator that is about to be broken and retested, which supports the upward breakout.
There is a major support area in green at 0.1777, which represents a strong support point.
We are heading for consolidation above the 100 moving average.
Entry price: 0.1795
First target: 0.1817
Second target: 0.1836
Third target: 0.1854
Don't forget a simple matter: capital management.
When you reach the first target, save some money and then change your stop-loss order to an entry order.
For inquiries, please leave a comment.
Thank you.
CFXUSDT — Symmetrical Triangle: Ready for a Rally or a Breakdown📝 Full Analysis & Narrative
CFX/USDT is currently forming a symmetrical triangle pattern on the daily timeframe after experiencing a strong rally in July–August. This pattern is characterized by a series of lower highs (descending upper trendline) and higher lows (ascending lower trendline), gradually converging into an apex — a classic sign of consolidation with decreasing volatility.
Typically, a symmetrical triangle after a strong impulse tends to act as a continuation pattern, meaning that the price has a higher probability of resuming the prior trend (in this case, bullish). However, we must also acknowledge the possibility of a breakdown if market sentiment turns bearish.
---
🔼 Bullish Scenario
If the price manages to break above the upper trendline with a valid daily close supported by high volume, it will likely confirm a continuation of the bullish move.
Short-term targets:
$0.2000 → psychological and immediate resistance.
$0.2299 → horizontal resistance zone.
$0.2455 → key resistance before retesting previous highs.
Extended target (measured move):
Based on the triangle’s height (~$0.125), a confirmed breakout around $0.2000 projects a potential target near $0.3250, which would exceed the previous high at $0.2799.
Entry strategy:
Conservative: wait for breakout + retest of the upper trendline turned into support.
Aggressive: partial entry before the breakout near the apex (higher risk of fakeouts).
---
🔽 Bearish Scenario
If the price fails to hold and breaks below the lower trendline, bearish momentum could take control.
Short-term targets:
$0.1700 → immediate support.
$0.1550 → lower boundary of the triangle.
Extended target:
If selling pressure accelerates, price could drop toward $0.1000, or even revisit $0.0599 (the historical low shown on the chart).
Entry strategy:
Wait for a confirmed daily close below the lower trendline with strong volume.
Place stop-loss above the broken trendline or near the latest swing high.
---
🔍 Key Factors to Watch
1. Volume is critical → breakouts without volume often lead to fake moves.
2. Daily close confirmation matters more than intraday wicks.
3. Retests of broken trendlines often offer better risk/reward setups.
4. Risk management is essential: keep SL levels clear and limit position size (risk 1–2% per trade).
---
📊 Conclusion
CFX/USDT is approaching a decisive moment. The symmetrical triangle indicates that the market is in “waiting mode” before making its next major move. A breakout above could ignite a continuation rally toward $0.20 → $0.2455 and potentially $0.3250. On the other hand, a breakdown could open the door for a correction back to $0.155 or even $0.10.
Traders should wait for confirmation of direction and maintain strict risk management discipline.
---
#CFX #CFXUSDT #CryptoAnalysis #TrianglePattern #BreakoutOrBreakdown #CryptoTrading #Altcoins #ChartAnalysis #RiskManagement

CFXUSDT TRADE IDEA.CFX/USDT Update (15m TF)
Market Structure: Price is currently bullish with a strong push upward after breaking structure (BOS).
Current Zone: Trading around 0.1759 after rejecting higher.
Point of Interest (POI): The highlighted demand zone near 0.1710 (OB + liquidity sweep).
Scenario:
Possible retracement into POI around 0.1710.
If demand holds, we can see continuation upward toward 0.1790–0.1800 levels.
Short-term liquidity grabs (zig-zag moves) are expected before push.
⚠️ Note: Watch for confirmation inside POI before entry. Without reaction, deeper drop is possible.

Conflux CFX price analysis Recently, #CFX price shot up very strongly, due to the publication of the news that:
#ConfluxNetwork, China's Tier 1 blockchain, announced the launch of #Conflux 3.0 in August and announced plans to help issue a stablecoin pegged to the offshore yuan as China explores the possibility of issuing yuan stablecoins.
The news already reads as “very vague, promising...” but let's remember that we are talking about China, where crypto has been gradually banned since 2013 and finally banned in 2021.
💰 Looking at the OKX:CFXUSDT chart, we see that the price cannot be fixed above $0.19, which means that you should be careful with longs.
📈 If the words from the news are confirmed by actions, then the #CFX price will definitely consolidate above $0.19 and then it will be safe to open a long position.
🐻 And if the desired cannot be realized, then a correction to the $0.085-0.105 zone may become a new reality.
_____________________
Did you like our analysis? Leave a comment, like, and follow to get more

CFX/USDT BREAKOUT ALERT
CFX/USDT BREAKOUT ALERT
CFX/USDT has already broken out of the bull flag pattern and is showing bullish momentum. Since a bull flag is typically a continuation pattern, this breakout suggests the potential for further upside.
However, if the price drops back into the flag structure, it could turn out to be a fakeout. Watch closely to see if the breakout holds or fails.
Key point:
Sustained price action above the breakout = bullish confirmation
Drop back inside the flag = potential fakeout
Stay alert and manage risk accordingly.
#CFX/USDT#CFX
The price is moving within a descending channel on the 1-hour frame and is expected to continue lower.
We have a trend to stabilize above the 100 moving average once again.
We have a downtrend on the RSI indicator that supports the decline with a break below.
We have a support area at the upper limit of the channel at 0.0815.
Entry price: 0.0815
First target: 0.0788
Second target: 0.0763
Third target: 0.0740

CFXUSDT 1DCFX ~ 1D Analysis
#CFX Buy gradually after successfully penetrating this resistant line with a short -term target of at least 10%+.

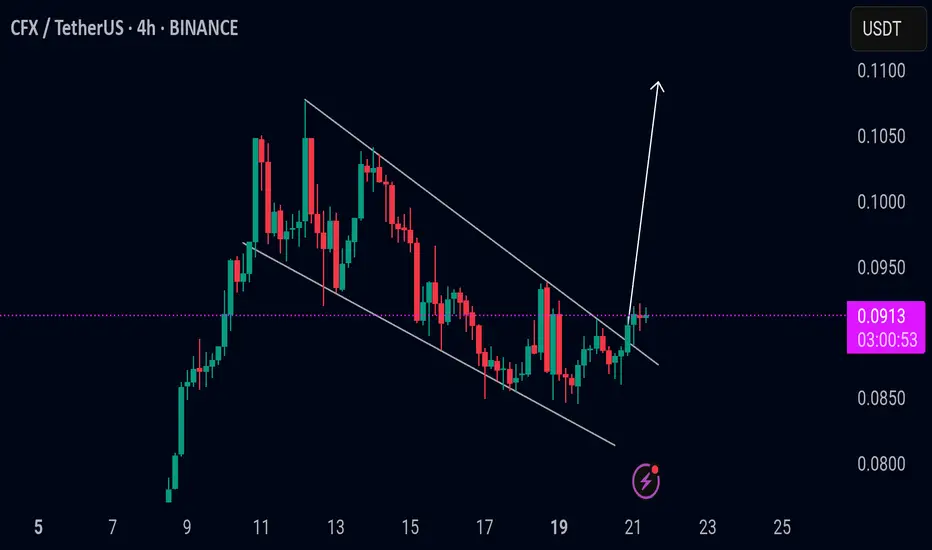
#CFX/USDT#CFX
The price is moving in a descending channel on the 1-hour frame and is expected to continue upwards
We have a trend to stabilize above the moving average 100 again
We have a descending trend on the RSI indicator that supports the rise by breaking it upwards
We have a support area at the lower limit of the channel at a price of 0.0950
Entry price 0.1000
First target 0.1033
Second target 0.1073
Third target 0.1123

#CFX/USDT #CFX
The price is moving in a descending channel on the 1-hour frame and is adhering to it well and is heading to break it strongly upwards
We have a bounce from the lower limit of the descending channel, this support is at a price of 0.1455
We have a downtrend on the RSI indicator that is about to be broken, which supports the rise
We have a trend to stabilize above the moving average 100
Entry price 0.1500
First target 0.1570
Second target 0.1660
Third target 0.1743

#CFX/USDT#CFX
The price is moving in a descending channel on the 4-hour frame and sticking to it well
We have a bounce from the lower limit of the descending channel, this support is at 0.1242
We have an upward trend, the RSI indicator is about to break, which supports the rise
We have a trend to stabilize above the moving average 100
Entry price 0.1485
First target 0.1621
Second target 0.1770
Third target 0.1955

CFXUSDT 1WCFX ~ 1W
#CFX If you still have Conviction on this coin,. Buy gradually within this support block, with a minimum target of 20%+

CFXUSDT Breaks Double-Bottom ResistanceCFXUSDT Technical analysis update
CFX/USDT price found strong support at $0.10 and bounced 110% from this level, forming a potential double-bottom pattern. The price is now breaking the neckline resistance on the daily chart while trading above the 100 and 200 EMA. This setup indicates a possible 100-200% bullish move from the current levels.

CFXUSDT 1WCFX ~ 1W
#CFX Back retesting this support Block,. If you still have Conviction on this coin,. This support block would be an excellent buy spot. Buy gradually with minimal targets 20%++

CFXUSDTCFX ~ 1W ✅
#CFX It looks like the selling pressure has stopped at this support block. Make purchases in stages with at least a short term target of at least 20%+

#CFX/USDT#CFX
The price is moving in a descending channel on the 4-hour frame and is sticking to it very well and is expected to break it upwards
We have a bounce from a major support area in green at 0.1260
We have a downtrend on the RSI indicator that was broken upwards which supports the rise
We have a trend to stabilize above the 100 moving average which supports the rise
Entry price 0.1340
First target 0.1420
Second target 0.1500
Third target 0.1580

CFX Bullish Signal! Time to Retest and Boom!Hey Traders! 🌐📈
🚩 CFX Flag Pattern Alert:
CFX has just signaled a flag pattern and successfully executed a breakout! 🚀
🔄 Retest Phase:
It's currently in the retest phase, revisiting the breakout level.
This retest is a crucial step before potential further upside.
💥 Boom Anticipation:
📉 Retesting is healthy; anticipate a strong move upward after this phase.
📊 Technical Analysis:
Use technical indicators to confirm the retest support level.
Look for bullish confirmation signals before considering entry.
💡 Trading Strategy:
Consider entry post-retest confirmation.
Set stop-loss and take-profit levels to manage risk.
🚨 Risk Advisory:
Trading involves risks; trade responsibly and set risk management.
Do your due diligence; this is not financial advice.
🌟 Exciting Times Ahead!
Trade smart and good luck! 🚀💰

📊#CFX may rise according to the smiley face structure🚀🧠We corrected after breaking out of the all-time highs, had a high probability of a bounce after sweeping the liquidity pools, and successfully constructed a smiley face bullish structure near the buy zone that we may follow to pump.🚀
Let's see👀
🤜If you like my analysis, please like 💖and share it💬
💕 Follow me so you don't miss out on any signals and analyze 💯

📊#CFX potential cup-handle structure, worthy of attention👀🧠We can see from the chart that the upward trend is good, and the daily level correction has been completed, and the response to hitting fib0.5 and the buy zone has been good. If we continue to break above the bearish defense, a bullish cup-and-handle structure is established, so we can shoot for the moon with this structure as support. 🚀🚀🚀🌕
Let’s see 👀
🤜If you like my analysis, please like 💖and share it💬
💕 Follow me so you don't miss out on any signals and analyze 💯

#CFX/USDT.P#CFX/USDT.P
The price broke the resistance area at .1850
Price break triangle pattern
With buying momentum on the MACD
The price is higher than Moving Average 20
The price now is 0.1871.
The price moves to the first target of 0.1890.
And a second goal in 0.1925.
Stop loss at 0.1800.
Below the uptrend

CFX / CFXUSDTGood Luck >>
• Warning •
Any deal I share does not mean that I am forcing you to enter into it, you enter in with your full risk, because I'll not gain any profits with you in the end.
The risk management of the position must comply with the stop loss.
(I am not sharing financial or investment advice, you should do your own research for your money.)
