Accenture plc ACN Multi Timeframe Channel AnalysisAccenture plc (ACN) Multi Timeframe Channel Analysis
1. Long-Term Structure
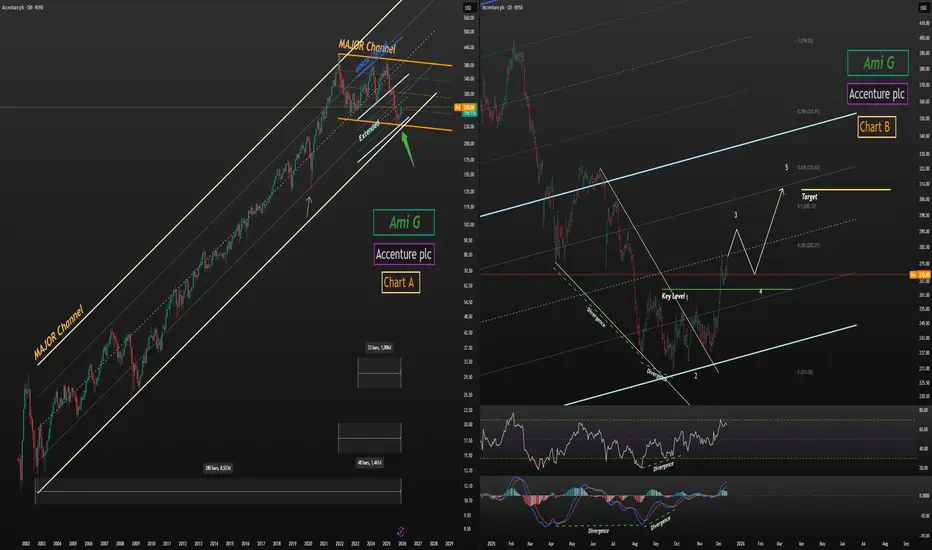
This analysis is built on three major structural channels:
24-year channel
5-year channel
3-year extended channel
Price is currently positioned at a rare triple confluence zone, touching:
The bottom of the 24-year channel
The bottom of the 5-year channel
The extended lower boundary of the 3-year channel
This alignment significantly strengthens the probability of a medium-term bullish reversal.
2. Reversal Signals
At the channel confluence, price completed a clean Ending Diagonal pattern and reacted strongly, showing:
Powerful bullish divergences on momentum indicators
A decisive breakout from the diagonal structure
These signals collectively confirm a strong demand zone and a potential macro reversal.
3. Wave Count and Bullish Scenario
Following the breakout, price has started to build a five-wave impulsive structure.
After breaking its key level, ACN is now positioned in wave 3 of 3, which is typically the strongest part of the move.
Minimum upside target:
310
This level aligns with structural resistance and wave projections.
4. Final Notes
This is my personal analysis I’d be glad to hear your views.
For more detailed breakdowns and live swing trades on stocks, feel free to follow me on TradingView.
Channel-reverse
Bitcoin Short Setup – Why It’s Still Early📝 Bitcoin BINANCE:BTCUSDT Short Setup – Why It’s Still Early
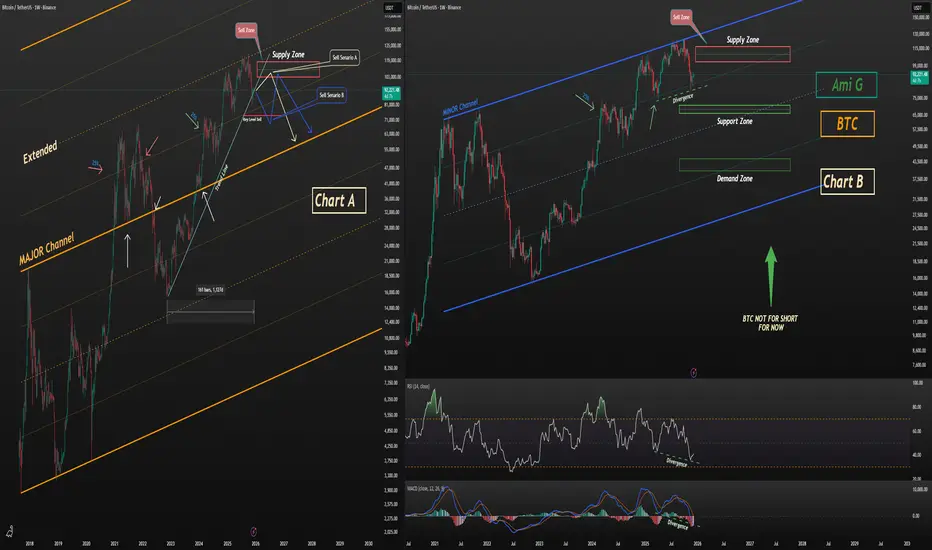
At the moment, opening a short position on Bitcoin is premature.
This does not signal a buying opportunity here — it simply highlights that short positions (especially with leverage) carry high risk from this zone.
📊 Chart A – Major Channel Structure
Bitcoin is trading inside a major channel.
After breaking out of this structure and extending beyond it, price has shown clean and consistent reactions to the extended boundaries.
The latest rejection from the upper zone also aligns with the 50% mid-line, further confirming the significance of this major channel.
📊 Chart B – Short-Term Channel
The shorter-term channel also justifies the recent top.
However, shorting from the current zone is still too early, and here’s why:
Price has reached the 25% reaction zone on both charts
This level has repeatedly acted as a sensitive reaction point across multiple timeframes
Bitcoin is sitting on its 160-week trendline
Clear bullish divergence appears on both MACD and RSI
Given these factors, initiating a short here is high-risk and not technically justified yet.
📉 Short Scenarios (Only If Confirmed)
Scenario A — Chart A
Wait for price to revisit the marked supply zone, then short only with a clear trigger.
Scenario B — Chart B
A short becomes valid after breaking the key level, followed by a pullback into the supply zone.
📌 Outlook
My base view: Bitcoin is likely to correct toward the demand zone shown on Chart B.
📣 Final Note
Stay safe, trade smart.
Follow the profile so you don’t miss the daily live swing trades and day-trading setups shared here on TradingView.
Relative analysis of Bitcoin vs. Gold and Total CryptoOn the BINANCE:BTCUSDT / TVC:GOLD ratio chart, price attempted to re-enter the primary channel after the initial breakout, aiming to push back toward the channel’s upper boundary. However, despite (105) days of upward attempts, the ratio consistently struggled with the dynamic resistance area.
After the breakdown, price extended toward the lower boundary of the extended channel, where it showed a strong and precise reaction.
From here, the structure suggests a potential bullish corrective move toward the resistance zone, supported by:
bullish divergence between price and MACD,
clear weekly rejection candles,
and price interaction at the channel’s lower boundary.
This scenario is further reinforced by the Crypto Market Cap (excluding Bitcoin) CRYPTOCAP:TOTAL2 vs. Gold TVC:GOLD ratio. This chart has also reached the bottom of its (180-week) channel, formed a weekly bullish divergence, and has now returned back inside the channel.
As shown on the chart, the TOTAL crypto channel exhibits cleaner and more consistent reactions compared to the Bitcoin channel.
If our key level is broken, the bullish scenario becomes invalid, and price is likely to move toward the support zones. This analysis will be updated accordingly.
BINANCE:BTCUSDT
TVC:GOLD
CRYPTOCAP:TOTAL2

JIN, weekly setup, waiting for confirmationJIN update, due to a false alarm triggering on the 1H because trendline was too close.
JIN had a strong impulse move this morning 1315 to 1360, it did not BO of descending wedge, no action.
Weekly at horizontal and channel support.
Daily under the downtrend line, hourly under the downtrend line.... sorry for wasting your time 😛

Reversal channel breakout Potential price breakout of a reversal channel towards a key support area.
Counter movement: If price breaks current resistance area upwards, retrace and form new support area; then price will potentially move towards a key area (previous lower high on the daily timeframe). Place pending orders above and below resistance area and let the price play out.

SELL OPPORTUNITY ON AUDUSD On AUDUSD Price is currently trading within a well-defined ascending channel on 1HTF, inside a 4HTF ascending (reversal pattern) this gives an additional confluence.
Waiting for price to test the upper dynamic trendline that serves as my support before going short.
If you found this helpful, please support your fellow trader with a like.

$PEG ShortRejection of downsloping supply line
fakeout of former support with bearish engulfing candle
confirmed daily bearish divergence

GAIL taking support @trendline GAIL taking support #trendline & #supportline it looks like channel pattern so we can go for LONG (BUY) target #upperresistence line...

TRADE OPPORTUNITY – LUNAUSDT Bearish channel 1hAfter a big rise on the daily chart LUNA is looking for the bottom to continue its trend giving us a great buying opportunity.
Indicators Used
*Fibonacci retracement
*RSI lvls
*MPVR
About the BEARISH CHANNEL graphic pattern
Channel of a pattern where the asset loses funds but has no downtrend continuity. It shows a depletion of buying force and tends to break out to the upside reversing the trend of its timeframe.
Current scenario
As everyone knows, no asset goes up forever, needing to create funds to maintain its uptrend. Luna has been in a strong uptrend for months on the daily chart always looking for bottoms when the RSI on the 1h hour chart goes into oversold. Now we are forming another fund, a great opportunity for purchases.
Strategy
Buy at the bottom formed at 1h in oversold.
Using RSI lvls we can see the buy range where the 1h chart goes into oversold and marked with the yellow box. In the middle of this region the MPVR points to a strong support range at the value of 106, which indicates an excellent entry point. The value of 106 also coincides with the Fibonacci retracement, where 0.65 at an excellent entry point called the GOLDEN LINE.
Conclusion
As I always divide my equity into 10 shares and position within the yellow buy range to get the best average price, however, this time I will focus more heavily on the value of 106 due to MPVP. As Alt Coins are extremely volatile I will protect myself from an unlikely, but possible flush up to 100, a strong psychological number, positioning my STOP just below.
The exits I mentioned before are made partially at each strong resistance, however if the uptrend remains strong I will make a partial gain on the first resistance and I will stop making partial gains by raising my STOP at each bottom formed at 1h to try to surf the wave .

Long opportunity On Gold XAUSDConsider spotting long opportunities in gold, after bullish signal pattern around channel, sniper move, manage your risk reward well...

Kellogg possible reversal - Target $ 66.00NYSE:K
- RSI low
- MACD reversing
- On strong volumes might even break the downward channel
- Buy price $ 62.28
- 1st target $ 66.00
- Stop loss $ 60.00

TREND REVERSE ON GOLDYo Traders!
Gold might fall down!
Look to sell after a breakout it's made. Please check a candlestickpattern like a bearish engulfing or a shooting star, after the confirmation you can enter in the transaction.
You can see that the volume of buyers dropped wich means a big return might come. Be very careful!
If you support this ideea, feel free to comment below and like!
Remember: Don't look for fat wins because the only thing you will get is FAT.


Major Descending Channel on H4/D1 for EURCAD - BUY ALERTThis descending channel meant you could have been buying at every bottom trend line touch with take profits once it hits the top.
Risky moves were selling from the top to the bottom
VERY close to major support structure area. BIG BUY coming up
DON'T miss this - an UNCOMFORTABLE lot size on this move will go a LONG way in proving that patterns are KING!
"IF YOU DON'T KNOW PATTERNS, THEN YOU DON'T KNOW HOW TO TRADE"
"LEARN YOUR PATTERNS - YOU MUST KNOW YOUR PATTERNS"
--WAVE TRADER

Eur/Cad DailyWe are in Down trend from start of March. (pattern within larger pattern)
But we close to daily line of major assending channel , be careful, it might broke down on 3rd touch (because its reversal MAIN pattern) But lowering down to 4h/1h you follow up with desedning channel and try to go long on break of that (short term)
Big Potential is on break of main assending of course , but for short term you can try to buy on 1h !
IM still neutral


Kohl's - ShortStrong resistence-area at 78.75. The share did rally twice with strong momentum before to the area, but failed to break it.
Nice setup for double-top might be built by the closure of this weeks session. If today's close-price stays under 75.50, position will be opened at upcomming Monday.
I like the huge trading zone, providing a considerable chance-risk ratio. TP2-level chosen as previous strong momentum countermoves from resistence-area were 50% and 40%+.

BTC Retrace of DumpThis is a model of the retrace from the dump to 7480. The double bottom at the vicinity of 7500 and the bounce have formed a narrowing channel heading to the first fibonacci level of 0.382 just under 7800. This should be considered a short-term entry for a short or close for longs opened at 7500-7600. After reaching this target, further upside as high as 8k is possible (.618), but ultimately, this is a bull trap/bear flag that should break down at one of these 3 levels.

AUD/CHF Technical analysisThe 4-hour chart of AUD/CHF is currently in downtrend.
It has also formed a down channel within the downtrend which indicates further weakness.
As per our analysis,we expect the bears to return strongly at this price point and expect further downside.

AU long to 75.000 then short to 73.xxxAU is looking to long to 200ma, i think its going to get near 75.000 and then short down to my channel bottom (73.xxx).
last week price double bottomed back into week open range and closed up, but not over the open of the week, still think it is showing bullishness but over all i am looking to short AU, maybe in the coming weeks.
AU monthly is in a established channel, which alot of people would be watching to break, this week will be the end of the month, i feel like it will just keep ranging in the channel as AU usually likes to do.

USDJPY, rising through the channel, LONG positionAs the price retraced from the supporting trend line, the long position can be the choice.

