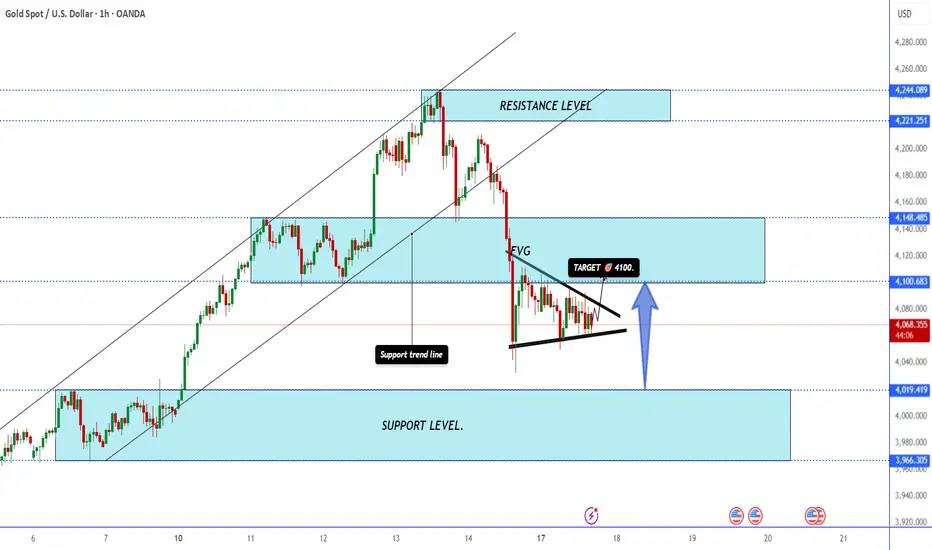
Gold Triangle Breakout Setup Toward 4100 ZoneGold is consolidating inside a symmetrical triangle after breaking below the mid-range zone. A potential bullish breakout could push the price toward the 4100 resistance zone, while the lower support zone remains a key level to watch.
Chartpatterntrading
Kalyan Jewellers : Possible Head & Shoulders Pattern ?This is the daily timeframe chart of Kalyan Jewellers.
The stock is moving within a well-defined parallel channel, with a strong support zone near the 440–460 range, which has already been respected as the stock bounced back from this level.
Currently, the stock is providing price-action support near the 470–480 zone.
If this level sustains and a bullish move begins from here, it will confirm that the stock has formed a Head & Shoulders pattern.
The potential target for this pattern lies in the 640–650 range.
Thank You !!

USD/JPY Rejection Signals Possible Drop Toward 154.300USD/JPY is reacting from a strong resistance zone, showing signs of rejection after multiple failed breakouts. Price is expected to pull back toward the Fair Value Gap (FVG) and may extend further down toward the 154.300 target, aligning with the mapped order block below.

CDSL !! Time to Be Cautious! Bearish Signals Getting StrongerThis is the Daily Timeframe Chart Analysis of CDSL
CDSL is currently forming a Rising Wedge pattern near the key resistance zone of 1680–1700. A breakout above this level with strong volume could lead to an upside target around 1800.
However, if the stock fails to break this resistance and the zone holds, we may witness a downside move. In that case, CDSL could retrace towards the range-bound support area of 1500–1520.
Thank you.

Silver Price Ready for Lift-Off: Bullish Channel Silver (XAG/USD) is consolidating within a rising channel, with strong Ichimoku cloud support hinting at a potential bullish breakout. After a brief pullback to the lower channel boundary, price action shows signs of rebound momentum targeting the $54 resistance zone. A confirmed break above $53 could trigger an upward move equal to the channel height, continuing the bullish trend. Traders are watching for a breakout confirmation above the midline for a potential long setup.
🧭 Chart Overview
Timeframe: 30-minute chart
Indicator: Ichimoku Cloud (9, 26, 52, 26)
Price: $52.67 (as of the chart time)
Trend Channel: Rising (ascending parallel channel)
---
📊 Price Action Analysis
1. Trend Structure:
The chart shows Silver trading inside a well-defined ascending channel, respecting both upper and lower boundaries.
Price recently bounced off the lower channel support, which often acts as a bullish signal within an ongoing trend.
2. Ichimoku Cloud (Kumo):
The price is hovering around the top of the Ichimoku cloud, suggesting neutral-to-bullish sentiment.
The cloud’s future span (Senkou Span A > Span B) points slightly upward — a sign of potential continuation of the uptrend.
Support lies near the $52.50–$52.60 zone, which aligns with both the lower channel line and the top of the cloud — a strong confluence area.
3. Momentum Observation:
The recent correction looks more like a healthy retracement than a reversal.
Buyers are likely waiting for confirmation before pushing higher.
4. Breakout Levels:
Immediate Resistance: $53.40 (mid-channel + previous top).
Major Resistance: $54.00 (upper channel target).
Support Zone: $52.50–$52.00 (Ichimoku + trendline confluence).
---
🚀 Bullish Scenario
If price closes above $53.40, it would confirm a breakout of the short-term consolidation pattern.
The projected move (based on the channel height) suggests a target near $54.50–$54.60.

Chart Analysis on SPY. Week of November 17 will be ImportantChart Analysis on SPY. Week of November 17 will be Important. Spy could go down to next support or next major resistance. Next week will be very interested

NVDA chart AnalysisI am sharing my NVDA chart analysis with other traders on how it can react or what potential prices it can go

“XAUUSD Trendline Break: Possible Retracement Before Next Move”Gold (XAUUSD) has broken below the rising trendline and Ichimoku support zone, showing strong bearish momentum. Price is currently trading around 4112, after rejecting the upper consolidation zones marked on the chart.
The chart highlights two potential retest zones:
1️⃣ First Retest Zone: 4155–4160 (Minor Supply)
This is the first reaction area after the breakdown.
If price retests this zone and rejects, sellers may re-enter strongly.
Ideal for short-term bearish continuation setups.
2️⃣ Major Retest Zone: 4175–4180 (Strong Supply)
A deeper pullback level where previous support has turned into resistance.
If price reaches this region, look for bearish confirmation signals before entering.
Bulls need a clean breakout above this zone to regain control.
Overall Outlook
Trendline break indicates a temporary shift in momentum.
Watch for pullback → rejection → continuation setups.
A bullish recovery only becomes valid if gold reclaims 4178+ with strong volume.
1️⃣ Trendline Break Confirmed
Price broke below the long-respected ascending trendline.
This signals a shift from bullish to bearish momentum.
The breakdown is strong and supported by a sharp red candle.
---
2️⃣ Ichimoku Cloud Bearish Shift
Price moved below the cloud → bearish signal.
The cloud ahead is thinning, showing weak bullish support.
Momentum is favouring sellers.
---
3️⃣ Previous Consolidation Blocks Marked
You highlighted three old consolidation zones (rectangles).
These zones acted as liquidity pools, and price used them before continuing higher.
Now, price has fallen below them, meaning old support = new resistance.
---
4️⃣ Two Key Retest Levels Identified
First retest (minor): 4155–4160
Closest supply zone.
Price may bounce into this area before rejecting.
Ideal for short-term sell setups.
Major retest: 4175–4180
Stronger resistance zone.
Previously acted as support.
Clean rejection here would confirm continuation to the downside.

Mphasis Technical Levels for Smart TradingThis is the daily timeframe chart of Mphasis.
Mphasis is moving within a well-defined market structure and is forming a pattern inside a pattern.
The major support zone lies between ₹2630–₹2670, while the smaller internal pattern is taking support near ₹2670–₹2700.
The Supertrend indicator is also positive, with Supertrend support positioned around ₹2640.
If these levels sustain, we may witness higher prices in Mphasis.
Thank you !!

NBCC at Support — Bullish Action BeginsThis is the daily timeframe chart of NBCC.
NBCC is taking support near the lower boundary of the parallel channel, and the Supertrend indicator is also providing confirmation in the same zone. The support area lies around 104–108, while the immediate resistance is near 121.
If the support zone holds, the stock may move higher toward the channel’s upper levels near 121, with the final resistance placed around the 145–150 zone.
Thank you!

XAUUSD Breakdown After Trendline Violation –Bearish ContinuationGold has broken below a long-held ascending trendline and slipped under the Ichimoku cloud, confirming a shift in market structure. After the breakdown, price is now forming potential pullback zones near 4130–4155, where sellers may re-enter. The chart highlights previous consolidation blocks, the trendline retest area, and projected bearish continuation levels.
This setup suggests:
Trendline break = bearish momentum shift
Retest zones identified for possible short entries
Lower targets likely if price rejects from resistance zones
Ichimoku showing cloud resistance + bearish sentiment
XAUUSD Technical Analysis – Strong Bearish Momentum After Trendline Breakdown
1. Major Trendline Break (Key Event)
The chart shows gold breaking below a long-term rising trendline that had been respected for several sessions.
This is the strongest signal of a trend reversal from bullish → bearish.
Once price broke the trendline, momentum increased sharply to the downside.
---
2. Ichimoku Confirms Bearish Shift
Price is trading below the Ichimoku cloud, meaning bearish momentum dominates.
The cloud ahead is thin and declining, suggesting weak future support.
Trend bias = Downtrend.
---
3. Key Pullback (Rejection) Zones
Two major resistance areas are marked on your chart:
Zone 1: 4130 – 4140
A shallow pullback zone where early sellers may enter.
If price retests here and rejects, expect continuation downward.
Zone 2: 4148 – 4155
The higher, stronger resistance zone.
This aligns with:
Broken trendline retest
Ichimoku cloud edge
Previous structure zone
This is the ideal short-entry zone for institutional/smart money traders.
---
4. Structure Breaks Confirm Bearish Bias
Market broke:
Previous consolidation blocks
Higher lows
Support levels around 4080–4100
This indicates clear displacement and strong bearish intent.

KRBL is Roaring — Is This the Breakout Moment?This is the weekly timeframe chart of KRBL.
The stock is showing strong price movement accompanied by increasing volume. If this volume continues to rise, KRBL may break above its key level and complete the Cup & Handle pattern.
The major pattern resistance lies in the 480–490 zone.
If the current rally sustains, we may witness higher price levels in KRBL.”
Thank You !!

Gold Price Faces Resistance Near 4,207—Potential Pullback AheadGold (XAU/USD) is testing the upper channel resistance around 4,207 after a strong rally. The chart suggests a possible short-term correction toward the 4,200–4,158 support zone before the next directional move.
🟡 1. Current Trend
Gold (XAU/USD) is trading in an ascending channel, indicating an overall bullish trend.
Price action has been forming higher highs and higher lows, confirming steady upward momentum.
---
🔴 2. Resistance Zone
The upper boundary of the channel and price level around 4,207 USD is acting as a strong resistance.
The chart shows multiple rejections near this zone, suggesting a potential short-term top or profit-taking area.
---
🟢 3. Support Levels
The first key support is near 4,200 USD, aligning with previous price consolidation.
A deeper correction could test 4,158 USD, which matches the lower channel trendline and Ichimoku support zone.
---
⚫ 4. Price Action Pattern
The boxed consolidations represent sideways accumulation phases before each breakout — a sign of strong buying pressure.
However, the latest consolidation near the channel top hints at buyer fatigue, which could lead to a pullback.
---
🟣 5. Expected Move (Short-Term Outlook)
The downward arrows on the chart suggest a potential retracement within the channel.
Price could dip toward 4,158–4,200 USD before finding fresh buying interest.
As long as price remains above 4,158, the bullish structure remains intact.
---
⚙️ 6. Trading Implications
Aggressive traders: May look for short opportunities near resistance (~4,207) with tight stops above the channel.
Conservative traders: May wait for a bounce confirmation around 4,158–4,200 to rejoin the uptrend.

JSL Entering Bull Mode – Potential Upside Loading!JSL – Daily Timeframe Analysis
JSL is moving within a well-defined parallel channel and is currently sustaining above the Lop and key support zone near ₹700–710.
The EMA’s positive crossover further confirms the bullish trend and supports the ongoing momentum in this range.
On the shorter timeframe, the stock is forming a broadening wedge pattern with a support base around ₹700–710.
If this zone continues to hold, we may witness higher price levels in JSL in the coming sessions.
Thank you!

EUR/USD Ready for Lift-Off from Ascending SupportThe EUR/USD pair is testing a strong ascending trendline near 1.1565, signaling a potential bullish rebound. A breakout above 1.1585 could trigger upward momentum toward 1.1620, aligning with the bullish setup shown by the rocket illustration.
1. Ascending Trendline Support
The chart shows a clear upward-sloping trendline, connecting higher lows from November 9 to November 12.
The price is currently testing this support zone (~1.1565), suggesting buyers may defend this level.
---
2. Bullish Reversal Potential
The drawn rocket symbol and arrows indicate a bullish scenario — a possible rebound from the trendline toward higher targets.
If momentum holds above 1.1560–1.1570, a short-term bullish reversal is likely.
---
3. Key Resistance Levels
Immediate resistance: 1.1585 — breaking and closing above this may confirm a bullish push.
Next resistance target: 1.1620 — this is the projected short-term goal indicated by the chart’s upper blue band.
---
4. Ichimoku Cloud Context
The Ichimoku cloud (Kumo) is slightly above price action, meaning some resistance remains ahead.

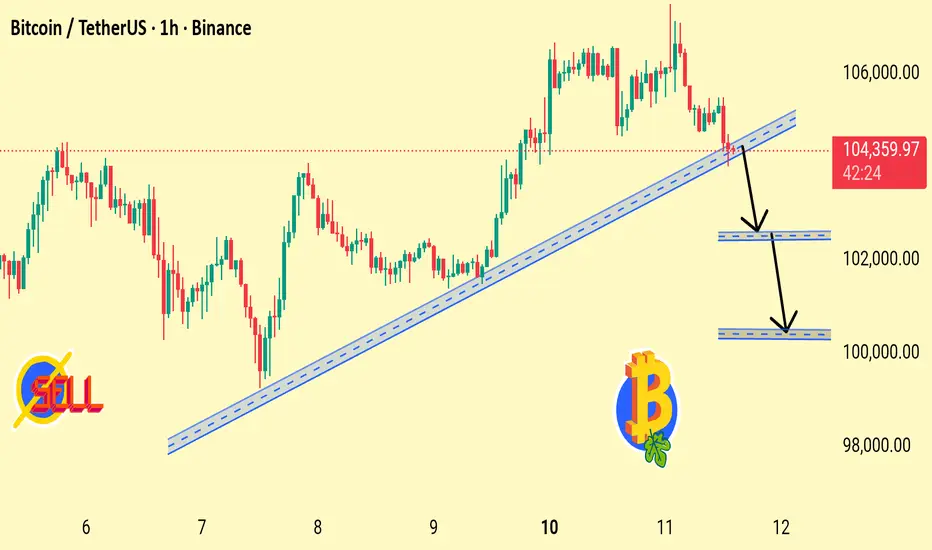
Bitcoin Losing Trendline Support Possible Drop Toward Key DemandBTC has broken below the rising trendline, signaling weakening bullish momentum. Price may retest $102,500 and potentially dip toward the $100,000 support zone if sellers continue to dominate.
1. Trendline Break Detected
BTC has fallen below the rising trendline that supported the uptrend from Nov 7–11. This signals weakening bullish structure.
2. Momentum Turning Bearish
The rejection near 105,000 and sharp drop indicate sellers are stepping in aggressively.
3. First Support Zone: $102,500
Chart shows the first demand zone here. If BTC stabilizes above this level, a bounce is possible — but weakness still remains.
4. Second Support Zone: $100,000
A deeper drop could test the psychological round number. Strong liquidity is expected at this level.
5. Trend Structure Changing
Breaking the trendline + lower highs = possible shift from bullish to short-term bearish trend.
Power Grid Building Momentum for the Next Summit!This is the Daily Timeframe Chart of Power Grid Corporation of India.
The stock is forming a Bow & Tie pattern, indicating a potential trend reversal setup.
It has a strong support zone in the 258–22 range, while the resistance lies near the 285 And 300 level.
If the stock sustains above its support zone, we may witness higher price movement in Power Grid Corporation of India.
Thank you!

Bitcoin Rebound from Support Toward Key Resistance TargetsBitcoin is showing a potential rebound from the support zone near $103,200. Price may target the $104,800 (Target 1) and $105,400 (Target 2) resistance levels if bullish momentum continues. The Fair Value Gap (FVG) suggests possible upward movement after recent correction.

Adani Enterprises: The Bull Is Roaring Loud!This is the daily timeframe chart of Adani Enterprises.
The stock is moving within a well-defined parallel channel, with a strong support zone around the 2250–2300 range. After the recent decline, the stock respected this zone and started a fresh bullish rally from the support.
Earlier, the stock formed a negative pattern, which led to a decline, and its target has already been achieved near the support area. From there, the price has shown a strong rebound.
Currently, the stock is trading near the Middle of the channel, where resistance lies between 2520–2540 on the shorter timeframe.
Once this resistance zone is broken, the stock will have no immediate boundary, and the next upward move could extend toward 2800–2850.
If this rally continues and the support zone holds, we may witness higher levels ahead in Adani Enterprises.
Thank you.

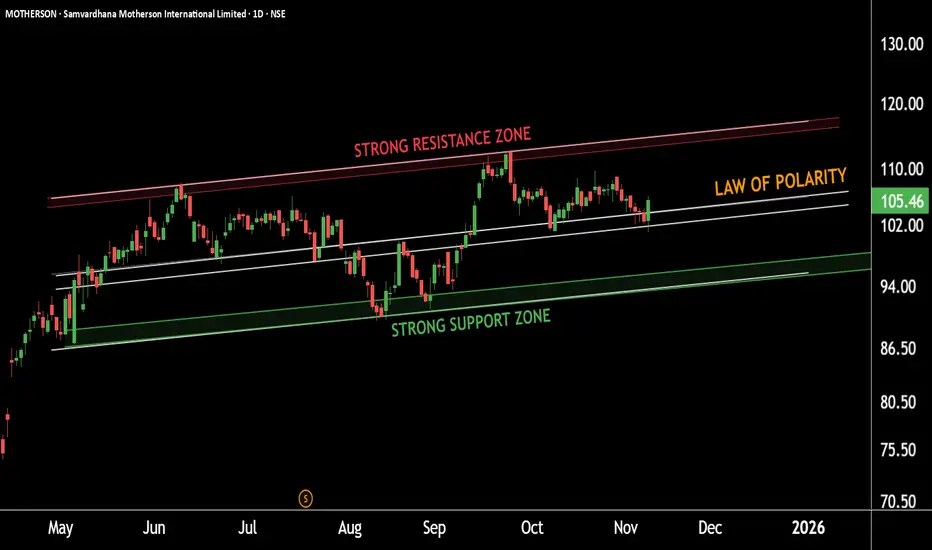
Motherson On Radar: Key Level Trigger Before The BreakoutThis is the daily timeframe chart of Samvardhana Motherson.
The stock is moving within a well-defined parallel channel and is currently sustaining above the upper band near the 100 level.
A strong support zone lies at 90–93. If the stock continues to hold above this zone,
we may see higher levels toward 115.
Thank you.
CESC Set to Ignite: Key Levels Triggering a Bull MoveThis is the daily and 4-hour timeframe chart of CESC.
The stock is moving within a well-defined parallel channel, with a support zone in the 160–163 range.
The Supertrend indicator is positive and suggests an additional support zone around 165–167.
CESC is forming a rising wedge pattern, and after the breakout, the stock has retested the pattern’s resistance, which may now act as support near the 165–167 zone.
If this support zone holds, we may see higher prices in CESC.
Thank you.

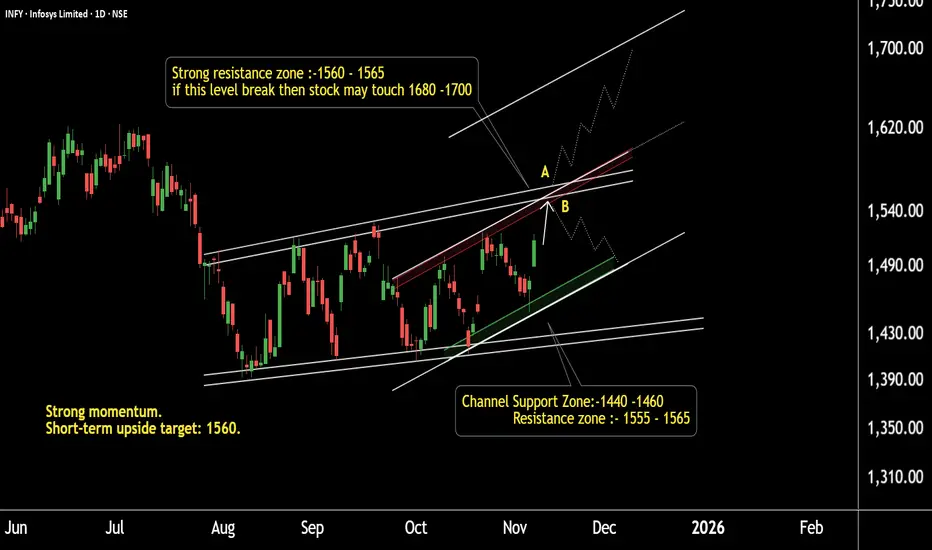
INFY Battle Zone: Levels That Decide the TrendThis is the daily timeframe chart of INFY.
The stock has a strong support zone near 1410 and 1440.
It is facing major resistance within the short-term and mid-term channel around 1555–1565.
Currently, INFY is trading near 1520, and the ongoing move may extend toward 1560.
If the stock fails to break this resistance, a short-term decline may occur.
However, if the resistance is decisively broken, INFY has the potential to rally toward 1680–1700 based on the channel trend.
Thank You !!
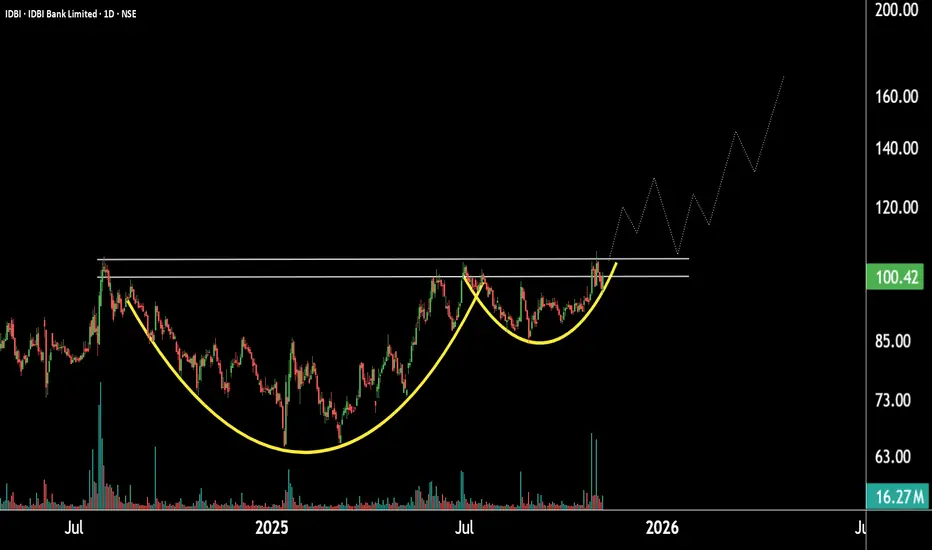
Cup And Handle Formation In IDBI Could Trigger MomentumThis is the daily timeframe chart of IDBI Bank.
The stock is forming a Cup and Handle pattern on the daily timeframe, with a strong support zone near the 90–95 range. If the current rally continues and the stock breaks out of this pattern, it may move toward the 130 level, followed by 165.
If the support zone holds, IDBI Bank could witness higher prices in the coming sessions.
Thank you.