XAU/USD) Bearish trend analysis Read The captionSMC Trading point update
Technical analysis of XAU/USD (Gold Spot) – Bearish Continuation Setup
Timeframe: 1H (Capital.com)
Concepts: Smart Money Concepts (SMC), Trendline Break, FVG & EMA Confluence
---
Market Structure Overview
The uptrend structure was recently broken, confirming a shift to bearish order flow.
Price has broken the ascending trendline, retested near the FVG / premium retracement zone, and is rejecting from the supply area.
The structure and EMAs both support further downside continuation.
---
Key Technical Elements
Retracement Zone (Short Entry Area):
0.5 – 0.79 Fibonacci levels align with the Fair Value Gap (FVG), showing potential for bearish mitigation.
Price currently trading near 0.62–0.705 level (premium zone).
EMA Confluence:
EMA-50 ≈ 3,992
EMA-200 ≈ 4,024
Both EMAs are above price, acting as dynamic resistance.
Trendline Break:
The ascending trendline has been decisively broken and retested, indicating trend reversal confirmation.
---
Targets
Immediate Target (0-level structure): 3,940 zone
Extended Bearish Target: 3,796 — marked as the final target point on the chart
---
Scenario Plan
1. Expect minor retracement to the FVG zone (3,990–4,010).
2. Watch for bearish confirmation (rejection or lower-timeframe BOS).
3. Target downside continuation to 3,796, completing the swing projection.
Mr SMC Trading point
---
Bias:
> Bearish – Market showing structure shift, EMA confluence, and FVG rejection setup aligning toward deeper downside movement.
---
please support boost 🚀 this analysis
Chartpattren

USD/CAD) Bullish trend analysis Read The captionSMC Trading point update
Technical analysis of USD/CAD on the 4H t
Overall Concept
The analysis suggests a retracement entry before a continuation to the upside.
The market is currently bullish, respecting higher highs and higher lows.
The analyst expects a pullback into a discount zone (Fibonacci retracement) before a move toward the target point at 1.41464.
---
Technical Breakdown
1. Trend Context
Price is trading above both the 50 EMA (1.40120) and 200 EMA (1.39622) → confirming bullish momentum.
The strong impulsive bullish candles indicate institutional buying.
2. Key Levels
Current Price: 1.40843
Retracement Zone (Potential Buy Area): Between the 0.62–0.79 Fibonacci retracement levels (≈1.4060–1.4040).
Target Point: 1.41464
3. Fibonacci Tool
The retracement tool is drawn from the most recent swing low to swing high.
The blue shaded zone marks the discount entry zone, ideal for smart money re-entry after a short pullback.
4. Expected Move
Scenario: Price retraces to the 0.62–0.79 zone (liquidity sweep or mitigation of demand)
Then: A bullish continuation toward 1.4146 target level, which aligns with previous liquidity or imbalance area.
5. Volume & Confirmation
Volume is moderate (14.73K), supporting a healthy bullish push after correction.
Candlestick structure shows strong bullish impulses with minor pullbacks → confirming buyer control.
---
Trade Idea Summary
Bias: Bullish
Entry Zone: 1.4060 – 1.4040 (Fibonacci discount zone)
Stop Loss: Below 1.4020 (beneath previous structure)
Target: 1.4146
Risk-to-Reward (RR): Approximately 1:3 or better
Mr SMC Trading point
---
Confirmation to Watch
Bullish rejection candle or engulfing pattern within the blue zone
EMA 50 holding as dynamic support
Possible equal highs liquidity sweep near 1.4146 as the final take-profit zone
Please support boost 🚀 this analysis

GBP/JPY) Bearish trend analysis Read The captionSMC Trading point update
technical analysis of updated GBP/JPY (1H) chart 👇
---
Market Bias: Bearish Continuation
Price is still respecting the descending channel and is currently in a corrective phase toward a key supply and confluence zone. The setup suggests another potential lower high forming before continuation to the downside.
---
Technical Breakdown:
1. Descending Channel Structure
Price remains within a clear bearish channel, creating consistent lower highs and lower lows.
The recent bullish push appears to be a corrective leg rather than a reversal.
2. EMA Dynamic Resistance
The 50 EMA (200.81) and 200 EMA (201.86) are both acting as dynamic resistance.
The zone between these EMAs aligns perfectly with the Fibonacci retracement (0.62–0.79) — a strong area for potential reversal.
3. Fibonacci Retracement
Current retracement is testing between the 0.62 (201.0) and 0.79 (201.8) levels.
This Fibonacci zone overlaps with previous structure and EMAs — forming a confluence zone for possible bearish rejection.
4. Liquidity Sweep Potential
A minor push above the 0.705–0.79 zone may grab liquidity before reversing.
This setup hints at a fakeout spike followed by a bearish impulse continuation.
5. Target Zone
The next projected move aims for the 198.820 target area, matching the previous swing low and channel support.
---
Trade Plan Idea:
Entry Zone: 201.0 – 201.8 (0.62–0.79 retracement & EMA confluence)
Confirmation: Bearish candle formation or lower timeframe BOS (Break of Structure)
Stop-Loss: Above 202.0 (beyond liquidity sweep area)
Take-Profit:
TP1: 200.0 (psychological level)
TP2: 198.8 (target zone)
---
Notes:
Maintain patience for clear rejection signs at the 201.0–201.8 zone before entering.
The overall bearish channel remains intact — bias stays bearish until a clean break and close above 202.0 occurs.
Avoid chasing the move early; wait for a liquidity grab confirmation.
Mr SMC Trading point
Summary:
GBP/JPY remains bearish within the descending channel. Price is currently in a pullback toward the 0.62–0.79 retracement zone near 201.8, where strong resistance is expected. A rejection from this area could trigger the next bearish leg toward 198.8.
Please support boost 🚀 this analysis

GBP/JPY | Bearish Bias Below Pivot ZoneThe market currently maintains a Bearish Bias (a tendency for the price to fall) as the pair has stabilized below the Pivot at 201.22. Stability below this level signifies seller dominance.
The analysis suggests a corrective move (a temporary bounce) might occur back towards the $201.22$ Pivot to test it as strong Resistance (an upper barrier), before any further decline resumes.
Primary Scenario: Bearish Continuation (While Below 201.22)
As long as the price remains below the $201.22$ Pivot level:Bearish momentum is expected to extend.
The downside potential is maintained, and traders will target the following Support (Lower Support Line) levels:
- Initial Target: $199.29
- Intermediate Target: $198.01
- Main Target: $196.15$
In essence, if $201.22$ holds as Resistance, selling pressure is likely to push the price towards these lower support levels.
Alternative Scenario: Bullish Reversal (Above 201.22)
If a convincing breakout and stabilization occurs above the $201.22$ Pivot level:This condition could signal a Bullish reversal (a tendency for the price to rise).
Market momentum would shift to the upside, opening the path towards the next Resistance (Upper Barrier Line) levels:
- Initial Upside Target: $203.43
- Further Upside Target: $204.88

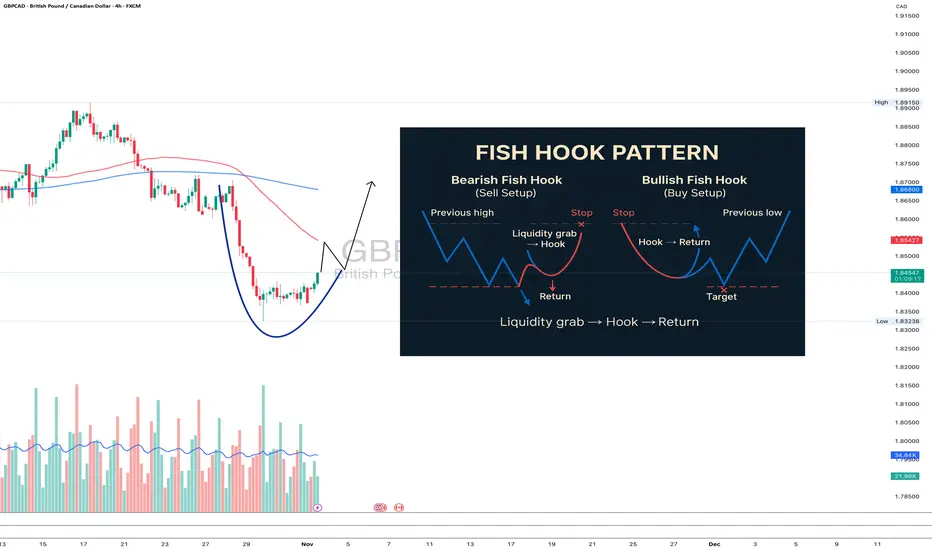
Fish Hook Pattern: the setup that catches liquidity, not tradersThere’s one pattern that never gets enough attention in textbooks, yet it’s one of the purest reflections of smart money logic - the Fish Hook.
It looks simple: price breaks out, triggers stops, traps breakout traders, and snaps back just as fast. But the psychology behind it is what makes it truly powerful.
When the market consolidates under a level, stop orders start to pile up. Big money knows that liquidity sits there - waiting to be taken. They push the price beyond the level, trigger the stops, and absorb liquidity. The breakout traders think they’ve caught momentum, but in reality, they’ve just become the exit liquidity.
Then comes the reversal - fast, decisive, emotional. That sharp return to the range is the “hook.”
If price breaks a key high or low and immediately rejects it - without structure, without a clean retest - you’re watching a Fish Hook in action.
The entry comes on the retest of that level from the opposite side. The stop goes right beyond the “hook’s tip.” Targets? The opposite edge of the range or the next liquidity pool.
The beauty of the Fish Hook lies in its simplicity. It’s not an indicator or a signal. It’s the behavior of money - watching how capital manipulates emotion.
When you start to see it often, you realize the market isn’t random. It’s intentional.
Trading becomes less about chasing candles and more about reading footprints. Fish Hook setups happen daily across pairs, stocks, and crypto and once you train your eye, you’ll never unsee them.
If your stops keep getting hit before the move - congratulations, you just met the Fish Hook from the wrong side.
GOLD (XAU/USD): Bulls Eye $4,125 – Breakout Imminent?Gold dropped to a significant horizontal support level last week.
The price subsequently rebounded from this level, forming a rising triangle pattern on a 4-hour timeframe.
The neckline of this triangle is defined by an intraday horizontal resistance.
Its bullish violation (4H candle close above) can be a nice trigger to buy Gold with a confirmation.
Should this occur, a bullish continuation towards 4125 would be anticipated.
Conversely, a bearish movement and a break below the vertical support level could potentially lead to a further decline in price.

Gold Market Update, Smart Money Levels & Macro Insight (29 Oct)OANDA:XAUUSD GOLD ANALYSIS – What’s Moving the Market Today?
Trade with DECRYPTERS | Let Levels Guide Your Moves
🚀 Market Pulse
Gold remains steady near $4,015, consolidating as the U.S. Dollar Index (DXY ~99.25) limits upside momentum amid renewed optimism over trade talks.
The Federal Reserve’s 25bps rate cut, combined with Powell’s cautious tone on future pauses, lifted yields temporarily, pressuring short-term gold sentiment.
Meanwhile, central banks continue strong accumulation, adding roughly 710 tonnes per quarter, led by China (11th consecutive month of buying).
These consistent inflows act as a price floor, keeping gold resilient even during intraday volatility.
🌍 Geopolitics & Safe-Haven Demand
Rising geopolitical risks and tariff concerns have revived gold’s safe-haven appeal.
During uncertainty, gold’s negative correlation to risk assets strengthens, when fear rises, gold shines.
Investors maintain exposure through ETFs and physical holdings, expecting volatility to persist ahead of key macro data.
📊 What to Watch Next
* Nov 1: U.S. Jobs Report (~150K expected)
→ A weaker print may revive rate-cut expectations.
* Nov 13: U.S. CPI Report
→ If core inflation holds near 3.0%, the Fed may pause rate cuts.
* Any flare-up in Middle East tensions or trade issues could trigger sharp rallies from key support zones.
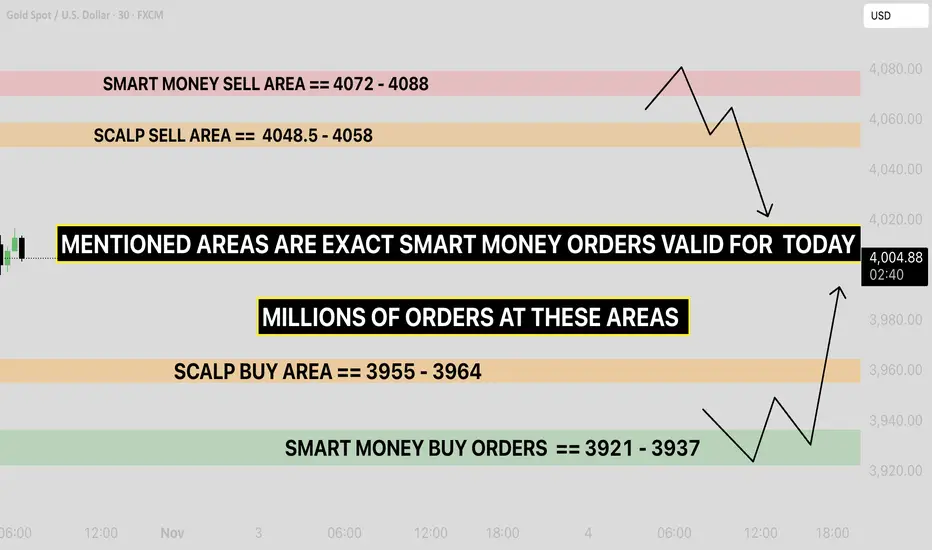
💹 Technical Framework (Smart Money Map)
📈 Current Price: ~$4,015/oz (+0.06%)
📊 Volatility Range: $3,980 – $4,050
* 🟥 Smart Money Sell Area: $4,072 – $4,088
→ Heavy institutional orders, short-term reversal zone.
* 🟧 Scalp Sell Area: $4,048.5 – $4,058
→ Ideal intraday reaction zone.
* 🟨 Scalp Buy Area: $3,955 – $3,964
→ Expect quick liquidity sweeps and bounces.
* 🟩 Smart Money Buy Orders: $3,921 – $3,937
→ Deep liquidity zone, institutional accumulation likely.
🧠 Conclusion – Mild Bullish Bias Within Consolidation
Gold is holding steady between central bank demand and Fed caution.
Bias remains mildly bullish within consolidation — supported by institutional inflows and geopolitical uncertainty.
📌 Above $4,000 → opens room to $4,200.
📌 Below $3,950 → exposes $3,921–$3,937 buy zone.
Stay patient. Let levels confirm direction — trade reaction, not prediction.
BTC UPDATES OCT 31, 2025The price needs to break out of the current range. I’ll take some time to rest, observe the new trend, and analyze the best opportunity. Have a great weekend!

XAU/ USD Bullish trend analysis Read The captionSMC Trading point update
-
Technical analysis of XAU/USD (Gold Spot)
Timeframe: 1H (OANDA)
Technical Basis: Smart Money Concepts (SMC) + EMA Confluence
---
Market Structure
Current trend: Bearish, price respecting a descending wedge/channel.
Recent Break of Structure (BOS) confirms bearish momentum continuation.
Price is retracing after forming a new low and may move back to mitigate imbalance (FVG).
---
Key Technical Areas
Retracement Levels:
0.5 – 0.79 Fibonacci zone marks the premium shorting area.
Fair Value Gap (FVG) zone between 0.62–0.79 levels is the ideal entry region.
EMA Resistance:
EMA-50 ≈ 4,067
EMA-200 ≈ 4,120
Both EMAs align with the supply zone, strengthening sell bias.
---
Projected Move
1. Expected retracement toward the 4,067–4,100 zone (supply/FVG region).
2. Potential short entry within that area.
3. Bearish continuation targeting the next structural low at 3,960 (as marked).
---
Targets
Next Target (retracement zone): 4,089
Final Bearish Target: 3,960
Mr SMC Trading point
---
Summary
Gold remains under bearish pressure within a contracting structure. A retracement to the premium zone (4,067–4,100) offers potential short opportunities aligned with structure and EMA resistance. A break below 3,995 would further confirm bearish continuation toward 3,960.
---
Pelas support boost 🚀 this analysis

XAU/USD Bullish trend analysis Read The captionSMC Trading point update
Technical analysis of XAU/USD – Bullish Continuation Setup (1H Chart)
Technical Overview:
Instrument: Gold Spot (XAU/USD)
Timeframe: 1 Hour
Current Price: $4,114
Next Target: $4,220
---
Chart Breakdown:
1. Demand Zone (Blue Box):
The price has respected a key bullish order block / demand zone between $4,040 – $4,080, showing strong buyer reaction (green arrows).
2. Ascending Trendline Support:
Multiple rejections from the ascending trendline confirm higher lows, signaling ongoing accumulation from buyers.
3. Fibonacci Retracement:
The market retraced around the 0.618 – 0.786 Fibonacci levels — a strong buy zone for continuation setups.
4. Moving Averages (EMA 50 & EMA 200):
EMA 50 (Blue) is trying to cross above the EMA 200 (Black), hinting at a possible bullish crossover.
A successful break above both EMAs would confirm bullish momentum.
5. Bullish Flag / Wedge Pattern:
The structure shows a bullish flag/wedge forming after an impulsive upward move — indicating potential for another breakout rally.
---
Trade Idea:
Buy Zone: $4,070 – $4,100
Target 1: $4,160
Target 2: $4,220 (main target on chart)
Invalidation (Stop Loss): Below $4,030
Mr SMC Trading point
---
Market Bias:
Bullish Bias – As long as the price holds above the highlighted demand zone and the ascending trendline, buyers remain in control. A breakout above recent highs will confirm momentum toward the next target.
---
Pelas support boost 🚀 this analysis

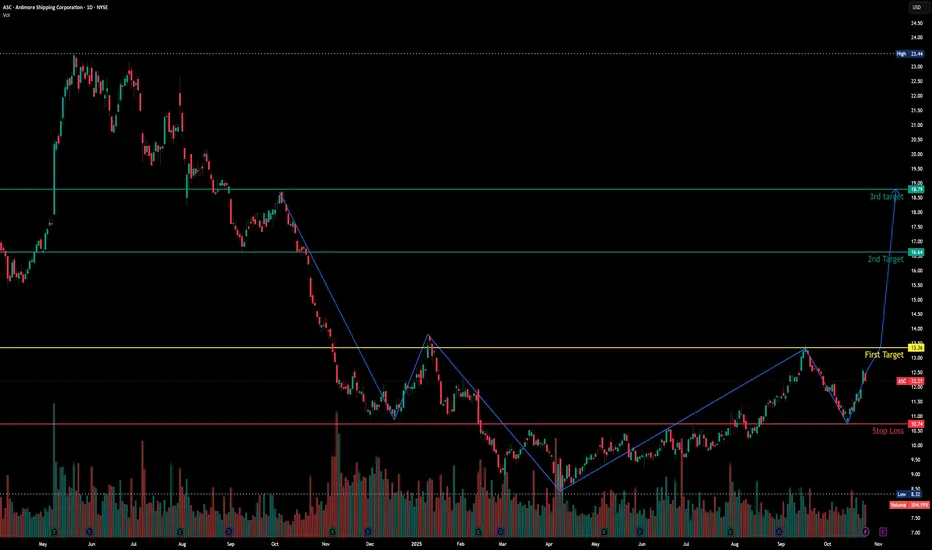
Ardmore Shipping Corp - Exciting Chart Pattern Disclaimer: This post is purely based on technical chart analysis and is not a recommendation to buy or sell. Please do your own research and consult with a financial advisor before making any investment decisions.
Last Year in May 2024, stock price was at nearly $23. from that level it fall to $8.5.
During this fall and rise, stock has made an inverted Head and Shoulder Chart Pattern.
According to my analysis , i have marked some of levels on the chart for reference.
Please share your thoughts.
Best wishes.
XAU/USD) Bullish trend analysis Read The captionSMC Trading point update
Technical analysis of XAU/USD (Gold), 4H timeframe — here’s the detailed breakdown 👇
---
Trade Idea: Bullish Continuation Setup — XAU/USD
Market Context
Gold has been in a strong uptrend, forming higher highs and higher lows.
Price has recently broken above the previous resistance zone, signaling bullish continuation.
---
Key Technical Points
1. FVG (Fair Value Gap) Zone
The chart highlights an FVG area around 4,060–4,080, which now acts as a potential retracement zone.
Smart money often drives price back into these imbalances to mitigate orders before continuing the move up.
2. Retest Opportunity
Expect a pullback into the FVG zone, followed by bullish confirmation (rejection candle or structure shift).
This creates a high-probability long entry zone aligned with the prevailing bullish order flow.
3. Key Support Level
The 3,940–3,970 zone below acts as a major support / demand area, reinforcing the overall bullish bias.
4. Target Point
The projected target point is around 4,250, based on the measured move from the FVG breakout structure.
This aligns with liquidity resting above previous highs — a likely take-profit zone for institutional traders.
---
Trade Plan
Entry: Wait for price to retrace and show bullish confirmation inside the 4,060–4,080 (FVG zone).
Stop Loss: Below 4,040 (beneath imbalance / last swing low).
Take Profit: 4,250 target zone — completion of the bullish leg.
---
Market Logic
This idea follows Smart Money flow principles:
Break of structure (BOS) confirms bullish control.
Retracement to FVG provides a discounted entry.
Target liquidity above prior highs for exit.
--- Mr SMC Trading point
Summary:
Gold remains in a strong bullish phase — look for retracement entries into the FVG for continuation toward 4,250.
Please support boost 🚀 this analysis

USD/CAD) Bullish trend analysis Read The captionSMC Trading point update
Technical analysis of USD/CAD Bullish Continuation Setup (4H Chart)
Technical Overview:
Instrument: U.S. Dollar / Canadian Dollar (USD/CAD)
Timeframe: 4-Hour
Current Price: ~1.4028
Bias: Bullish
---
Chart Breakdown:
1. Fair Value Gap (FVG) Zone – Demand Area (Yellow Box):
Price recently filled the FVG and respected the 1.3970–1.3990 support zone.
This zone acted as a bullish mitigation area, showing institutional buying interest.
2. Structure Shift:
After consolidating, USD/CAD broke above short-term highs, confirming a bullish market structure shift (MSS).
The ongoing pullback into the FVG area could serve as a retest entry point.
3. Target Point:
Projected target is around 1.4124, aligning with previous liquidity highs.
This move suggests a potential +100 pips upside from current levels.
4. Trade Plan:
Entry Zone: 1.3980 – 1.4000 (on FVG retest)
Target: 1.4124
Invalidation: Below 1.3950 (if structure fails and price re-enters deeper range)
Mr SMC Trading point
---
Trading Insight:
This setup reflects a Smart Money Concepts (SMC) bullish continuation pattern.
The market has broken structure to the upside and is likely to continue higher after a brief retracement into the fair value gap zone — targeting liquidity resting above 1.4124.
---
Please support boost 🚀 this analysis

BTC/USD) Bullish trend analysis Read The captionMr SMC Trading point update
---
Technical analysis of BTC/USDT Bullish Reversal Setup (4H Chart)
Technical Overview:
Instrument: Bitcoin / Tether (BTC/USDT)
Timeframe: 4-Hour
Current Price: ~$114,842
Bias: Bullish Continuation
---
Chart Breakdown:
1. Fair Value Gap (FVG) Break & Retest Zone (Yellow Box):
Price has broken above a key FVG zone, suggesting a shift in market structure from bearish to bullish.
The current consolidation above this area indicates that buyers are defending the zone.
2. Structure Shift:
The recent break of lower highs marks an internal bullish market structure shift (MSS).
Pullback to the FVG zone offers a potential entry point for longs.
3. Target Point:
The projected bullish move points toward the $126,088 area, which aligns with a prior supply zone / liquidity pool.
This target represents an approximate +10% upside potential from current levels.
4. Trade Scenario:
Entry Zone: Around $114,000 – $113,500 (retest of FVG).
Target: $126,000 area.
Invalidation: Below $112,000 (if price breaks back inside FVG).
Mr SMC Trading point
---
Trading Insight:
This setup aligns with a Smart Money Concepts (SMC) perspective — price filled imbalance, broke structure, and now may seek higher liquidity zones. A successful retest of the FVG could trigger a strong bullish continuation toward the marked target zone.
---
Please support boost 🚀 this analysis

USD/JPY) Bearish Trend analysis Read The captionSMC Trading point update
Technical analysis of USD/JPY (1H) chart shows a bearish SMC (Smart Money Concept) setup — here’s the idea breakdown
---
Trade Idea: Bearish Setup — USD/JPY
Market Context
Price has been in a strong bullish trend, reaching a local high near 152.35.
Recently, the price broke structure to the downside, signaling potential shift from bullish to bearish order flow.
---
Key Technical Points
1. FVG (Fair Value Gap) Break
The chart marks an FVG break zone around 152.30–152.45.
This zone acts as a premium re-entry area where institutional traders may rebalance orders before pushing price lower.
2. Rejection Zone (Supply Area)
Price is currently retracing back into the FVG zone, forming potential lower-high structure.
Expect rejection confirmation (bearish candle / liquidity sweep) before continuation down.
3. Bearish Continuation Expectation
After the retest, price is projected to drop toward the lower demand zone / target point around 150.25.
That area aligns with previous demand / liquidity pool, a likely point for profit-taking or reversal.
---
Trade Plan
Entry: Wait for bearish rejection or liquidity sweep inside the 152.30–152.45 zone.
Stop Loss: Above 152.50 (above FVG high).
Take Profit: Around 150.25 target zone (major demand area).
Mr SMC Trading point
---
Market Logic
The structure shows:
Break of structure (BOS) confirming bearish shift.
Fair Value Gap retest for premium entry.
Liquidity targeting at the lower demand zone.
This setup follows institutional flow — sell after retracement, target imbalance fill.
---
Please support boost 🚀 this analysis

Jio Financial service at buying place Jio Financial service at buying place
At fibonacci support 0.5 level and target to next level and next level

XAU/USD) Bullish trend analysis Read The captionSMC Trading point update
Technical analysis of XAU/USD (15m timeframe) chart analysis:
---
Bullish Gold Setup
Chart Pattern: Price broke out of a triangle consolidation after retesting the order block (OB, yellow zone). This signals accumulation before continuation.
Order Block (OB): The zone around 3,836 – 3,840 acted as a strong demand area. Price respected it and bounced back.
EMA Support:
50 EMA (red) is sitting just above the OB, providing short-term support.
200 EMA (blue) is trending upward, confirming underlying bullish bias.
Projection: The breakout is expected to expand higher toward the measured move target.
---
Target Point
3,883.44 is the projected upside target.
This aligns with the breakout projection and prior liquidity grab zone.
Mr SMC Trading point
Trading Idea
Bias: Bullish.
Entry Zone: Pullback toward 3,836 – 3,840 OB for confirmation.
Target: 3,883.
Invalidation: A breakdown below 3,816 (200 EMA) would invalidate the bullish setup and suggest deeper retracement.
Please support boost 🚀 this analysis

XAU/USD) Bullish trend analysis Read The captionSMC Trading point update
Technical analysis of Gold (XAU/USD) 30-min chart you shared:
---
Gold (XAU/USD) – Bullish Setup (M30 Chart)
Market Structure:
Price is moving inside a bullish ascending channel.
Current retracement is pulling back toward a fair value gap (FVG, H4) highlighted in yellow.
Price is still holding above the 50 EMA (3806.16) and 200 EMA (3766.40), both sloping upward → confirming bullish momentum.
Key Levels:
Support Zone (Demand / FVG H4): 3810 – 3820 region (yellow box).
EMA 50: Acting as dynamic short-term support around 3806.
EMA 200: Stronger bullish base at 3766.
Target Point: 3857.19 (resistance zone & top of channel).
Price Expectation:
Likely scenario:
Price may retrace into the FVG support zone → bounce upward → continue inside the channel toward the target point 3857.
As long as the structure holds above 3806 (EMA 50), the bullish setup remains valid.
Mr SMC Trading point
---
Bias: Bullish
Target: 3857.19 Key Support: 3810 – 3820 zone (FVG + EMA confluence)
Please support boost 🚀 this analysis

BTC/USDT Bearish Trend analysis Read The captionSMC Trading point update
Technical analysis of BTC/USDT (4H timeframe) chart analysis:
---
Bearish Bitcoin Setup
Trend: The market is clearly in a downtrend, with price respecting the descending channel.
Fair Value Gaps (FVG): Two FVG zones are highlighted where price retraced to fill imbalances.
Moving Averages:
50 EMA (red) and 200 EMA (blue) are above price, confirming bearish momentum.
Key Resistance: Price is currently retesting the FVG supply zone around 111,000 – 111,500, which aligns with the descending trendline.
Rejection Expected: If sellers defend this zone, price is likely to continue its bearish trajectory.
---
Target Point
A measured move suggests a potential drop towards 106,218 (next support / target zone).
This aligns with the channel’s lower boundary.
.
Mr SMC Trading point
---
Trading Idea
Bias: Bearish.
Entry Zone: Around 111,000 – 111,500 (FVG supply & trendline confluence).
Target: 106,218.
Invalidation: A breakout above 113,000 (200 EMA) would weaken the bearish setup.
---
Please support boost 🚀 this analysis

USD/ CAD) Bullish Analysis Read The captionSMC Trading point update
Technical analysis of USD/CAD (1H timeframe) chart analysis:
---
Bullish USD/CAD Setup
Support Zone: Price is respecting the support level (yellow box around 1.3920 – 1.3930).
Moving Averages:
50 EMA (red) is below current price, providing short-term bullish support.
200 EMA (blue) is also trending upward, confirming overall bullish bias.
Market Structure: Higher highs and higher lows suggest continuation to the upside.
Projection: Price is expected to bounce from the support zone and push toward the next resistance/target.
---
Target Point
1.3998 (near 1.4000 psychological level).
This aligns with the measured move projection from the last impulsive rally.
Mr SMC Trading point
---
Trading Idea
Bias: Bullish.
Entry Zone: Around 1.3920 – 1.3930 (support level retest).
Target: 1.3998.
Invalidation: A sustained break below 1.3900 would invalidate the bullish scenario.
---
Please support boost 🚀 this analysis

XAU/USD Bullish trend analysis Read The captionSMC Trading point update
Technical analysis of XAU/USD Bullish Channel Setup (4H Timeframe)
---
Chart Summary:
Pair: Gold Spot (XAU/USD)
Timeframe: 4H
Exchange: OANDA
Current Price: $3,759.85
EMA 50: $3,718.68 (short-term support)
EMA 200: $3,576.42 (major support)
---
Key Elements in Chart:
1. Ascending Channel Formation
Price is moving inside a clear rising channel (higher highs & higher lows).
Upper and lower boundaries are acting as dynamic resistance & support.
2. Support Levels (Yellow Zones)
$3,720–3,740 zone: strong support with EMA 50 confluence.
$3,600–3,620 zone: deeper support, aligned with EMA 200.
3. Breakout & Retest
Price broke a short-term descending trendline, signaling bullish continuation.
Retest of support level confirms buyers are active.
4. Bullish Projection
Based on measured move (previous impulse), projection suggests a rally towards $3,877.07 (target point).
Mr SMC Trading point
---
Conclusion:
The chart signals a bullish continuation inside the ascending channel.
Bullish Scenario: Holding above the $3,720–3,740 support zone, price is expected to rally toward the $3,877 target.
Invalidation: A 4H close below $3,718 (EMA 50) could open a deeper correction toward the $3,600 support (EMA 200).
---
Pelas support boost 🚀 this analysis

USD/JPY) Bearish Trend analysis Read The captionSMC Trading point update
Technical analysis of USD/JPY (1H timeframe) chart analysis:
---
Bearish USD/JPY Setup
Rejection at Resistance: Multiple rejections (red arrows) show strong selling pressure around 149.70 – 149.80 zone.
Fair Value Gap (FVG): Price may retest the FVG supply area before continuing lower.
Moving Averages:
50 EMA (red) is turning flat, showing short-term weakness.
200 EMA (blue) is below, acting as the larger support zone.
Market Structure Shift (MSS): Breakdown of recent support suggests bearish intent.
---
Target Point
Expected drop towards 148.38 – 148.37 (aligned with 200 EMA & previous demand zone).
Mr SMC Trading point
---
Trading Idea
Bias: Bearish.
Entry Zone: Retest of 149.60 – 149.70 (FVG).
Target: 148.38.
Invalidation: A break above 150.00 would invalidate the bearish outlook.
Please support boost 🚀 this analysis

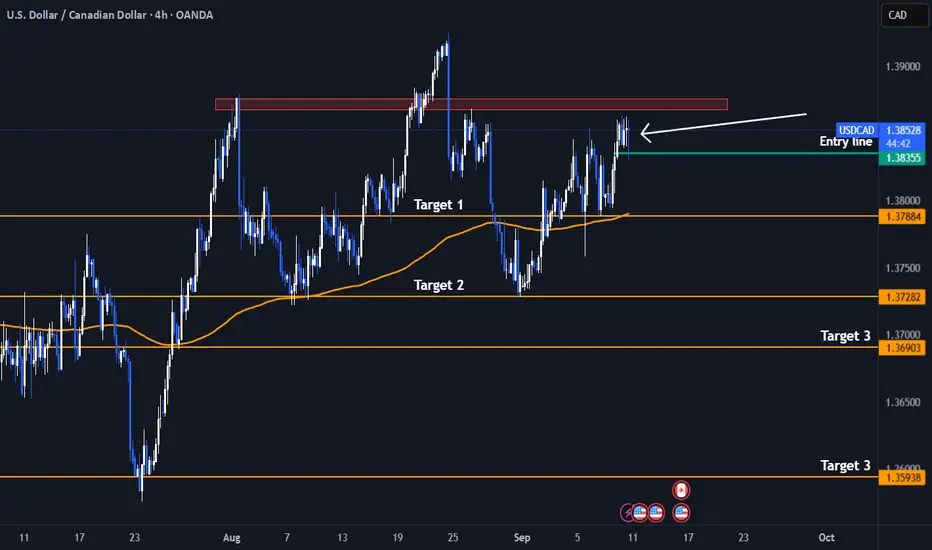
Short! Short! USDCAD - Double Head and Shoulder PatternI have identified a clear head and shoulders pattern forming within a larger head and shoulders structure on the daily timeframe for USD/CAD, indicating a potential bearish reversal.
From a fundamental perspective, several key factors are contributing to the current weakness in the Canadian dollar against the US dollar:
Canada's labor market showed significant weakness in August 2025, with a notable loss of 65.5 thousand jobs and a rise in unemployment to 7.1%, the highest in years. This has increased market expectations for monetary easing from the Bank of Canada (BoC).
Although core inflation remains above target, the weak jobs data is pushing the BoC towards potential rate cuts or a more accommodative policy stance, which weighs on the Canadian dollar.
The market is currently pricing in a very high chance (around 98%) of an additional rate cut by the BoC in September, following previous reductions to 2.75%. This dovish stance contrasts with the Federal Reserve’s more cautious or hawkish approach, creating a wider interest rate differential that supports US dollar strength.
Additionally, declining oil prices, a major export for Canada, are exerting further downward pressure on the CAD.
While recent US economic data has been mixed, the Fed is generally seen as less dovish than the BoC, sustaining demand for the USD.
Trade tensions and geopolitical risks between the US and Canada add to concerns over Canada’s growth outlook, contributing to CAD depreciation risk.
Trade Tip
A strong close below the Entry line will be a perfect entry /4hr TF
Stoploss : Above the Left Shoulder (Red Rectangle)
In summary, the combination of a weakening Canadian economy, dovish BoC bias, lower oil prices, and interest rate divergence between the US and Canada all support a bearish outlook for USD/CAD, which aligns well with the bearish head and shoulders pattern I have spotted on the chart.
Not an Investment Advise