The Language of Price | Lesson 4 – Linking Candlesticks PracticeLesson Focus: Candlestick Combinations (Practice)
In the previous lesson, we explained combining candlesticks together using a theoretical illustration.
In this lesson, the same concept is now shown in practice on a real market chart , allowing the theoretical ideas to be observed in real price behavior.
📊 WHAT ARE WE LOOKING AT?
This chart demonstrates how individual candlestick behaviors can be combined together to read market structure more clearly.
Instead of focusing on a single candle, we observe how multiple candles communicate together over time within their surrounding context.
For readers who have not seen the previous lesson , reviewing the theoretical explanation of candlestick combinations may help provide clearer understanding, as this example directly builds on it.
🧠 COMBINATIONS IN PRACTICE
On this real chart example, you can see repeated combinations of:
• Shrinking candles → slowing momentum
• Long wicks / inverse long wicks → rejection and reaction
• Inside candles → consolidation within range
• Change color candles → pressure shift
• Momentum candles → temporary dominance
When several of these behaviors appear together, they provide a stronger directional bias compared to reading only one candle in isolation.
📌 IMPORTANT CLARIFICATION
• This is market reading , not prediction
• Bias does not mean certainty
• Candlesticks reflect past price behavior
• Nothing shown here is guaranteed
This example is presented strictly for educational and analytical purposes .
Those interested in continuing this educational series may choose to follow along, as upcoming lessons will further build on these concepts and explore market structure step by step.
ETHICAL & EDUCATIONAL NOTICE
This content is presented solely for educational and analytical purposes , based on historical price data.
It does not promote or encourage any specific trading method, financial instrument, gambling, leverage, margin usage, short selling, or interest-based activity .
Readers are encouraged to align any financial activity with their own ethical, legal, and religious principles .
⚠️ DISCLAIMER
This material is strictly educational and informational .
It does not constitute financial advice, investment recommendations, or trading instructions.
The author does not provide personalized guidance.
Any decisions made based on this content are the sole responsibility of the individual.
Chartreading

CHART SPEAKS- PSU BANKS#NiftyBank - PSU Banks have been rallying over a week. News came in Today. Was someone already aware of this?
The NEWS
UPDATE ON PSU BANKS: GOVT CONSIDERING TO RAISE FOREIGN INVESTMENT LIMITS IN PSU BANKS FROM THE CURRENT 20% -ET NOW
That's why I am Strong believer of Price Action. #Chartspeaks #chartsabkuchboltahai
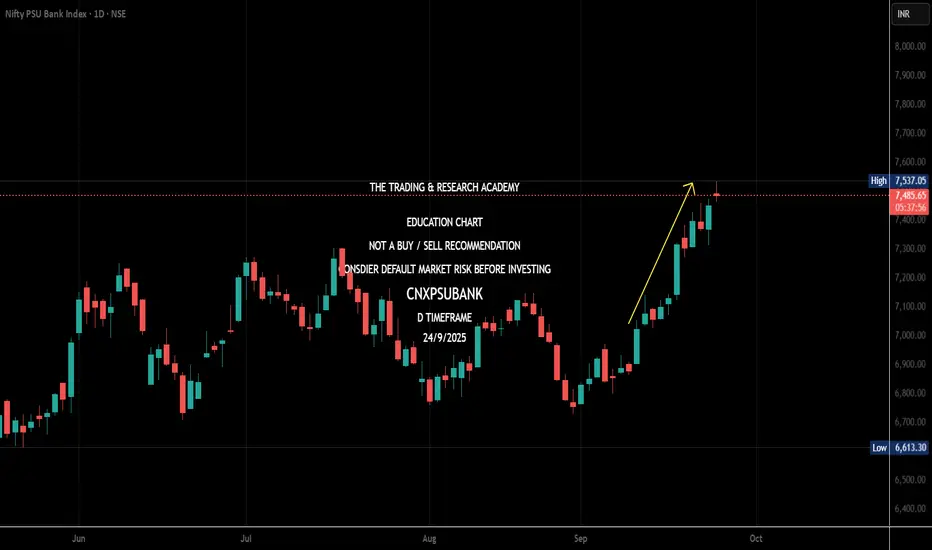
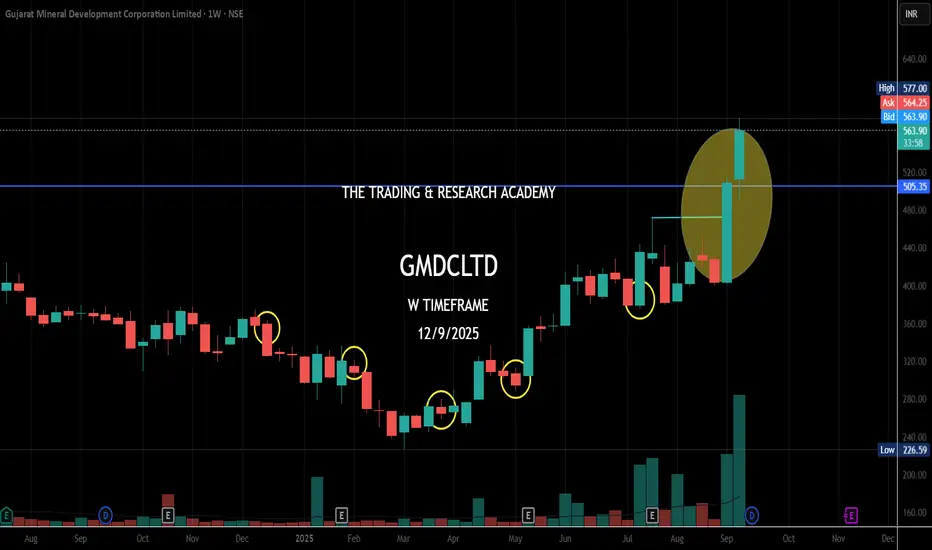
Chart Speaks- GMDCI have been sharing for a long time now about News v/s Chart analysis. I am a strong believer that any development about the company is visible on chart, be it positive or negative. This time its GMDC.
Read the News -
CENTRE PREPARING INCENTIVES TO ENCOURAGE DOMESTIC PRODUCTION OF RARE EARTH MAGNETS: KUMARASWAMY: MONEYCONTROL
Company was in the news since early this month on rare earth materials. Price action already hinting it since March, April, July & Aug 2025.
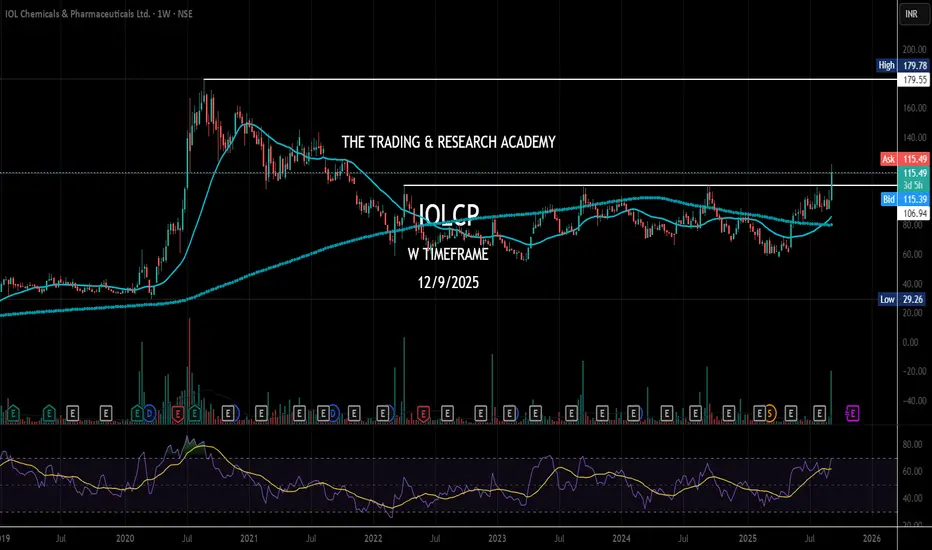
Stage Breakout - IOLCPStage Breakout - IOLCP
This counter had hit my SL in 2023 & 2024 B/o attempts. I am hopeful it would not disappoint me this time. B/o with volume seems it's getting ready.
Stage Breakout with interesting pattern. Let's see whether it reaches & crosses 180 level.
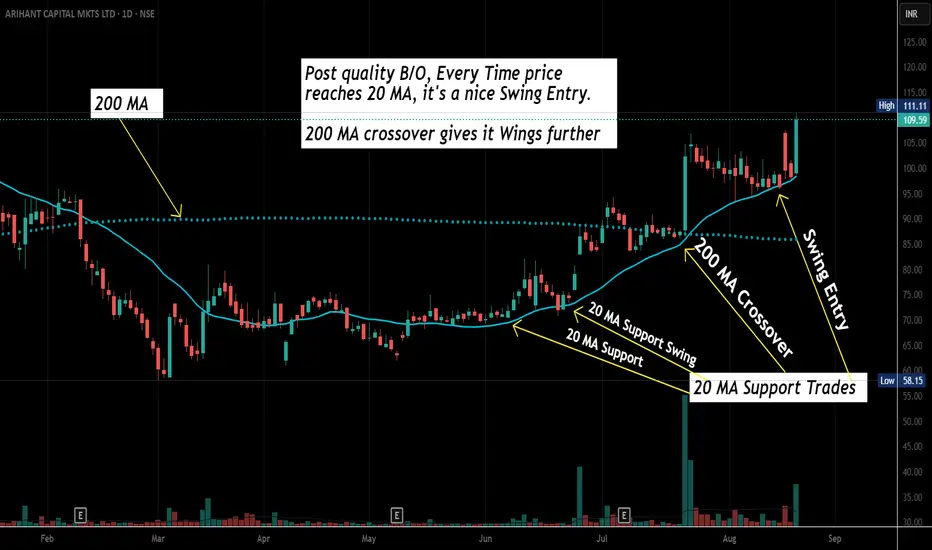
Swing Trading Basic- How to Select a Stock for SwingHow to identify a Swing Trading Set up.
Let's take an Example of "Arihant Capital Fin". During that Reversal, price start floating above 20 MA. That's an early sign- Real Time EOD Price is now trending above 20 Day's Average price. It means now price is above monthly Average (22 Trading Days /Month).
Additionally, Volume confirmation also suggest same trend direction (During June 2025). Moreover 20 MA stops decline, pauses & starts it's reversal Journey. Exactly from hereon, if Price starts giving VCP or 20 MA Supporting scenario, get ready for a Swing Trade in such Stocks. You'll see in the chart, every dip to 20 MA was bought nicely.
This is not a buying/ trading advise. Market Factor, Stock & Sector specifics, needs to be considered for trading. Every stock has it's own soul of price movement. This is a psychological journey than Scanning, indicators & Technical skills. You'll master it if you repeatedly practice min 20 charts a Day for at least 6 months!
Wish you Happy Trading & Happy Learning!
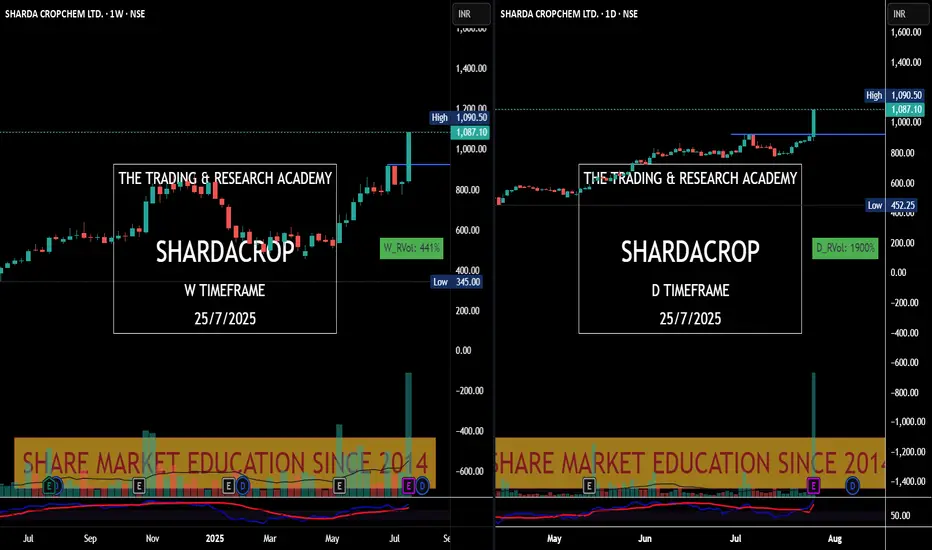
Charts Speak #Sharada Cropchem
Sharada Cropchem
Charts always lead the News! This is yet another example where price was leading & News came later.
Stock was under accumulation since June with higher qty. In fact since May 25, it was getting bought in average 2-3M qty weekly. What a planned buying..
28th May, 4 June, 18th July were nice buying alarms for us. Today it was just a final nail in the coffin.
Mount Fuji Series- Old runners waking upMount Fuji Series- Old runners waking up -
TARC - started running after 50-70 levels.. hope getting ready again.
Realty company with good land holding. Funda strong company.

XAUUSD is in a slight retracement after reaching all time high.This is my trade idea for gold. Overall, gold is still bullish and hasn't broken major market structure and is basically in a retracement/pullback. Lets see if it respect the 1HR fvg and heads back down to the downside. TradeIdea

Necklace Breakout - Kirloskar Engine OilNecklace Breakout- Kirloskar Eng Oil
A Necklace Breakout - i.e. neckline breakout can explode into wilder momentum like this.
I have been holding this from 300 level. It has grown to 900++ & became 3X now within a year.

Necklace Pattern-Hindustan CompositeNecklace Pattern-Hindustan Composite.
Is this counter going to hit it's own high? Let's see how mystery unfolds!

Necklace Pattern Breakout- Omaz Auto LtdNecklace Pattern Breakout- Omaz Auto Ltd
Looks like multi year range is ready for a breakout after repeated failed attempts. Let's see how market reacts to this attempt.
This is not a Buy/Sell Call. Chart shared for educational purpose only.

Baby Steps Pattern-TriveniBaby Steps Pattern- High Probability of Good Up-Move.
This is only for Educational Purpose.
Not a Buy/Sell Call.
Do your own Research! (DYOR)

Necklace Pattern Series = DLFDLF has formed initial steps of beginning a Necklace. It will be interesting to see whether Real Estate sector grow up & DLF re-claims it past glory!
This is purely for education purpose & Not a Buy Call!

Weekly Squeeze Setup = Sarveshwar FoodsNew Entry in Sarveshwar Foods last week basis Weekly Squeeze bars & Higher Low Formation. Hope the range breakout continues!

Necklace Pattern Series = Centum ElectronicsThis stock is approaching for its lifetime high & it it does so, it will complete 2nd Necklace. This re-claiming Life Time High may open doors for forward move!
This is not a Buy Call, chart shared for learning purpose.

Necklace Pattern Series - "Sanghvi Movers"This counter is about to complete Necklace Pattern & ready to fly thereasfter!

Necklace Pattern Completed - "Aptech" Aptech has completed our theory of "Necklace Patter" beautifully! Its re-approaching it's life time high & may explode further. It'll be interesting to see how it reacts near its high.

Necklace Pattern and Trendline Break Out = WABAGThis scrip showing high potential to move up with 2 factors as mentioned in subject line.
1. It has Necklace Pattern follow up &
2. Its breaking Trendline.

TAJ GVK - Ready for Up Mmove?If R1 is crossed successfully, TAJ GVK seems to be ready to hit T1 & T2. It's going to be interesting set up going ahead. Have look at MACD Cross over on Daily TF as well.

Techno Funda Analysis = Neuland LabIn this video I have explained how to analyze a stock Technically & Fundamentally. Using simple & free Website of BSE India.
This video is only for Learning Purpose & not a Buy Call or tip! Viewers discretion is solicitated.

Necklace Pattern = KECLMy favorite "Necklace Pattern" is getting unfolded in "KECL" on monthly Time Frame. In fact, this Kirloskar Group is seriously re-vamping all its group companies & it's evident in their charts as well!
Referring Monthly TF on BSE Chart since NSE has limited data to study for this scrip.
Cheers!

Catching Falling Knife Series- How to Re-enter High Rally Stock Hello Everyone, I have tried to explain how to enter a stock which has already rallied. I have considered important levels for re-entry purpose. This idea is only for educational purpose & NOT a Buy Call!

Necklace Pattern Trading - "S Chand & Company"This has been highly dependable stock since last 1 month. When benchmark Index "Nifty" fell by 500 points, this stock was rock solid holding its swing high level & stayed in the range of just 20 points. This is my Necklace Pattern stock it will be interesting to see how story unfolds when it reaches its previous swing highs.
