Gold 29 July – H4 Demand Holds, M15 Structure ShiftsGold (XAUUSD) Analysis – 29 July
The Mirror is Forming at 3310: Structure + Reaction in Focus
The market has successfully held the H4 demand zone, particularly near the critical level around 3310. This level is not just another number on the chart — it’s an inflection point. A possible first higher low or swing low, from which the next directional leg in gold could emerge.
Yesterday’s price action swept liquidity beneath this zone and then showed a strong bullish reaction. This isn’t just a bounce. It’s a behavioral shift — one that hints at absorption of selling pressure and the re-entry of aggressive buyers.
🔍 Structure Alignment: H4 + M15
On the H4 timeframe, price has stabilized within the demand zone.
Zooming into M15, we now see internal price action beginning to shift:
• First, a Change of Character (ChoCH) — the earliest clue that momentum is starting to turn.
• Then, a Break of Structure (BoS) to the upside — signaling potential bullish intent.
This multi-timeframe alignment — H4 support holding + M15 structure shifting — builds a strong case for a potential reversal and continuation of the uptrend.
📍 What Next?
The next step is to mark a refined M15 Point of Interest (POI) — a zone where price may pull back before making its next move upward.
We don’t chase price. We let it come to us.
✅ Look for Lower Timeframe Confirmation
Once price returns to your POI, it’s time to observe.
You’re not looking for obvious signals. You’re watching for subtle behavior —
a sharp reaction, a psychological flush, or a precise candle footprint that reveals intent.
The deeper signals aren’t always visible to the untrained eye — but they’re there for those who’ve studied the mirror.
( For those who know what to look for — this is where the sniper entry reveals itself. )
🎯 Summary
• Bias: Bullish — structure and reaction support long setups
• Plan: Wait for price to retest the M15 POI
• Execution: Only enter on confirmed lower timeframe intent and confluence
• Target: 120 pips (fixed, as per system)
• Stop Loss: 40 pips (always 1:3 R:R minimum)
📚 This is the kind of structure-based clarity we teach in The Chart is the Mirror .
Let the chart speak.
Let the structure guide you — not your emotion.
📘 Shared by @ChartIsMirror
Choch-bos-strategy

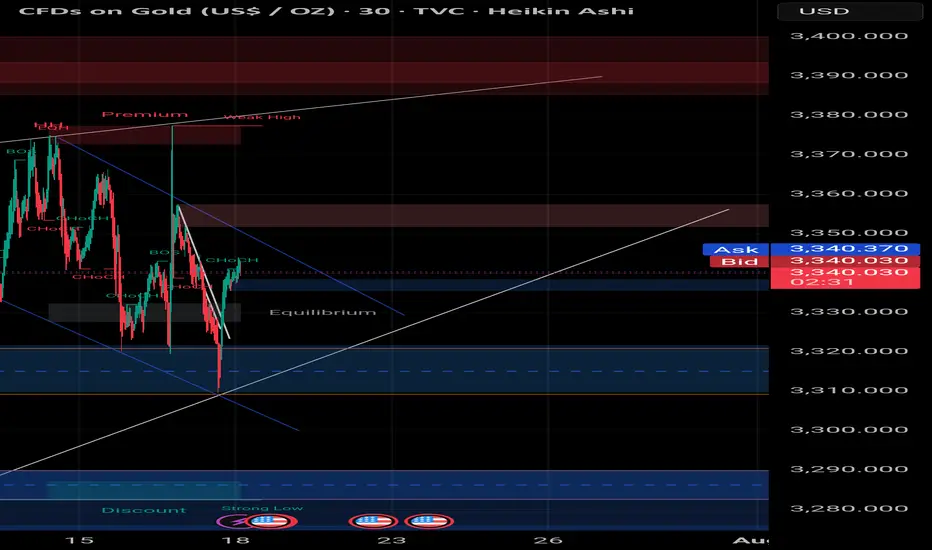
Smart Money Sell Setup on Gold (15-Min TF)# Smart Money Sell Setup on Gold (15-Min TF)
### 🔍 Market Context:
Gold has recently formed a strong bullish retracement after a sharp impulsive bearish move. Now, price has returned to a critical zone — the **Equilibrium level (EQ)** — which also aligns with a **valid supply zone** and **bearish trendline resistance**.
This zone is often considered the "decision point" where Smart Money evaluates whether to continue upward or resume the previous bearish trend.
---
## 📉 Strategy: Sell Limit Based on Structure + Liquidity
### ✅ Entry Zone:
**3341.500 – 3343.000**
(At the EQ zone + premium pricing area)
### 🛑 Stop Loss:
**Above 3345.000**
(Just beyond the last liquidity wick and top of supply)
### 🎯 Take Profit Targets:
- **TP1:** 3338.000 → First demand zone
- **TP2:** 3332.500 → Liquidity sweep target under previous lows
### 📐 Risk to Reward Ratio:
**1:3 or higher**, depending on execution precision.
---
## 🔎 Confluences Supporting the Setup:
| Factor | Confirmation |
|--------|--------------|
| EQ Zone (50% of previous move) | ✅ |
| Supply Zone | ✅ |
| Bearish Trendline Resistance | ✅ |
| Liquidity above EQ | ✅ |
| CHoCH + BOS (Market Structure Shift) | ✅ |
---
## 🧠 Why This Setup Works:
This is a classic **"Premium Price Rejection"** in a bearish environment, combining:
- Institutional logic (EQ level)
- Structural resistance (previous BOS)
- Liquidity traps above
---
## 🧵 Summary:
- **Sell Limit:** 3341.5 – 3343
- **SL:** 3345
- **TP1:** 3338
- **TP2:** 3332.5
- **RR:** 1:3+
- **Style:** Smart Money / Liquidity + Structure Based
---
🔔 **Disclaimer:** This is not financial advice. Always do your own analysis and manage risk accordingly.
#gold #XAUUSD #smartmoney #tradingview #liquidity #supplydemand #priceaction #forex #structure
How to use Dynamic Market Structure to track market moves🔍 Idea Overview
This chart demonstrates the effectiveness of the Dynamic Market Structure Indicator in live conditions, capturing key Break of Structure (BoS) and Change of Character (ChoCH) points. Each zone dynamically adapts based on price behavior and helps identify crucial turning points.
📌 Highlights from the Chart
• ✅ Early BoS detection led to accurate identification of the bullish breakout before the major rally starting May 7.
• ✅ Multiple successful ChoCH zones indicated potential reversal areas and pause zones during sideways consolidation.
• ✅ The green (BoS) and red (ChoCH) horizontal zones aligned perfectly with price reaction levels, acting as reliable support/resistance.
• ✅ During the pullback post-high, the indicator caught clear bearish ChoCH before price dropped nearly $2,000, showing high responsiveness.
📊 Summary of Performance
• Rally captured from ~95,000 to ~104,000 with early BoS signals.
• Sideways zones around 103,000–104,000 marked with structural shifts that predicted stalling.
• Post-drop behavior accurately highlighted re-test of ChoCH zones before reversal attempts.
⚙️ Indicator Logic (Brief)
• BoS (Green): Confirms trend continuation when structure breaks in the direction of the trend.
• ChoCH (Red): Signals a potential trend reversal with key level break.
No repainting. Zones are locked once confirmed.
In volatile markets like BTC, accurate detection of structural shifts can define risk and opportunity. This indicator consistently tracked evolving zones and highlighted major inflection points — without lag or overfitting.

Looking LongEUR/JPY has finally shown a Break of Structure within the higher timeframes. This gives me clear indication that the CHOCH yesterday was correct. Thus I should be looking for buyging positions.
