CHZUSDT – All Eyes on Vision Reveal: Key Levels to WatchChiliz (CHZ) rallied +142% off November’s lows, sweeping May’s highs and triggering stop runs on the bears. But momentum has cooled — price has now retraced over 50% ahead of the highly anticipated vision reveal scheduled for Tuesday.
Is this the calm before another leg up — or the setup for a classic "sell the news" move?
🟩 Support Zones to Watch
🔹 $0.04429 – Key support where bulls stepped in on Jan 31, rejecting bears after a stop raid below the Jan 6 swing low at $0.04253. This aligns with Dec 29’s bullish weekly void and the midpoint of last week’s long lower wick — strong confluence.
🔹 $0.04091 – Higher-timeframe support: the bullish monthly void from December, overlapping with an unfilled portion of Dec 29’s weekly void.
Inside this zone:
$0.04091 – $0.03982: Weekly void from Dec 31.
$0.03948 – $0.03827: Weekly void from Dec 30 — possible last line of defense if selloff deepens.
🟥 Resistance & Upside Targets
🔸 $0.04672 – Resistance from Jan 30’s distribution zone at the 40-day EMA, overlapping Jan 5’s now-invalidated bullish weekly void.
Breakout scenario:
If the vision reveal beats expectations, price could push into:
$0.05061 – Jan 29 bearish daily void, confluent with:
Jan 25 accumulation
Jan 27 distribution
CHZ

CHZ/USDT at a Critical Zone — Breakout or Another Rejection?CHZ/USDT on the Weekly (1W) timeframe remains in a long-term downtrend since its 2021 peak. Price is currently testing the upper boundary of a descending channel, an area that historically acts as a key decision zone—either leading to a strong rejection or a valid breakout. While short-term momentum shows signs of recovery, sellers still control the broader market structure.
---
Pattern & Technical Structure
Descending Channel (Bearish Continuation Pattern)
Price has been moving consistently within a downward-sloping channel defined by:
Upper resistance (red trendline) → dynamic resistance
Lower support (yellow trendline) → major dynamic support
As long as price remains inside the channel, the primary trend stays bearish
Current price action at the upper channel makes this a high-risk, high-impact decision area
---
Key Levels
Major Resistance:
0.07500 → minor resistance / initial reaction zone
0.14000 – 0.16600 → mid-term supply zone
0.27500 → major resistance & trend reversal confirmation
Major Support:
0.05400 → short-term support
0.03500 → important weekly support
0.01000 → extreme demand zone / lower channel boundary
---
Bullish Scenario
Price breaks above and closes weekly above the descending channel
Breakout supported by increasing volume
Upside targets:
0.07500
0.14000 – 0.16600
0.27500 as the main target
A valid breakout could mark the end of the bearish structure and the start of a medium-term trend reversal
Bullish Confirmation:
Weekly close above the red resistance trendline
Successful retest of the upper channel as support
---
Bearish Scenario
Price fails to break the upper channel and forms a clear rejection (long wicks or bearish weekly candle)
Selling pressure resumes
Downside targets:
0.03500
0.01000 (lower channel)
As long as price stays inside the channel, upside moves are considered relief rallies
Bearish Confirmation:
Strong rejection at dynamic resistance
Breakdown below the 0.05400 support level
---
Conclusion
CHZ/USDT is trading at a critical long-term decision zone on the Weekly timeframe.
This area will likely determine whether price:
Breaks out → Trend reversal
Gets rejected → Continuation of the downtrend
Traders are advised to wait for weekly confirmation, as this zone is highly prone to fake breakouts.
#CHZ #CHZUSDT #Altcoin #CryptoAnalysis #TechnicalAnalysis #WeeklyChart #DescendingChannel #TrendReversal #CryptoTrading

$CHZ - IdeaLonged GETTEX:CHZ here. Looking for a scam pump at the weekend. Market remains weak so I'm only trying this idea with small amount.

CHZ will go to the moon (4H)First of all, you should know that we analyzed Chiliz in the most desperate market situation in this post and had a bullish view on it.
From the point where the green arrow is placed on the chart, the bearish phase of CHZ has officially ended, and the market has entered a new bullish phase.
This bullish structure appears to be forming a Diametric pattern, and at the moment, price action seems to be located near the end of wave E. Based on the current structure and market behavior, it is highly likely that wave E will complete soon, after which the price will move into wave F.
Wave F is expected to be a corrective / bearish wave, but it should be considered a pullback within a larger bullish trend, not a trend reversal. Therefore, the completion of wave F is where we will be actively looking for long (buy) opportunities, as it aligns with the newly established bullish phase.
Entry Strategy
We have identified two potential entry zones, and the recommended approach is to enter the position using DCA (Dollar-Cost Averaging). This allows for better risk management and improved average entry price during the corrective move.
Targets & Risk Management
Price targets are clearly marked on the chart
At Target 1, it is recommended to secure partial profits
After taking partial profit, move the stop-loss to breakeven to eliminate risk on the remaining position
Invalidation
This analysis will be invalidated if a daily candle closes below the invalidation level marked on the chart. A confirmed daily close below this level would indicate that the structure has failed and the bullish scenario is no longer valid.
As always, proper risk management is essential, and this analysis should be used as part of a broader trading plan, not as financial advice.
If you have a coin or altcoin you want analyzed, first hit the like button and then comment its name so I can review it for you.
This is not a trade setup, as it has no precise stop-loss, stop, or target. I do not publish my trade setups here.

$CHZ Position UpdateChiliz Position Update 🔥
The Setup (August/September)
Back in late summer, we identified CHZ as a high-probability setup and shared it with the crew. The technical structure was clean, the risk-to-reward was favorable, and the timing aligned with our broader market outlook.
Where We Are Now
The crew is banking.
Those who followed the call and managed their positions properly are now sitting in solid profits as CHZ has made significant upside movement. This is exactly what patience and proper position management looks like in action.
Current Outlook
We're riding this higher into the $1 area.
The structure remains intact, and we're targeting the $1 zone as our next major level of interest. This doesn't mean we're blindly holding it means we have a clear plan, defined levels, and we're managing risk as price develops.
Key Reminders for the Crew
Lock in Profits Along the Way
If you haven't already, consider taking partial profits at key resistance levels
Secure your initial risk so you're playing with house money
Respect Your Plan
Know your exit levels in advance
Don't get emotional as we approach $1
Trail Your Stops
As price moves higher, your stop should move with it
Protect your gains don't give back all your profits
Stay Disciplined
We called this in August/September for a reason
Trust the process that got you into profits
The Bigger Picture
This position is a perfect example of why we focus on quality setups over quantity. We identified the opportunity months ago, shared it with the crew, and now we're managing it professionally as it develops.
The target is $1, but we're managing this actively. Market conditions can change, structure can break, and we adjust accordingly. Stay alert, stay disciplined, and let's see this through to the target zone.
Remember: Positions called months ago that are banking now show the power of patience and proper analysis. Keep managing your risk, and let's ride this to $1. 🎯
This update is for educational and informational purposes for our community. All trading involves risk. Manage your positions according to your own risk tolerance and trading plan.

CHZ long-term TAChiliz continues building up strong uptrend and it's currently giving the first signs for the possible long-term uptrend, accumulation is positive with somewhat heavy volumes spotted on weekly time frame. The first resistance target could be around $0.07 area.

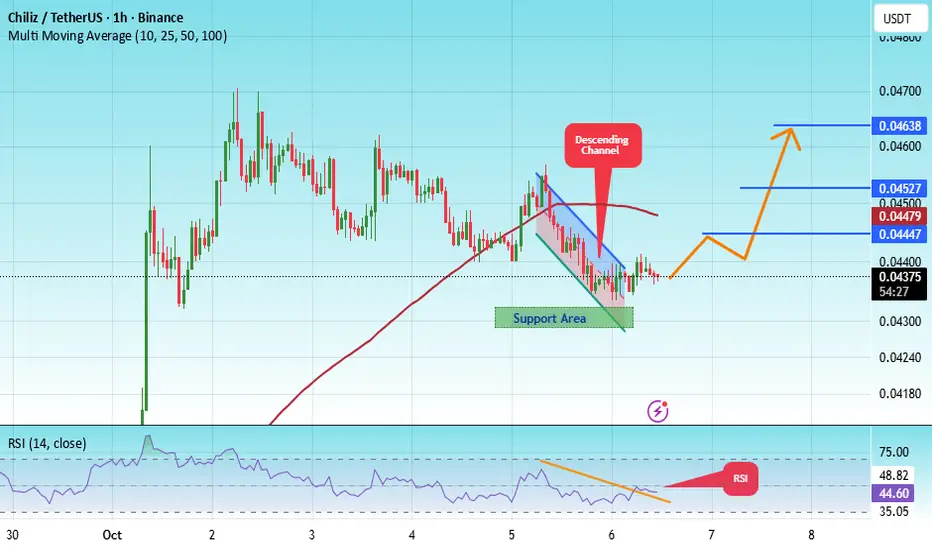
#CHZ/USDT Reversal Potential Breakout & Fibonacci Retest in F#CHZ
The price is moving within a descending channel on the 1-hour frame, adhering well to it, and is heading for a strong breakout and retest.
We have a bearish trend on the RSI indicator that is about to be broken and retested, which supports the upward breakout.
There is a major support area in green at 0.04300, which represents a strong support point.
We are heading for consolidation above the 100 moving average.
Entry price: 0.04368
First target: 0.04447
Second target: 0.04527
Third target: 0.04638
Don't forget a simple matter: capital management.
When you reach the first target, save some money and then change your stop-loss order to an entry order.
For inquiries, please leave a comment.
Thank you.
Chiliz CHZ price analysis🎆 Is someone launching a New Year firework on the OKX:CHZUSDT chart?
Over the past 3 months, CRYPTOCAP:CHZ has shown much stronger price stability than most altcoins.
While the broader market struggles, #Chiliz keeps holding its ground — and that already says a lot.
📍 Right now, price is pressing against a key decision zone around $0.45.
This level may define the next major move.
📈 A clean breakout above $0.45 could open the way toward the trend resistance at $0.60–0.62.
🎄 So if markets get quiet during the New Year holidays — CRYPTOCAP:CHZ might be worth watching closely.
🤔 Is this just a short-term hype move, or are buyers quietly preparing a bigger push?
______________
◆ Follow us ❤️ for daily crypto insights & updates!
🚀 Don’t miss out on important market moves
🧠 DYOR | This is not financial advice, just thinking out loud

CHZ Is Going To The Moon (3D)This analysis is an update to the previous one, which you can find in the Related publications section.
Before anything, pay attention to the time frame.
We have been tracking this coin for months, and the structure remains the same. With the Trump news and the market crash, it formed a long shadow candle, but this hasn’t changed spot trading.
This symmetrical pattern has no choice but to complete, and CHZ can easily reach the red box though it may take a few months of patience.
This position is only for spot trading, and you can buy from the current price down to the bottom of the green box.
For risk management, please don't forget stop loss and capital management
When we reach the first target, save some profit and then change the stop to entry
Comment if you have any questions
Thank You

CHZ mid-term TAChiliz can be an outperformer on crypto market in the upcoming weeks or months, as of now the volumes on CHZ have accelerated and there's a positive accumulation on weekly time frame as well, it's yet in the early stage of bullish formation but it's something to keep an eye on.
Recently they have announced a partnership with Assetera and that could be a price pusher.

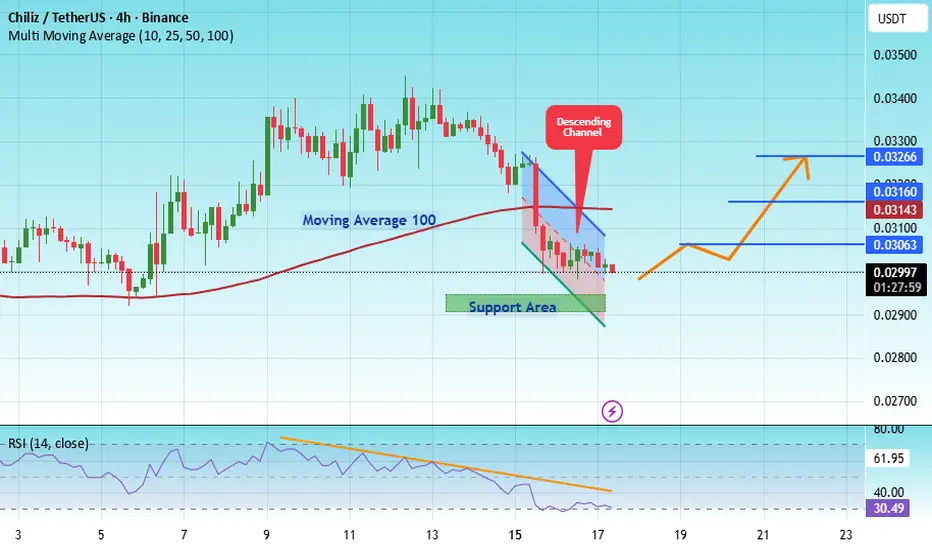
#CHZ/USDT Reversal Potential Breakout & Fibonacci Retes#CHZ
The price is moving in a descending channel on the 1-hour timeframe. It has reached the lower boundary and is heading towards breaking above it, with a retest of the upper boundary expected.
We have a downtrend on the RSI indicator, which has reached near the lower boundary, and an upward rebound is expected.
There is a key support zone in green at 0.02934. The price has bounced from this level multiple times and is expected to bounce again.
We have a trend towards consolidation above the 100-period moving average, as we are moving close to it, which supports the upward movement.
Entry price: 0.03000
First target: 0.03063
Second target: 0.03160
Third target: 0.03266
Don't forget a simple principle: money management.
Place your stop-loss order below the support zone in green.
For any questions, please leave a comment.
Thank you.
CHZ Looks Bullihs (2H)It appears that an ABC pattern has formed on the chart, with wave B being a completed diametric pattern. We are now only looking for an entry opportunity for a buy/long position, with the low-risk zone highlighted in green on the chart.
The targets are also marked on the chart.
A 4-hour candle closing below the invalidation level will invalidate this analysis.
For risk management, please don't forget stop loss and capital management
When we reach the first target, save some profit and then change the stop to entry
Comment if you have any questions
Thank You

CHZ/USDT ; BUY MARKET!!!Hello friends
Given the good growth we had, the price has entered a correction phase and is in the specified support area that I determined, the price is supported and if the price continues to be supported, we can see the specified targets.
*Trade safely with us*

Chiliz $CHZ ! IMPORTANT! Chiliz ( GETTEX:CHZ ) Technical Analysis: Bullish Scenario and Key Levels
Chiliz ( GETTEX:CHZ ) trades at approximately $0.0394 USDT, with a market cap around $360 million and 24-hour volume over $50 million. The token is down 1.4% in the last 24 hours but up 10% over the past day amid broader market recovery, though it's declined 15% monthly and 25% year-to-date. GETTEX:CHZ remains in a multi-year downtrend from its 2021 ATH of $0.877, but recent breakouts from descending patterns signal potential reversal, especially with fan token ecosystem growth in sports and esports. Sentiment on X is increasingly bullish, citing pennant breakouts and trendline breaks, though some note resistance hurdles.
Fundamentals center on the Chiliz Chain for fan engagement tokens (e.g., Socios platform), with partnerships like FC Barcelona and UFC driving utility. High circulating supply (9.1 billion out of 8.8 billion total—post-burns) caps upside, but historical pumps (3,500% in 2021) highlight altseason potential if crypto rallies post-rate cuts.
#### Overall Chart Structure and Technical Setup
On daily/weekly charts (CHZ/USDT), GETTEX:CHZ has broken a downward trendline from summer highs, ending the corrective phase and forming a bullish pennant breakout. Volume is rising with bullish candles dominating near lows, suggesting accumulation. Indicators: RSI (14) at 45-50 (neutral, poised for bullish cross), MACD showing early divergence, and EMAs aligning bullishly above 50/100-day. Weekly reversal candle supports ending the 1,000+ day bear cycle.
#### Bullish Scenario
A hold above key support could spark a multi-wave rally on altcoin momentum or platform news (e.g., new fan tokens). Outlook:
1. **Short-Term Breakout (1-4 Weeks):** Consolidate at $0.038-$0.040, break $0.045 (EMA200) for 15-25% gains to $0.046-$0.048. Confirm with RSI >60 and volume spike.
2. **Medium-Term Rally (1-3 Months):** Clear $0.05 (major resistance) accelerates to $0.06-$0.08, a 50-100% move, mirroring 2021 patterns.
3. **Long-Term Bullish Wave (2025 Outlook):** Break $0.10 confirms full reversal, targeting $0.106 (conservative) or $0.63 in altseason—up 1,500%+. Optimistic end-2025 forecasts hit $0.042-$0.10, with risks from macro dips.
#### Key Levels to Watch
- **Support Levels:**
- Immediate: $0.0376 (24h low) – Key hold for invalidation.
- Major: $0.038-$0.040 – Demand zone; break risks $0.03 retest.
- **Resistance Levels:**
- Near-Term: $0.045 – EMA cluster; breakout ignites pump.
- Intermediate: $0.05 – Psychological/former support; clear for $0.06.
- Long-Term: $0.10 – Bull resumption trigger.
#### Risks and Considerations
Bullish if support holds, but high-risk from low liquidity and market volatility. Watch volume >20% average and news. Tight stops below support; scale on dips. Not financial advice—DYOR and manage risk.

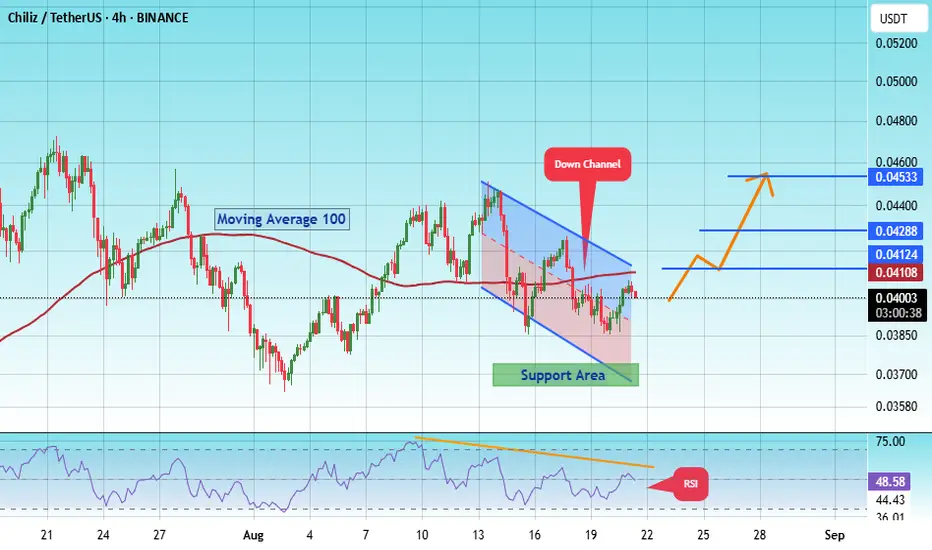
#CHZ/USDT Reversal Potential Breakout & Fibonacci Retest in Fo#CHZ
The price is moving within a descending channel on the 1-hour frame, adhering well to it, and is heading for a strong breakout and retest.
We have a bearish trend on the RSI indicator that is about to be broken and retested, supporting the upside.
There is a major support area (in green) at 0.03700, which represents a strong basis for the upside.
For inquiries, please leave a comment.
We are in a consolidation trend above the 100 moving average.
Entry price: 0.4000
First target: 0.04108
Second target: 0.04288
Third target: 0.04533
Don't forget a simple matter: capital management.
When you reach the first target, save some money and then change your stop-loss order to an entry order.
For inquiries, please leave a comment.
Thank you.
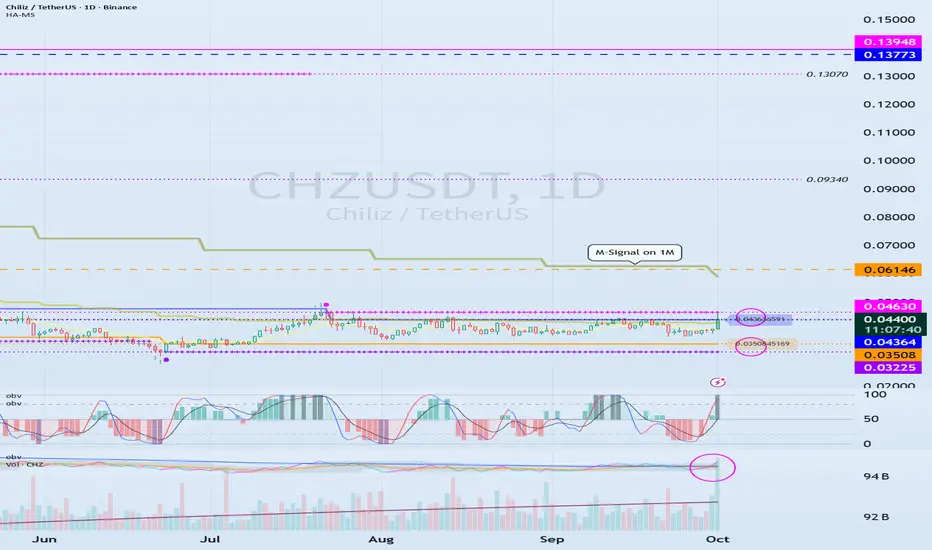
See if we can break above 0.04364-0.04630
Hello, fellow traders!
Follow us to get the latest updates quickly.
Have a great day!
-------------------------------------
(CHZUSDT 1D chart)
The OBV indicator is showing an upward break above the EMA 2 indicator.
If the price rises above the 0.04364-0.04630 range, it is expected to continue its upward trend.
However, since the price is below the M-Signal indicator on the 1M chart, a quick and quick response is required when trading.
Therefore, if possible, it is recommended to confirm that the price rises above the M-Signal indicator on the 1M chart, providing support, before trading.
-
(1M chart)
If the price rises above the M-Signal indicator on the 1M chart, it is highly likely that the price will attempt to rise to around 0.20790.
------------------------------------------
Considering the above, for medium- to long-term investment, it is recommended to buy when the price rises above the 0.04364-0.04630 range, providing support.
If you're looking to make a short-term investment, it's best to buy when the price rises above the M-Signal indicator on the 1M chart and shows signs of support.
Buying at a low price doesn't always lead to profits.
This is because some investors may not be able to wait for the price to rise and may give up midway.
Therefore, you should calmly consider your investment horizon for the altcoin you're currently considering.
Your investment size and trading strategy will vary depending on your investment horizon.
-
Thank you for reading to the end.
I wish you successful trading.
--------------------------------------------------
CHZ/USDT ; BUY ...Hello friends
Well, you can see that after a good rise, the price has formed a flag, and if this flag breaks, we can expect growth to the specified limits.
*Trade safely with us*

CHZ : BUY OR SELL? Hello friends
According to the price drop, you can see that the price is in the support area specified by the buyers. The specified support is also specified with Fibonacci, which is from our own strategy.
Now, if the support is held and the specified resistance is broken, the price can move to the specified targets. Don't forget risk and capital management.
*Trade safely with us*
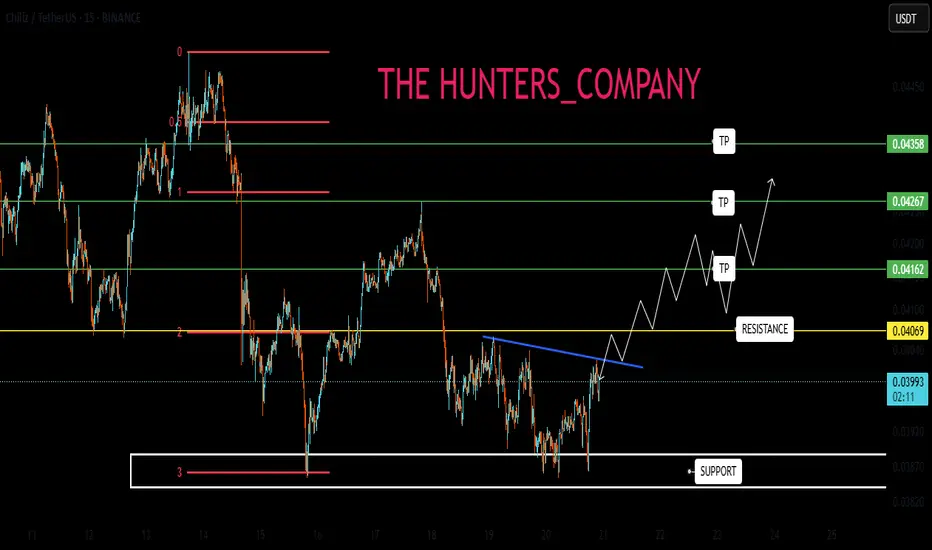
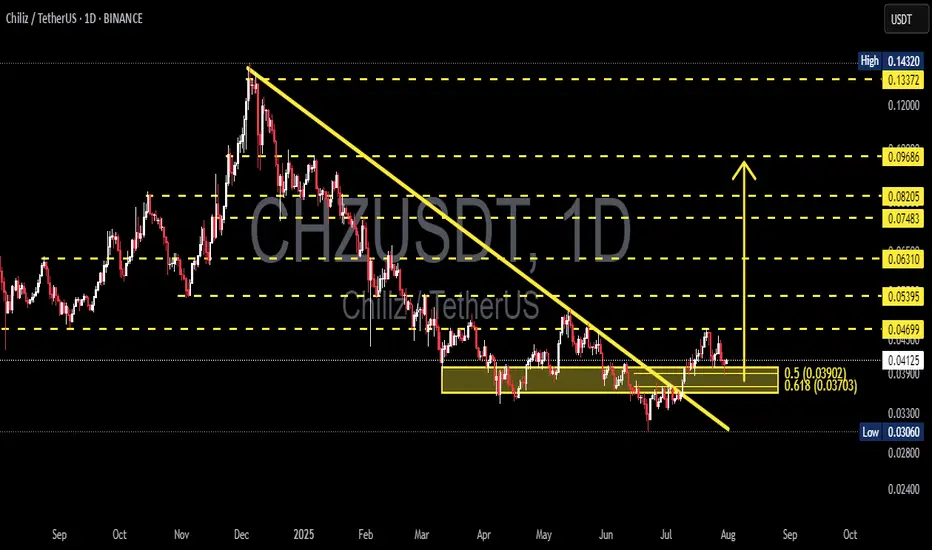
CHZUSDT Reversal Potential Breakout & Fibonacci Retest in FocusChart Analysis:
The CHZ/USDT pair on the 1D timeframe has successfully broken out of a long-term descending trendline, which had been acting as resistance since December 2024. The breakout occurred with a strong bullish candle, suggesting a potential trend reversal.
Currently, the price is performing a retest of the breakout zone, which aligns perfectly with the Fibonacci retracement levels:
0.5 at $0.03902
0.618 at $0.03703
This confluence zone is critical as it may serve as a base for a continued bullish move.
---
Pattern Identified:
Descending Triangle Breakout → Signaling the end of a distribution phase and the potential start of accumulation.
Bullish Retest Zone → Price is testing the previous resistance turned support + Fibonacci confluence.
---
Bullish Scenario:
✅ If price holds above the $0.037–$0.039 support area and forms a bullish rejection candle, potential upside targets include:
$0.04699 (minor resistance)
$0.05395
$0.06310
$0.07483
Up to psychological resistance at $0.09686
---
Bearish Scenario:
❌ If price breaks below the $0.03703 level, further downside could be seen toward:
$0.03306 (local support)
And possibly the recent low at $0.03060
However, as long as the price stays above the 0.618 Fibonacci, the bias remains bullish.
---
Conclusion:
CHZ/USDT is at a critical decision point. A successful retest of the breakout zone combined with Fibonacci support could provide a strong accumulation opportunity for buyers. Watch closely for bullish confirmation candles in the yellow zone before entering.
#CHZ #CHZUSDT #CryptoBreakout #FibonacciLevels #TechnicalAnalysis #AltcoinWatch #TrendReversal #CryptoTrading #TradingViewAnalysis
Chiliz Hitz Bottom · Opportunity Buy Zone (PP: 3,535%)Chiliz is trading at a true bottom right now after producing the lowest price in more than three years. The lowest since February 2021. No need to worry though, an early recovery is already happening and we are sure the bottom is in.
The past three weeks have been green while CHZUSDT managed to close above EMA8. This means that the trend is changing or is about to change and we know it will change because we are right in front of the 2025 altcoins bull market. Chiliz will not stay behind, it will also grow. We don't know how strong but there is plenty of room for rising prices. You will be surprised by what the market does.
What the market does is to condition you in some way. First, you become conditioned to seeing higher prices, unlimited potential and that's the start of the bear market, long-term a downturn. But this isn't the end.
When you are conditioned to seeing the market go down, more down; down, down, down, forever more, then it changes suddenly, as if by surprise and prices start to grow. The growth feels strange because it is something not seen in a while and we wonder, will it last? I don't know.
That's the first answer if you don't have access to years of data and this amazing chart.
Seeing the chart long-term coupled with marketwide action and what Bitcoin does, yes, the market growth will last a long time because an uptrend means higher highs and higher lows.
Right now we are looking at the best possible entry prices, an opportunity buy-zone. Buying now can result in incredible gains in the coming months.
Thanks a lot for your continued support.
Namaste.

CHZ LIMIT FOR BUY(FREE)Hello friends
Due to the price drop, we can buy on the drop within the specified limits and move with it to the specified targets, of course with capital and risk management.
*Trade safely with us*

#CHZ Price is testing the Descending channel resistance #CHILIZ
The price is moving within a descending channel on the 1-hour frame and is expected to break and continue upward.
We have a trend to stabilize above the 100 moving average once again.
We have a downtrend on the RSI indicator that supports the upward break.
We have a support area at the lower boundary of the channel at 0.03320, acting as strong support from which the price can rebound.
We have a major support area in green that pushed the price upward at 0.03200.
Entry price: 0.03440
First target: 0.03505
Second target: 0.03600
Third target: 0.03730
To manage risk, don't forget stop loss and capital management.
When you reach the first target, save some profits and then change the stop order to an entry order.
For inquiries, please comment.
Thank you.

CHZUSDT 1D Analysis CHZ ~ 1D Analysis
#CHZ Buy back on retesting this support block with a short term target of at least 10%++ from here.
