CHZ - A pivot formation with great potential.The withdrawal of liquidity in the lower range of the trading range indicates the instrument's intention to show growth and go for the withdrawal of liquidity in the opposite side of the channel.
We look at the situation.
If you liked the idea, give it a like. That's the best "Thank you!" for the author 😊
P.S. Always do your own analysis before a trade. Put a stop loss. Fix profits in installments. Withdraw profits in fiat and make yourself and your loved ones happy.
CHZBTC

CHZ Update: M or Flag?So I made a Bullish analysis before showing that CHZ is drawing a Bullish Flag in a biger scale. Let's have a look a little bit closer.
So of course market can go either UP or DOWN (Genius). Direction doesn't matter, we should take our positions according to it. I showed two different path that CHZ can follow.
RED LINE:
Bearish scenario can be activated if the price drops below the support area that I have shown in the Graph. In that case "M" shape will activated so price can fall down to the lower trendline, which is a good point to buy some CHZ.
BLUE LINE:
Bullish scenario can be activated if the price breaks the ressitance area. Then, Bullish flag will be activated so we can see the price can move up first in the region 0.44-0.55$. Then, probably price will get rejected from that area. However, if it can exceeds that area than we can see upward movement up to 1$. Price will %90 rejected from this area because of the "rounding effect".
This is not a financial advice. This is just my trials.

CHZ Bullish FlagIf you look CHZ's weekly trend, the coin moves in a downward channel. If it can break this channel and go over the 1$, then we can expect that it can move up until 3-5-10$ since there is a "Bullish Flag" formation.
This is not a financial advise. It is just a guess.

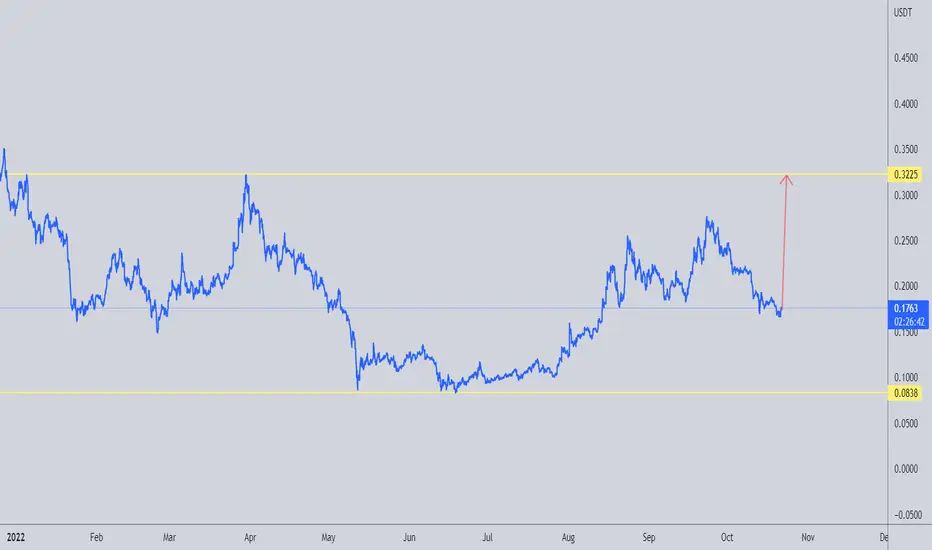
Entry level for CHZ!Here's a quick Look at the CHZ daily chart.
The best entry would be when the price breaks above 0.3$ with a good amount of volume!
-------------------------------------------
The idea is: Buy when the price breaks above 0.3$ and take profits at the levels shown in the chart.
Targets:
1. 0.31$
2. 0.33$
3. 0.35$
-------------------------------------------
What are triangles when it comes to trading?
Key points:
"1. In technical analysis , a triangle is a continuation pattern on a chart that forms a triangle-like shape.
2. Triangles are similar to wedges and pennants and can be either a continuation pattern if validated or a powerful reversal pattern, in the event of failure.
3. three potential triangle variations can develop as price action carves out a holding pattern, namely ascending, descending, and symmetrical triangles."
-------------------------------------------
If you like the content, then make sure to comment and like the post :D
Follow me for daily profitable trading setups
BTC dictates the market. If BTC falls, then Alts will fall as well. Trade safe!

CHZ/USDT - LONG -- Support me with numbers and follow up on my account for other deals in the future. Thank you for coming to this part.
---------------------------------------------------------
⚡️⚡️ CHZ/USDT ⚡️⚡️
Exchange: ByBit USDT
Trade Type: Breakout (Long)
Leverage: Cross (5.0X)
Entry Orders:
1) 0.24485 - 100.0%
Take-Profit Orders:
1) 0.25850 - 60.317%
2) 0.26915 - 24.855%
3) 0.28580 - 9.826%
Stop-loss Orders:
1) 0.21940 - 100.0%
Trailing Configuration:
Stop: Breakeven -
Trigger: Target (1)

CHZusdt 3D breaking TrendLine UpdateAccording to the chart, the upward trend line has been broken and we expect the price to rise to the specified resistance areas. We are waiting for a successful pullback.
Its not Buy or Sell SIGNAL
DYOR
BY : M.TeriZ - @AtonicShark

CHZ grew by more than 15% yesterday and 7% today!CHZ grew by more than 15% yesterday and 7% today. After the price entered the corrective wave, we saw a positive reaction to the support levels of the floor of the medium-term bullish channel. After the pullback to the support range, this good rally occurred before the Bitcoin price declined. The resistance range of $0.236 to $0.270 is very important in continuing its mid-term and long-term trend because it is considered an important resistance in the daily time frame. Because if this area is broken, the price can even leave its long-term downward channel. For the short term, until the bottom of the ascending channel is broken and the market conditions remain favorable, we can expect more price growth from this currency.

CHZNot financial advice. The essence of investing & trading is the intelligent and patient preying on the greed, fear, impatience, addiction and ignorance of the majority. It's definitionally Darwinian.

CHZ - Cryptocurrency for sports fans.After the false breakout of the upper boundary of the trading range, we observe a structural return of the price inside the channel with a further test of the buyer.
If the buyer fails to hold and push the price out of these price levels, a price decline is expected.
If you liked the idea, please like it. That's the best "Thank you!" for the author 😊
P.S. Always do your own analysis before a trade. Put a stop loss. Fix profits in installments. Withdraw profits in fiat and make yourself and your loved ones happy.

CHZusdt 3D Triangle patternBy checking the chart, we can see the triangle pattern, if the price supports the upward trend line, it will be broken, otherwise we expect correction.
Its not Buy or Sell SIGNAL
DYOR
BY : M.TeriZ - @AtonicShark

CHZ ANALYSISCHZ is current broken out of the symmetrical triangle and we can expect a breakdown of 22.78% which takes chz to previous support level at the green box area.Therefore,we might expect new leg after chz test this green box area any long position is risky as we have green box as the next support level for CHZ.

CHZ SHORT CONFLUENCEI would like to give for confluence an extra picture about CHZ/BTC to my last posted CHZ/USD pair
The BTC pair reached a top of the 4H CHANNEL, and backtested the Golden Pocket, so I would like to see some down move.


CHZUSDT MID TERM LONG TRADEChz forming beautiful cup and handle formation on weekly chart which is bullish continuation pattern. Enter at breakout tp is mentioned in chart.
Note: trade at your own risk

CHZ/BTC TRADE SETUP! A NEW ATH INCOMING!!Hello everyone, if you like the idea, do not forget to support with a like and follow.
Welcome to this CHZ/BTC trade setup.
CHZ looks very bullish in the daily time frame. It is breaking out from the bull flag like structure in the daily time frame. Expecting a 150% pump from here. Buy some here and add more in the dip.
Entry range:- 1000-1100 sats
Target:- 100-150%
SL:- 900 sats
CHZ is a Fan token and world cup is coming in the month on Nov. so we might see some good rally in many fan tokens. Buying a decent bag of CHZ here and will add more in the dip.
If you like this idea then do support it with like and follow.
Also, share your views in the comment section.
Thank You!

CHZ/USDT :: Short good But Long Better CHZ/USDT :::
Sooner or later all the lines touch .
_ Create a position and enjoy it....

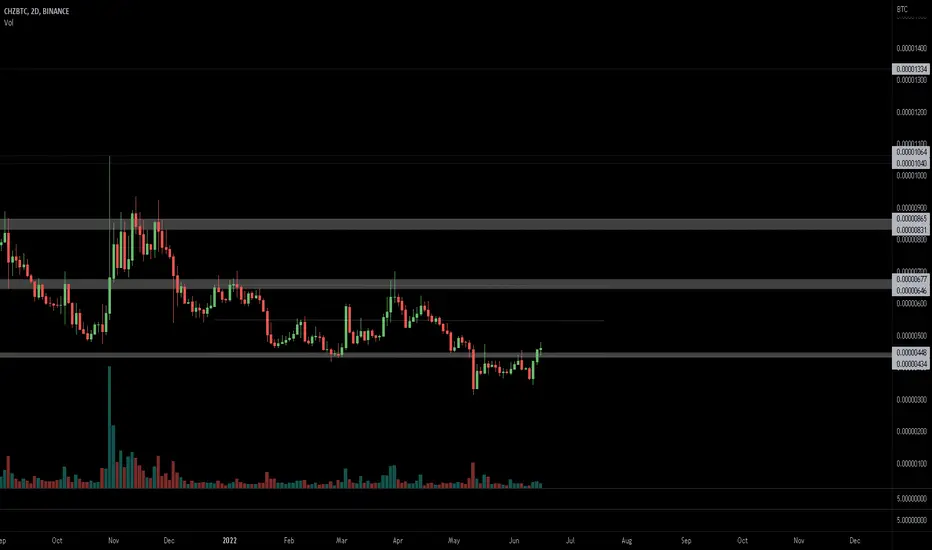
4H Bullflag on CHZBTCWell, it seems that VAH of the big range is holding and in 4h time frame, CHZBTC is forming a Bull flag. if this play out the next level of resistance would be the 0.78 retracement fib level which is in the confluence of the April 2021 High. from there one could look for an SFP of the high and trade this pair back towards the VAH of the Range. if it gets accepted back in the VA range one could look for POC of the range for the next level of Support. I am personally not trading this pair but I look at it for getting ideas on the USDT pair.

TRADE ALERT - CHZ SHORTEntry Target = .2466
Stop Loss = .2613
Final Target = .2026
Risk/Reward = 3/1
Leverage = 1x
Profit Potential = 18%


Chiliz (CHZ) - August 24Hello?
Welcome, traders.
If you "follow", you can always get new information quickly.
Please also click "Like".
Have a good day.
-------------------------------------
(CHZUSDT 1W Chart)
The 0.1858-0.2460 interval is the interval that determines the trend.
Therefore, if it rises above 0.2460, it is expected that it will lead to an upward movement to the next section, 0.4869-0.5471.
However, the key question is whether it can move higher than 0.3665.
(1D chart)
A break above the 0.2695, 0.3034 and 0.3319 points is required to move above 0.3665.
To do that, you need to make sure you can get support in the 0.2402-0.2640 zone or higher.
If not, you should be careful as the pull back pattern could lead to a drop near 0.2079.
The 0.1858-0.2460 section is a trend-determining section, so it is highly likely to lead to further upside if supported in this section.
However, as it is currently higher than 0.2460, if it falls below 0.2079, it is highly likely that it will lead to further declines, so be careful.
------------------------------------------------------------ -------------------------------------------
** All descriptions are for reference only and do not guarantee a profit or loss in investment.
** The MRHAB-T indicator, which is inactive on the chart, contains indicators that indicate support and resistance points.
** Background color of Long/Short-S indicator: RSI oversold and overbought sections
** Background color of CCI-C indicator: When the short-term CCI line is below -100 and above +100, oversold and overbought sections are displayed.
** The OBV indicator was re-created by applying a formula to the DepthHouse Trading indicator, an indicator disclosed by oh92. (Thanks for this.)
(Short-term Stop Loss can be said to be a point where profit and loss can be preserved or additional entry can be made through split trading. It is a short-term investment perspective.)
---------------------------------

#CHZ Flashing a 2D UCTS Buy (usually strong)#CHZ
Flashing a 2D UCTS Buy (usually strong)
Waiting for candle close as confirmation
CHZ to do it again :)Same action here for what happen last time before BTC dropping ..
Will It Happen Again with CHZ ? Let's See
