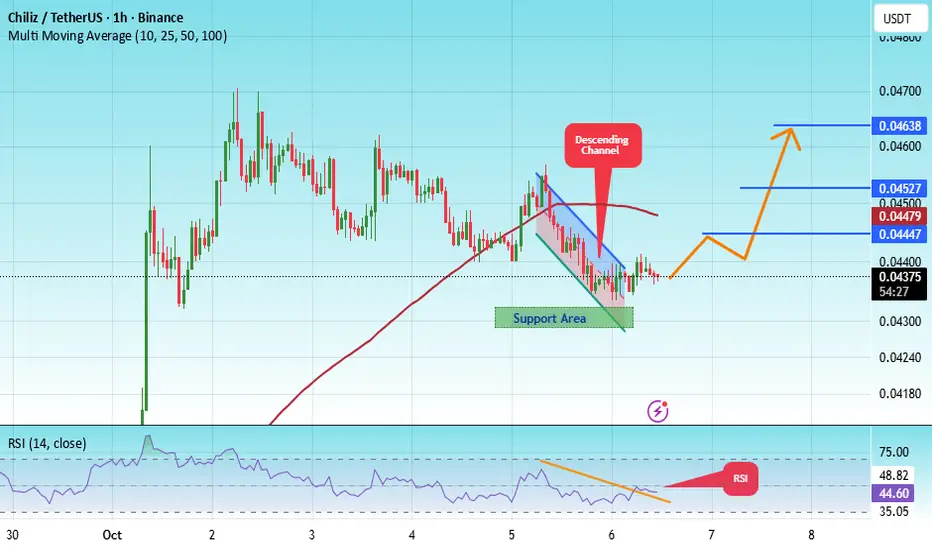
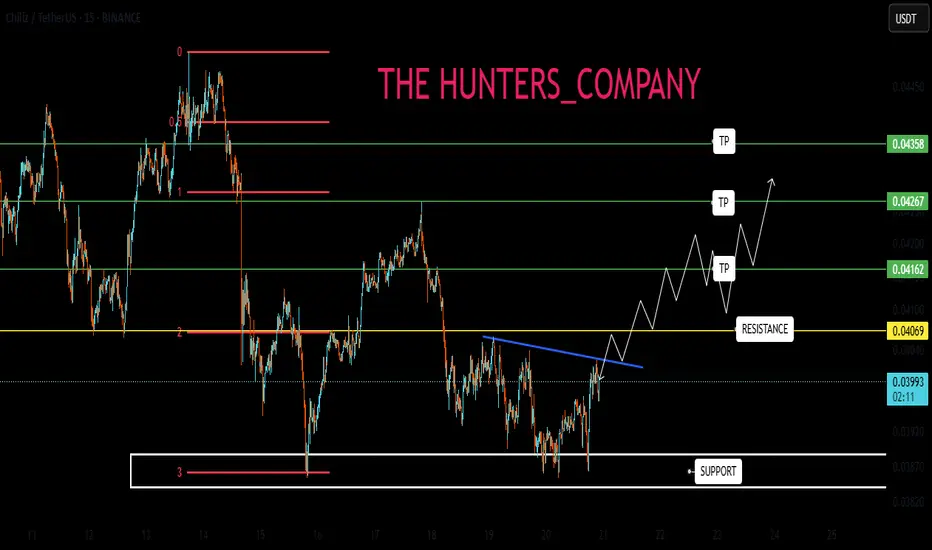
#CHZ/USDT Reversal Potential Breakout & Fibonacci Retest in F#CHZ
The price is moving within a descending channel on the 1-hour frame, adhering well to it, and is heading for a strong breakout and retest.
We have a bearish trend on the RSI indicator that is about to be broken and retested, which supports the upward breakout.
There is a major support area in green at 0.04300, which represents a strong support point.
We are heading for consolidation above the 100 moving average.
Entry price: 0.04368
First target: 0.04447
Second target: 0.04527
Third target: 0.04638
Don't forget a simple matter: capital management.
When you reach the first target, save some money and then change your stop-loss order to an entry order.
For inquiries, please leave a comment.
Thank you.
CHZUSD
Chiliz CHZ price analysis🎆 Is someone launching a New Year firework on the OKX:CHZUSDT chart?
Over the past 3 months, CRYPTOCAP:CHZ has shown much stronger price stability than most altcoins.
While the broader market struggles, #Chiliz keeps holding its ground — and that already says a lot.
📍 Right now, price is pressing against a key decision zone around $0.45.
This level may define the next major move.
📈 A clean breakout above $0.45 could open the way toward the trend resistance at $0.60–0.62.
🎄 So if markets get quiet during the New Year holidays — CRYPTOCAP:CHZ might be worth watching closely.
🤔 Is this just a short-term hype move, or are buyers quietly preparing a bigger push?
______________
◆ Follow us ❤️ for daily crypto insights & updates!
🚀 Don’t miss out on important market moves
🧠 DYOR | This is not financial advice, just thinking out loud

CHZ will be bullish in Q1 2026Hello Traders,
CHZ will be bullish in Q1 2026 due to the World Cup.
Will come back to this idea later.

CHZ Is Going To The Moon (3D)This analysis is an update to the previous one, which you can find in the Related publications section.
Before anything, pay attention to the time frame.
We have been tracking this coin for months, and the structure remains the same. With the Trump news and the market crash, it formed a long shadow candle, but this hasn’t changed spot trading.
This symmetrical pattern has no choice but to complete, and CHZ can easily reach the red box though it may take a few months of patience.
This position is only for spot trading, and you can buy from the current price down to the bottom of the green box.
For risk management, please don't forget stop loss and capital management
When we reach the first target, save some profit and then change the stop to entry
Comment if you have any questions
Thank You

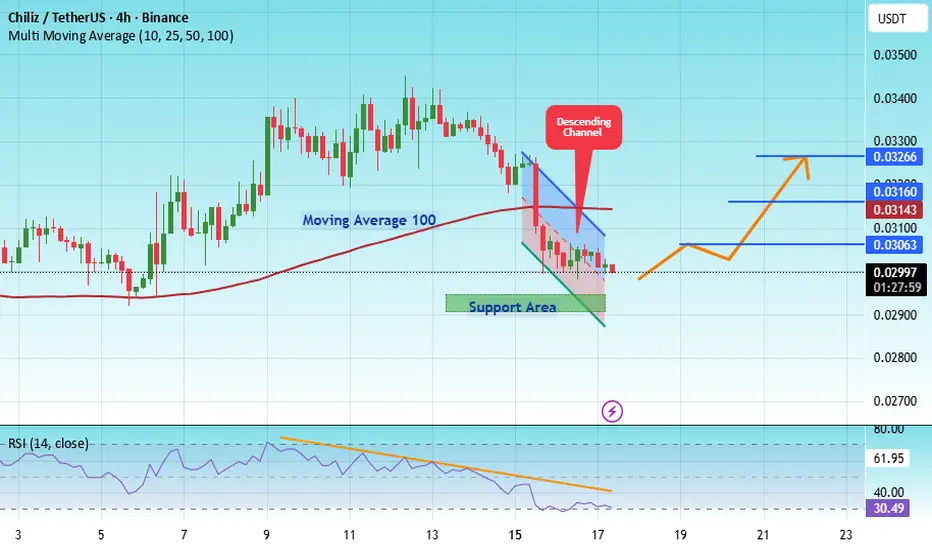
#CHZ/USDT Reversal Potential Breakout & Fibonacci Retes#CHZ
The price is moving in a descending channel on the 1-hour timeframe. It has reached the lower boundary and is heading towards breaking above it, with a retest of the upper boundary expected.
We have a downtrend on the RSI indicator, which has reached near the lower boundary, and an upward rebound is expected.
There is a key support zone in green at 0.02934. The price has bounced from this level multiple times and is expected to bounce again.
We have a trend towards consolidation above the 100-period moving average, as we are moving close to it, which supports the upward movement.
Entry price: 0.03000
First target: 0.03063
Second target: 0.03160
Third target: 0.03266
Don't forget a simple principle: money management.
Place your stop-loss order below the support zone in green.
For any questions, please leave a comment.
Thank you.
CHZ Looks Bullihs (2H)It appears that an ABC pattern has formed on the chart, with wave B being a completed diametric pattern. We are now only looking for an entry opportunity for a buy/long position, with the low-risk zone highlighted in green on the chart.
The targets are also marked on the chart.
A 4-hour candle closing below the invalidation level will invalidate this analysis.
For risk management, please don't forget stop loss and capital management
When we reach the first target, save some profit and then change the stop to entry
Comment if you have any questions
Thank You

CHZ/USDT ; BUY MARKET!!!Hello friends
Given the good growth we had, the price has entered a correction phase and is in the specified support area that I determined, the price is supported and if the price continues to be supported, we can see the specified targets.
*Trade safely with us*

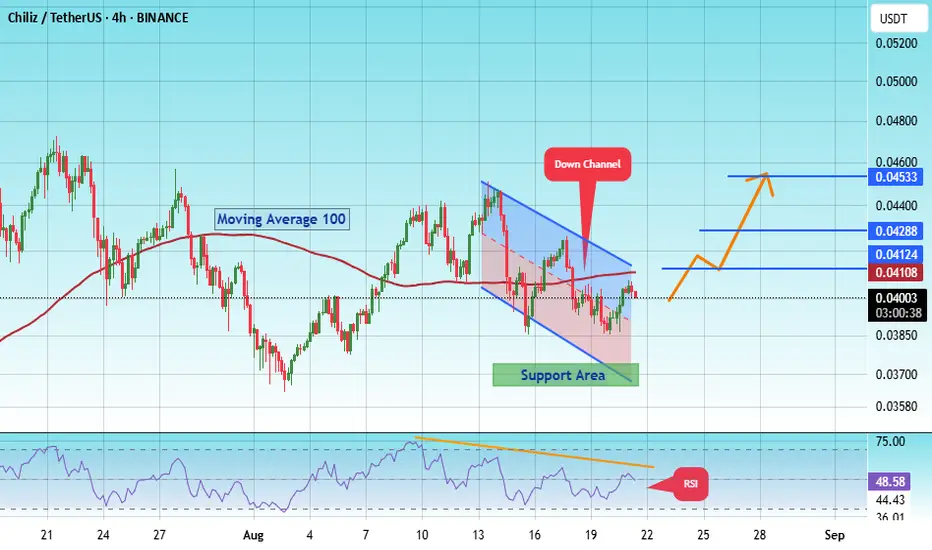
#CHZ/USDT Reversal Potential Breakout & Fibonacci Retest in Fo#CHZ
The price is moving within a descending channel on the 1-hour frame, adhering well to it, and is heading for a strong breakout and retest.
We have a bearish trend on the RSI indicator that is about to be broken and retested, supporting the upside.
There is a major support area (in green) at 0.03700, which represents a strong basis for the upside.
For inquiries, please leave a comment.
We are in a consolidation trend above the 100 moving average.
Entry price: 0.4000
First target: 0.04108
Second target: 0.04288
Third target: 0.04533
Don't forget a simple matter: capital management.
When you reach the first target, save some money and then change your stop-loss order to an entry order.
For inquiries, please leave a comment.
Thank you.
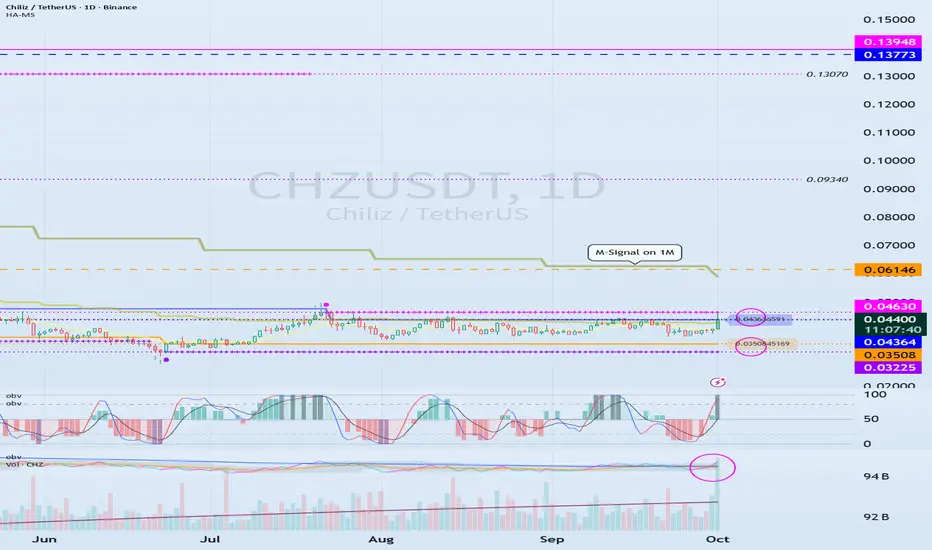
See if we can break above 0.04364-0.04630
Hello, fellow traders!
Follow us to get the latest updates quickly.
Have a great day!
-------------------------------------
(CHZUSDT 1D chart)
The OBV indicator is showing an upward break above the EMA 2 indicator.
If the price rises above the 0.04364-0.04630 range, it is expected to continue its upward trend.
However, since the price is below the M-Signal indicator on the 1M chart, a quick and quick response is required when trading.
Therefore, if possible, it is recommended to confirm that the price rises above the M-Signal indicator on the 1M chart, providing support, before trading.
-
(1M chart)
If the price rises above the M-Signal indicator on the 1M chart, it is highly likely that the price will attempt to rise to around 0.20790.
------------------------------------------
Considering the above, for medium- to long-term investment, it is recommended to buy when the price rises above the 0.04364-0.04630 range, providing support.
If you're looking to make a short-term investment, it's best to buy when the price rises above the M-Signal indicator on the 1M chart and shows signs of support.
Buying at a low price doesn't always lead to profits.
This is because some investors may not be able to wait for the price to rise and may give up midway.
Therefore, you should calmly consider your investment horizon for the altcoin you're currently considering.
Your investment size and trading strategy will vary depending on your investment horizon.
-
Thank you for reading to the end.
I wish you successful trading.
--------------------------------------------------
CHZ/USDT ; BUY ...Hello friends
Well, you can see that after a good rise, the price has formed a flag, and if this flag breaks, we can expect growth to the specified limits.
*Trade safely with us*

CHZ : BUY OR SELL? Hello friends
According to the price drop, you can see that the price is in the support area specified by the buyers. The specified support is also specified with Fibonacci, which is from our own strategy.
Now, if the support is held and the specified resistance is broken, the price can move to the specified targets. Don't forget risk and capital management.
*Trade safely with us*
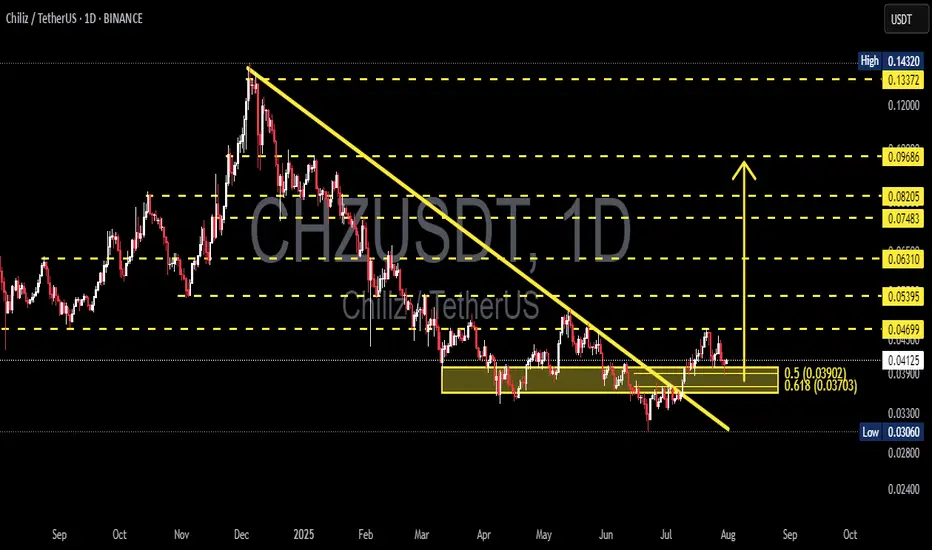
CHZUSDT Reversal Potential Breakout & Fibonacci Retest in FocusChart Analysis:
The CHZ/USDT pair on the 1D timeframe has successfully broken out of a long-term descending trendline, which had been acting as resistance since December 2024. The breakout occurred with a strong bullish candle, suggesting a potential trend reversal.
Currently, the price is performing a retest of the breakout zone, which aligns perfectly with the Fibonacci retracement levels:
0.5 at $0.03902
0.618 at $0.03703
This confluence zone is critical as it may serve as a base for a continued bullish move.
---
Pattern Identified:
Descending Triangle Breakout → Signaling the end of a distribution phase and the potential start of accumulation.
Bullish Retest Zone → Price is testing the previous resistance turned support + Fibonacci confluence.
---
Bullish Scenario:
✅ If price holds above the $0.037–$0.039 support area and forms a bullish rejection candle, potential upside targets include:
$0.04699 (minor resistance)
$0.05395
$0.06310
$0.07483
Up to psychological resistance at $0.09686
---
Bearish Scenario:
❌ If price breaks below the $0.03703 level, further downside could be seen toward:
$0.03306 (local support)
And possibly the recent low at $0.03060
However, as long as the price stays above the 0.618 Fibonacci, the bias remains bullish.
---
Conclusion:
CHZ/USDT is at a critical decision point. A successful retest of the breakout zone combined with Fibonacci support could provide a strong accumulation opportunity for buyers. Watch closely for bullish confirmation candles in the yellow zone before entering.
#CHZ #CHZUSDT #CryptoBreakout #FibonacciLevels #TechnicalAnalysis #AltcoinWatch #TrendReversal #CryptoTrading #TradingViewAnalysis
CHZ LIMIT FOR BUY(FREE)Hello friends
Due to the price drop, we can buy on the drop within the specified limits and move with it to the specified targets, of course with capital and risk management.
*Trade safely with us*

#CHZ Price is testing the Descending channel resistance #CHILIZ
The price is moving within a descending channel on the 1-hour frame and is expected to break and continue upward.
We have a trend to stabilize above the 100 moving average once again.
We have a downtrend on the RSI indicator that supports the upward break.
We have a support area at the lower boundary of the channel at 0.03320, acting as strong support from which the price can rebound.
We have a major support area in green that pushed the price upward at 0.03200.
Entry price: 0.03440
First target: 0.03505
Second target: 0.03600
Third target: 0.03730
To manage risk, don't forget stop loss and capital management.
When you reach the first target, save some profits and then change the stop order to an entry order.
For inquiries, please comment.
Thank you.

CHZUSDT 1D Analysis CHZ ~ 1D Analysis
#CHZ Buy back on retesting this support block with a short term target of at least 10%++ from here.

#CHZ/USDT#CHZ
The price is moving within a descending channel on the 1-hour frame and is expected to break and continue upward.
We have a trend to stabilize above the 100 moving average once again.
We have a downtrend on the RSI indicator that supports the upward move with a breakout.
We have a support area at the lower boundary of the channel at 0.04400, which acts as strong support from which the price can rebound.
Entry price: 0.04516.
First target: 0.04650.
Second target: 0.04820.
Third target: 0.05011.

#CHZ/USDT#CHZ
The price is moving within a descending channel on the 1-hour frame, adhering well to it, and is on its way to breaking it strongly upwards and retesting it.
We are seeing a bounce from the lower boundary of the descending channel, which is support at 0.03470.
We have a downtrend on the RSI indicator that is about to break and retest, supporting the upward trend.
We are looking for stability above the 100 moving average.
Entry price: 0.3570
First target: 0.03643
Second target: 0.03736
Third target: 0.03888

Chiliz and FIFA mentioned at Trump Crypto Reserve SummitWow what a surprise, we saw the FIFA World Cup Trophy at the summit;
Gianni Infantino presented it.
With such a good connection to the President and lots of football clubs and players onto the Chiliz Chain i assume we can get a decent surge over the next months.
Watch the Fibonacci's numbers.
A runup to around 14 Cents will spark the craze!

CHZ BUY LIMIThello friends
According to the drop we had, a good opportunity has been provided for buyers.
Now we can buy in steps, of course, with capital management.
We have specified the goals for you...
Trade safely with us

CHZ Mid TermChiliz (CHZ/USDT) Summary Analysis
•Support Zone: $0.0430 - $0.0610 USDT (strong demand area).
•Resistance Levels: $0.0704 → $0.0878 → $0.1111 → $0.1412 USDT.
•Trend: After a downtrend, there is a potential for recovery from support.
Scenarios:
✅ Bullish: If CHZ holds above $0.0610 USDT, the first target is $0.0704 USDT, followed by $0.0878 and $0.1111 USDT.
❌ Bearish: If CHZ falls below $0.0610 USDT, a drop to $0.0430 USDT is possible.
🔄 Neutral: Price may consolidate between $0.0610 - $0.0704 USDT.
Strategy:
🔹 Entry: Buy within the $0.0611 - $0.0500 USDT range, with a stop loss below $0.0430 USDT.
🔹 Sell: A close below $0.0610 USDT may accelerate the downtrend.
📊 Conclusion: The $0.0610 USDT level is critical—if CHZ holds above it, a rally could follow. 🚀

CHZUSDT 1WCHZ ~ 1W Analysis
#CHZ As long as this support is still maintained, there is still hope for the next increase. Target of at least 15%+ from here.

Good area to shop...hello friends
Considering that the price is in a triangle, now by reaching an important support range, it is expected that the price will break the resistance in front of it to move to the specified targets.
*Trade safely with us*

chz buy midterm"🌟 Welcome to Golden Candle! 🌟
We're a team of 📈 passionate traders 📉 who love sharing our 🔍 technical analysis insights 🔎 with the TradingView community. 🌎
Our goal is to provide 💡 valuable perspectives 💡 on market trends and patterns, but 🚫 please note that our analyses are not intended as buy or sell recommendations. 🚫
Instead, they reflect our own 💭 personal attitudes and thoughts. 💭
Follow along and 📚 learn 📚 from our analyses! 📊💡"
