CHZ/USDT at a Critical Zone — Breakout or Another Rejection?CHZ/USDT on the Weekly (1W) timeframe remains in a long-term downtrend since its 2021 peak. Price is currently testing the upper boundary of a descending channel, an area that historically acts as a key decision zone—either leading to a strong rejection or a valid breakout. While short-term momentum shows signs of recovery, sellers still control the broader market structure.
---
Pattern & Technical Structure
Descending Channel (Bearish Continuation Pattern)
Price has been moving consistently within a downward-sloping channel defined by:
Upper resistance (red trendline) → dynamic resistance
Lower support (yellow trendline) → major dynamic support
As long as price remains inside the channel, the primary trend stays bearish
Current price action at the upper channel makes this a high-risk, high-impact decision area
---
Key Levels
Major Resistance:
0.07500 → minor resistance / initial reaction zone
0.14000 – 0.16600 → mid-term supply zone
0.27500 → major resistance & trend reversal confirmation
Major Support:
0.05400 → short-term support
0.03500 → important weekly support
0.01000 → extreme demand zone / lower channel boundary
---
Bullish Scenario
Price breaks above and closes weekly above the descending channel
Breakout supported by increasing volume
Upside targets:
0.07500
0.14000 – 0.16600
0.27500 as the main target
A valid breakout could mark the end of the bearish structure and the start of a medium-term trend reversal
Bullish Confirmation:
Weekly close above the red resistance trendline
Successful retest of the upper channel as support
---
Bearish Scenario
Price fails to break the upper channel and forms a clear rejection (long wicks or bearish weekly candle)
Selling pressure resumes
Downside targets:
0.03500
0.01000 (lower channel)
As long as price stays inside the channel, upside moves are considered relief rallies
Bearish Confirmation:
Strong rejection at dynamic resistance
Breakdown below the 0.05400 support level
---
Conclusion
CHZ/USDT is trading at a critical long-term decision zone on the Weekly timeframe.
This area will likely determine whether price:
Breaks out → Trend reversal
Gets rejected → Continuation of the downtrend
Traders are advised to wait for weekly confirmation, as this zone is highly prone to fake breakouts.
#CHZ #CHZUSDT #Altcoin #CryptoAnalysis #TechnicalAnalysis #WeeklyChart #DescendingChannel #TrendReversal #CryptoTrading
Chzusdtanalysis

Chiliz CHZ price analysis🎆 Is someone launching a New Year firework on the OKX:CHZUSDT chart?
Over the past 3 months, CRYPTOCAP:CHZ has shown much stronger price stability than most altcoins.
While the broader market struggles, #Chiliz keeps holding its ground — and that already says a lot.
📍 Right now, price is pressing against a key decision zone around $0.45.
This level may define the next major move.
📈 A clean breakout above $0.45 could open the way toward the trend resistance at $0.60–0.62.
🎄 So if markets get quiet during the New Year holidays — CRYPTOCAP:CHZ might be worth watching closely.
🤔 Is this just a short-term hype move, or are buyers quietly preparing a bigger push?
______________
◆ Follow us ❤️ for daily crypto insights & updates!
🚀 Don’t miss out on important market moves
🧠 DYOR | This is not financial advice, just thinking out loud

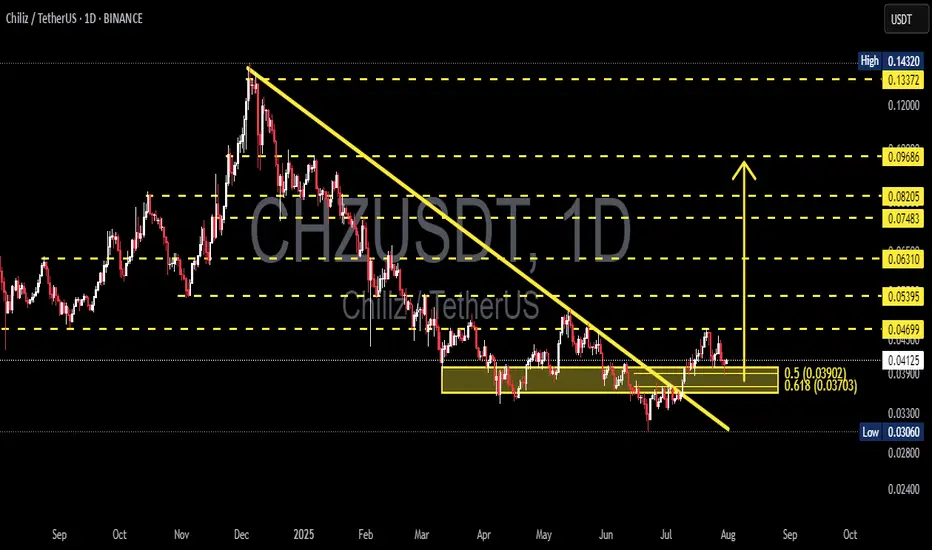
CHZUSDT Reversal Potential Breakout & Fibonacci Retest in FocusChart Analysis:
The CHZ/USDT pair on the 1D timeframe has successfully broken out of a long-term descending trendline, which had been acting as resistance since December 2024. The breakout occurred with a strong bullish candle, suggesting a potential trend reversal.
Currently, the price is performing a retest of the breakout zone, which aligns perfectly with the Fibonacci retracement levels:
0.5 at $0.03902
0.618 at $0.03703
This confluence zone is critical as it may serve as a base for a continued bullish move.
---
Pattern Identified:
Descending Triangle Breakout → Signaling the end of a distribution phase and the potential start of accumulation.
Bullish Retest Zone → Price is testing the previous resistance turned support + Fibonacci confluence.
---
Bullish Scenario:
✅ If price holds above the $0.037–$0.039 support area and forms a bullish rejection candle, potential upside targets include:
$0.04699 (minor resistance)
$0.05395
$0.06310
$0.07483
Up to psychological resistance at $0.09686
---
Bearish Scenario:
❌ If price breaks below the $0.03703 level, further downside could be seen toward:
$0.03306 (local support)
And possibly the recent low at $0.03060
However, as long as the price stays above the 0.618 Fibonacci, the bias remains bullish.
---
Conclusion:
CHZ/USDT is at a critical decision point. A successful retest of the breakout zone combined with Fibonacci support could provide a strong accumulation opportunity for buyers. Watch closely for bullish confirmation candles in the yellow zone before entering.
#CHZ #CHZUSDT #CryptoBreakout #FibonacciLevels #TechnicalAnalysis #AltcoinWatch #TrendReversal #CryptoTrading #TradingViewAnalysis
CHZ Bulls Are Getting Trapped Again —Another Nasty Drop Loading?Yello Paradisers did you notice how clean this CHZ rejection was? After a textbook touch of descending resistance, the price got slammed down again, and what comes next might catch many traders off guard. If you’re not prepared, this next leg could drain portfolios fast.
💎#CHZ/USDT continues to respect its well-defined descending channel on the 12H chart. Every time price attempts to rise, it's met with aggressive selling and this latest bounce was no different. Price failed to even reach the major supply zone between 0.03800 and 0.04200 before getting rejected at the resistance layer around 0.03600. This weakness suggests buyers are running out of steam and may not have the power to defend current levels for much longer.
💎The setup is straightforward #CHZ is trading within a strong bearish structure. The lower highs and lower lows pattern remains intact, and the most recent push up couldn’t break the descending resistance line. This latest rejection also aligns with the horizontal resistance just below the supply zone, which adds confluence to the bearish outlook. Unless the price breaks and closes above 0.04423 which would invalidate the current downtrend the path of least resistance remains to the downside.
💎The next level to watch is moderate support at 0.03026, but more importantly, all eyes should be on the major support zone down at 0.02562. That’s where significant liquidity is likely to be resting and that’s where smart money will be hunting for entries once retail panic sets in.
Right now, volume remains weak, and there’s no bullish momentum strong enough to break out of this channel. Until that changes, expect this to play out as another trap pushing late longs into losses before sweeping the lows.
MyCryptoParadise
iFeel the success🌴

CHZUSDT 1D Analysis CHZ ~ 1D Analysis
#CHZ Buy back on retesting this support block with a short term target of at least 10%++ from here.

CHZUSDT 1WCHZ ~ 1W Analysis
#CHZ As long as this support is still maintained, there is still hope for the next increase. Target of at least 15%+ from here.

Chiliz / TetherUS
"Hello dear friends,
This analysis is based on the 4-hour timeframe and clearly presents two scenarios:
Scenario 1: The price, upon hitting the 4H Order Flow, will continue its downward trajectory. This situation presents a good opportunity to sell, but requires technical confirmation.
Scenario 2: If a CHoCH (Change of Character) is observed on the 4-hour timeframe, we will have an unparalleled selling opportunity in the daily zone.
In both scenarios, we can enter a sell trade upon receiving technical confirmations.
Wishing you all the success!
Fereydoon Bahrami
A retail trader in the Wall Street trading Center (Forex)
Risk Disclosure:
Trading in the crypto market is risky due to high price changes. This analysis is just one person's opinion and shouldn't be taken as financial advice. Before investing, it's best to talk to a financial advisor and do your own research. You are responsible for any profits or losses from this analysis.

CHZUSDT 1WCHZ Update ~ 1W
#CHZ If you still have Conviction on this coin,. maybe this support block is a good price to start buying back.

CHZUSDT: Bullish Breakout or Breakdown? Key Levels to Watch!Yello, Paradisers! Is CHZUSDT about to break out into a bullish rally, or will the support zone crumble and invalidate the setup? We’re at a critical decision point, and how price reacts at key levels will be crucial. Let’s break it down.
💎CHZUSDT has formed a W-pattern at a key support zone, which is a classic bullish reversal structure. This pattern increases the probability of an upward move, but it still requires confirmation. Without a proper breakout above resistance, the bullish setup remains incomplete.
💎To validate the W-pattern and increase the chances of bullish continuation, CHZUSDT needs to break through the resistance level and close a candle above it. A confirmed breakout at this level would signal strength from buyers and could lead to a significant upward move.
💎However, if the price pulls back instead of breaking out, there’s still hope for the bullish case. In the event of a retracement, we can expect a bounce from the strong support zone. But to increase the probability in our favor, it’s essential to watch for bullish signals on lower time frames. These include an Internal Change of Character (I-CHoCH) or familiar patterns like a smaller W-pattern or an inverse head and shoulders. Seeing any of these will reinforce the bullish outlook.
💎On the other hand, if the price breaks down and closes a candle below the strong support zone, the bullish idea becomes invalid. In that case, it’s better to step back and wait for cleaner price action to form before making any new decisions. It’s never a good idea to force a trade when the market is unclear.
Patience is key here. The market rewards those who wait for high-probability setups rather than chasing moves without confirmation. Discipline and a clear strategy will always keep you ahead.
MyCryptoParadise
iFeel the success🌴

CHZ long!"🌟 Welcome to Golden Candle! 🌟
We're a team of 📈 passionate traders 📉 who love sharing our 🔍 technical analysis insights 🔎 with the TradingView community. 🌎
Our goal is to provide 💡 valuable perspectives 💡 on market trends and patterns, but 🚫 please note that our analyses are not intended as buy or sell recommendations. 🚫
Instead, they reflect our own 💭 personal attitudes and thoughts. 💭
Follow along and 📚 learn 📚 from our analyses! 📊💡"

CHZUSDT ACCUMULATIONCHZUSDT has been on my accumulation for a long time now
#UPDATE OPEN POSITION - CHZUSDT
i wont sell my coins at cheap, if i waited this long!!
Previous Idea:

chz usdt idea!"🌟 Welcome to Golden Candle! 🌟
We're a team of 📈 passionate traders 📉 who love sharing our 🔍 technical analysis insights 🔎 with the TradingView community. 🌎
Our goal is to provide 💡 valuable perspectives 💡 on market trends and patterns, but 🚫 please note that our analyses are not intended as buy or sell recommendations. 🚫
Instead, they reflect our own 💭 personal attitudes and thoughts. 💭
Follow along and 📚 learn 📚 from our analyses! 📊💡"

CHZ is warming upLets history repeat itself. PA and TA is bullish, alt season is here. Do not miss this one.
NOT A FINANCIAL ADVICE
ALWAYS USE STOPLOSS AND MANAGE YOUR RISK

CHZUSDT: Is a Major Bullish Reversal on the Horizon?Yello Paradisers! Are you ready for what might be a big move in CHZUSDT? It’s starting to show some strong bullish signals, and missing this could be a mistake. 👀
💎CHZUSDT has displayed a Change of Character (CHoCH) along with a Break of Structure (BOS), pointing towards a bullish market structure shift. Additionally, the formation of an Inverse Head and Shoulders pattern is further boosting the probability of a potential bullish move.
💎But here’s the crucial part! If CHZUSDT breaks out and closes a candle above the resistance zone, it will validate the pattern and increase the probability of bullish move.
💎In case of a pullback, we’re looking at the strong demand zone as a potential bounce area. However, we’d prefer to wait for an Internal CHoCH that realigns the market structure into bullish territory before making any moves. This confirmation would enhance the probability in our favor.
💎On the flip side, if CHZUSDT breaks down and closes below the strong demand zone, it would invalidate the entire bullish setup. At that point, it’s wiser to step back and wait for a clearer price action to develop.
🎖Patience and discipline are key here, Paradisers. Wait for the best setups, and don’t rush into trades without solid confirmation. Trade smart, and stay ahead of the crowd!
MyCryptoParadise
iFeel the success🌴

CHZUSDTCHZ ~ 1W ✅
#CHZ If you have Conviction on this coin,. You need to wait for this descending channel to be successfully broken out to start buying gradually.

CHZ Technical Analysis in Weekly TimeframeHello everyone, I’m Cryptorphic.
For the past seven years, I’ve been sharing insightful charts and analysis.
Follow me for:
~ Unbiased analyses on trending altcoins.
~ Identifying altcoins with 10x-50x potential.
~ Futures trade setups.
~ Daily updates on Bitcoin and Ethereum.
~ High time frame (HTF) market bottom and top calls.
~ Short-term market movements.
~ Charts supported by critical fundamentals.
Now, let’s dive into this chart analysis:
Ever since March 2021, when CHZ made its all-time high at $0.94, it has been in a downtrend. The price of CHZ has fallen almost 94%, and it could get worse if it doesn't hold the initial support level at $0.0536.
Currently, the price is showing a rebound action, and if it plays out successfully, we are likely to see CHZ at $0.1253. In the long run, CHZ needs to achieve a 16x gain to reach the all-time high level.
Considering a further downfall, $0.0344 to $0.0408 is likely to be good support for CHZ.
- Primary Support/Entry: $0.0536.
- Lower Support/Good entry: $0.0344 to $0.0408.
- Primary Resistance: $0.1253.
- Invalidation point: A breakdown and close below the lower support trendline.
DYOR, NFA.
Please hit the like button to support my content and share your thoughts in the comment section. Feel free to request any chart analysis you’d like to see!
Thank you!
#PEACE

CHZUSDT 1WCHZ ~ Update
#CHZ Fulfilled our purchase at this support line. it seems like a pretty good buy. maybe we will prepare another purchase if this support line cannot hold.

Chiliz CHZ price is "resurrecting" “Someone” finally started to show interest in #CHZ and "resurrecting" its price.
The #CHZUSDT price moves “differently” from the CRYPTOCAP:BTC price. It is worth at least taking the asset on a pencil and keeping an eye on it.
A positive scenario is a correction to 0.13 and continued growth
A less positive scenario is a correction to 0.10
Growth in both scenarios is possible up to $0.22, and if you are lucky, up to $0.50)

CHZUSD 1WCHZ ~ 1W 📈
#CHZ This Support Line is quite attractive for making small purchases. with a minimum target of 20%+

CHZ next move CHZ is a strong project with strong team and i believe that it will do great in the upcoming period

CHZ Flag + Channel BreakoutThe CHZ coin recently experienced a notable technical chart pattern development, characterized by a breakout from a flag formation followed by a breakout from a downtrend. This flag formation, typically a bullish continuation pattern, suggested a consolidation phase after a sharp price move, leading to a subsequent breakout indicating a potential for further upward momentum. Shortly after this bullish signal, CHZ also broke out from a longer-term downtrend, further reinforcing the positive sentiment among investors and traders. This downtrend breakout is significant as it implies a reversal of the previous bearish trend, setting the stage for a new phase of bullish market activity. Together, these technical breakouts have sparked increased interest in CHZ, hinting at a potentially strong recovery and increased price action in the near term.
This is a trial. Not a financial advice.

I expect CHZ to break through a strong resistance zone.Hello everyone!
Chiliz is preparing for a breakthrough of the local descending channel. The main resistance factors for the price are currently the descending trend channel, the 200-day moving average (EMA-200), and a strong Fibonacci level of 0.382.
Entry should strictly be made at the Fibonacci level of 0.382.
First target - $0.1135 (+33%)
Second target - $0.139 (+63%)
As I mentioned before, the decline in Bitcoin dominance will provide a good impulse for altcoins to grow.
This is not financial advice; everything you do is at your own risk!

#CHZ Suspicious of the head and shoulders patternIn time H2, it is moving in an ascending channel, which forms a head and shoulder pattern with the formation of lower ceilings, which can enter the sell position if the low dynamic trigger is broken. Therefore, we should see a reverse candle in the resistance range. If the trigger breaks from above and stabilizes, this position will become invalid.
Please support this idea with a LIKE and COMMENT if you find it useful and Click "Follow" on our profile if you'd like these trade ideas delivered straight to your email in the future.
Thanks for your continued support.
Sincerely.
