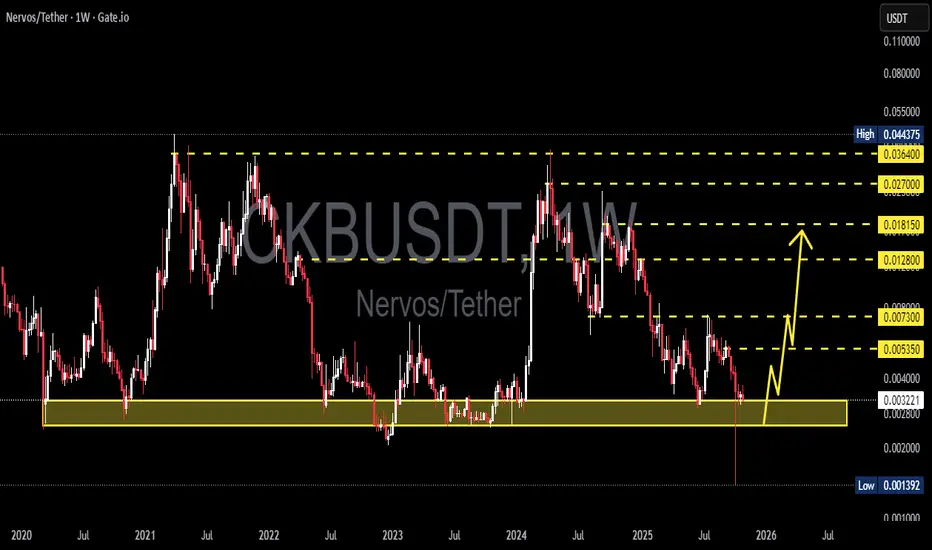
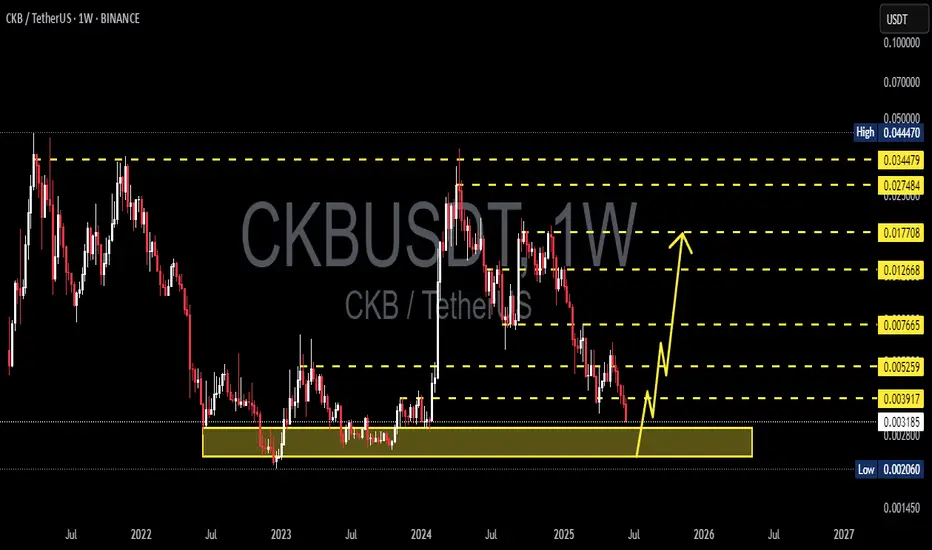
CKB/USDT — The Final Defense Zone Before a Major Move?CKB is currently standing on its last line of defense, the historical support zone between 0.0032–0.0025, which has served as the foundation of every major reversal since 2020.
For over three years, this yellow block has acted as the core accumulation zone where long-term buyers consistently regained control — marking the start of every significant rally that followed.
This time, the setup looks even more intriguing: the latest weekly candle printed a deep liquidity sweep below support, followed by a strong recovery and close back above 0.0032 — a clear sign of absorption and potential smart money accumulation.
The next move from this zone could define the direction of CKB’s macro trend — whether this becomes the start of a massive re-accumulation phase, or a breakdown toward the 0.00139 historical low.
---
📈 Bullish Scenario:
Weekly candle holds and closes above 0.0032, confirming demand strength.
A decisive breakout above 0.00535 would signal a trend reversal and invite momentum buyers.
Next resistances and upside targets sit at 0.0073 → 0.0128 → 0.0181 → 0.0270 → 0.0364.
As long as the 0.0025 floor holds, CKB has a strong chance of forming a macro higher low, potentially igniting a major impulse move upward.
---
📉 Bearish Scenario:
A weekly close below 0.0025 would confirm a structural breakdown.
This would likely lead to a drop toward the 0.00139 historical low zone.
Failed retest near 0.0028–0.0032 after the breakdown would strengthen the bearish continuation setup.
---
📊 Technical Structure & Pattern:
Macro pattern: Long-Term Accumulation Range
Current price sits at the bottom of the macro range, a zone that historically triggers reversals.
The deep wick below support followed by a quick recovery resembles a “Spring Phase” in Wyckoff Accumulation, often signaling the end of seller control and the start of buyer dominance.
---
🎯 Summary:
CKB is entering a make-or-break zone that could shape its direction for the next several months.
A sustained bounce from here could mark the beginning of a major trend reversal, while a confirmed breakdown would open the path to uncharted lows not seen since 2020.
The coming weeks will be crucial in defining CKB’s next macro move — stay alert, watch for confirmation, and manage risk with precision.
---
#CKB #Nervos #CKBUSDT #CryptoAnalysis #TechnicalAnalysis #Wyckoff #SupportAndResistance #CryptoBreakout #SwingTrading #CryptoMarket #MarketStructure #WeeklyChart #SmartMoney
Ckbusdtsignal
CKBUSDT — Test Demand Zone: Reversal or Deeper Breakdown?📝 Full Analysis
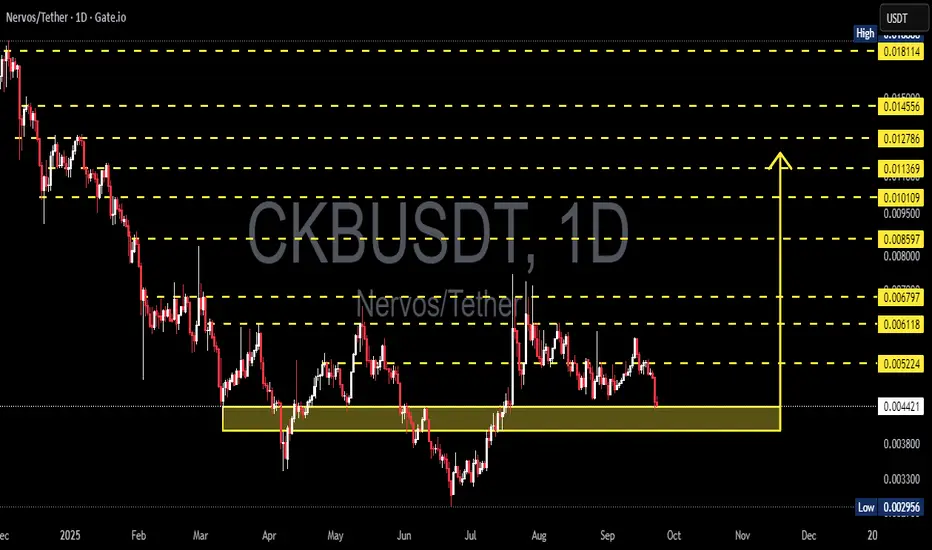
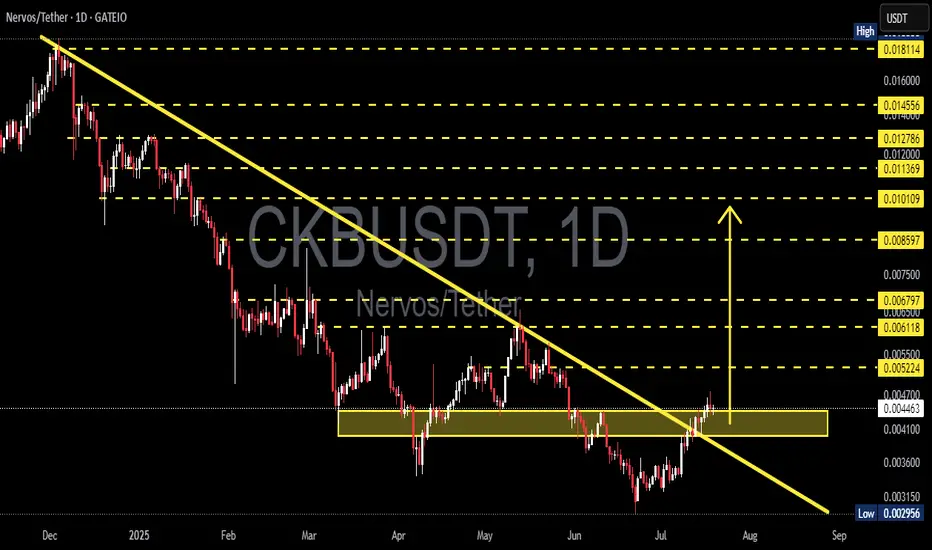
The Nervos (CKB/USDT) pair is now trading right inside a critical demand zone at 0.0038 – 0.0046. This area has repeatedly acted as a last line of defense against deeper declines. At this stage, the market is at a decision point: will this zone trigger another accumulation bounce, or will it finally give way to a stronger bearish continuation?
---
🔎 Price Structure & Pattern
1. Macro Trend
Since early 2025, CKB has remained in a major downtrend, printing consecutive lower highs and lower lows.
Every bullish attempt has been capped around key resistance clusters (yellow dashed lines).
2. Demand Zone (Yellow Box)
The 0.0038 – 0.0046 range has served as a strong base support.
Historically, buyers have stepped in whenever price dipped into this zone.
3. Key Resistance Levels (Upside Targets)
0.005224 → first minor resistance, key for early confirmation.
0.006118 → short-term target.
0.006797 → stronger psychological barrier.
0.008597 – 0.010109 → mid-term supply zone.
0.011369 – 0.018114 → long-term bullish targets if a major reversal takes place.
4. Key Support Levels (Downside Risks)
0.0038 → bottom of the demand zone.
0.002956 → previous major low.
A breakdown below this low could trigger a deeper bearish phase, exposing historical supports seen only on higher timeframes.
---
🚀 Bullish Scenario
Scenario A: Initial Bounce
If price holds above 0.0040–0.0044 and forms bullish reversal patterns (engulfing, hammer, or long-tail pinbar) with high volume, buyers may attempt a rebound.
Scenario B: Breakout Confirmation
A daily close above 0.005224 would shift the short-term structure bullish, paving the way toward 0.006118 – 0.006797.
Scenario C: Extended Rally
With strong momentum and volume, mid-term targets at 0.008597 – 0.0101 could be tested, which will act as a major test for a long-term reversal.
---
⚠️ Bearish Scenario
Scenario A: Breakdown of Demand
A daily close below 0.0038 invalidates the demand zone, signaling strong bearish continuation.
Scenario B: Downside Targets
The first target would be 0.002956 (previous low). A breakdown there could expose deeper historical supports below 0.0025.
Scenario C: Bull Trap / False Bounce
If price bounces off 0.0044 but fails to break above 0.005224 and reverses downward, it signals distribution and usually leads to an aggressive sell-off.
---
📊 Trading Plan (Example, Not Financial Advice)
Aggressive Strategy (Buy the Dip):
Entry near 0.0044, stop-loss below 0.0038.
Risk: ~14%
Target 1: 0.005224 (+17%)
Target 2: 0.006118 (+37%)
RR Ratio to Target 2 ≈ 2.6
Conservative Strategy (Wait for Breakout):
Entry after a daily close >0.005224 with valid retest.
Lower risk of false signal.
Targets extend toward 0.0068 and 0.0085.
Invalidation: All bullish bias is canceled if daily closes <0.0038.
---
🎯 Conclusion
At this stage, the 0.0038 – 0.0046 demand zone is the last stronghold for CKB.
If it holds, a rebound toward 0.0061–0.0068 is likely.
If it breaks, the market could quickly revisit 0.002956 or even lower.
In short, the price action in this zone will determine CKB’s mid-to-long term direction. Traders should closely watch volume and candlestick formations in the coming days to gauge whether buyers or sellers take control.
---
#CKB #CKBUSDT #Nervos #CryptoAnalysis #PriceAction #CryptoTA #SupportResistance #Altcoin #Breakout
#CKB/USDT Still Time to Catch the Move? Some say the move ?#CKB
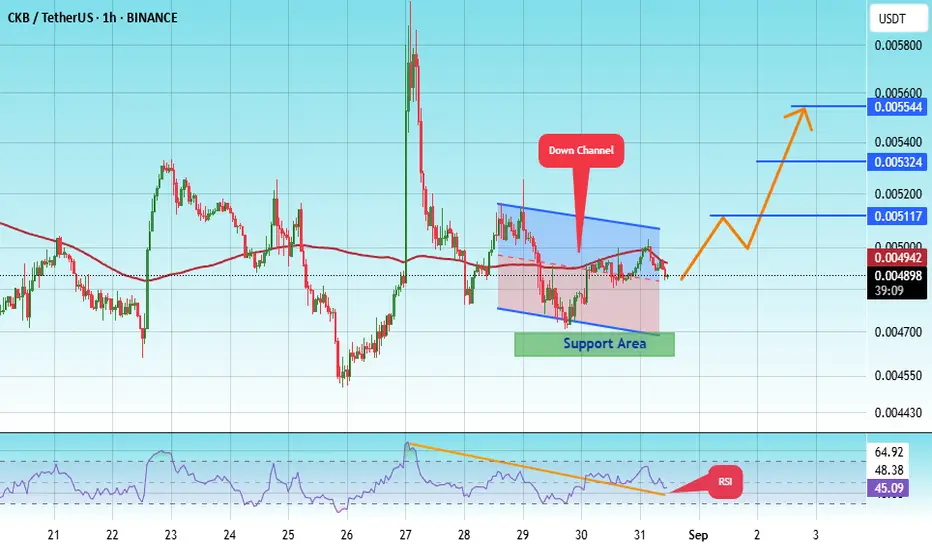
The price is moving within a descending channel on the 1-hour frame, adhering well to it, and is heading for a strong breakout and retest.
We have a bearish trend on the RSI indicator that is about to be broken and retested, supporting the upside.
There is a major support area (in green) at 0.004653, which represents a strong basis for the upside.
For inquiries, please leave a comment.
We are in a consolidation trend above the 100 moving average.
Entry price: 0.004891
First target: 0.005117
Second target: 0.005324
Third target: 0.005544
Don't forget a simple matter: capital management.
When you reach the first target, save some money and then change your stop-loss order to an entry order.
For inquiries, please leave a comment.
Thank you.
CKBUSDT – Still Time to Catch the Move?Some say the move is over.
But when you know what to look for, you see what others miss.
🧠 Smart Entry Zone
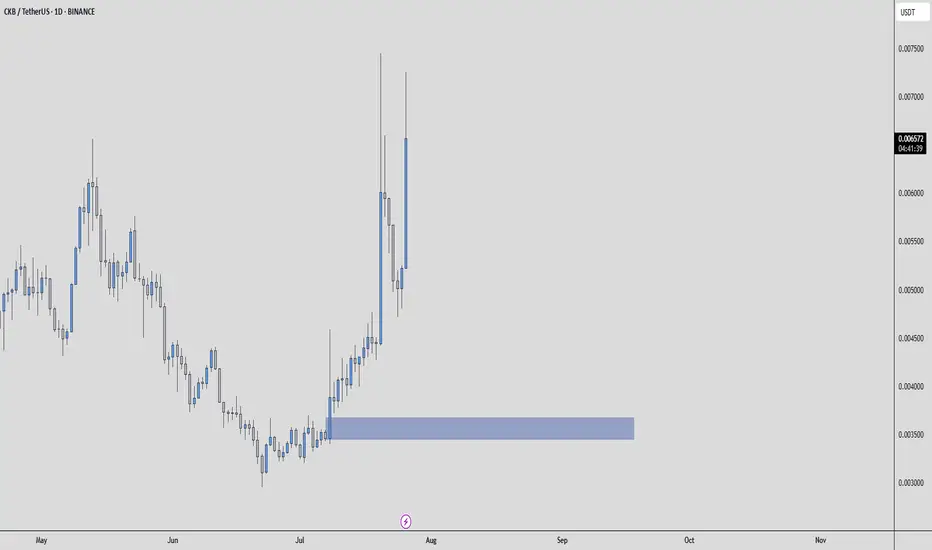
The blue box sits right below value on the volume profile, where weak hands panic and smart money prepares.
On the footprint, we’re seeing signs of absorption, aggressive sellers hitting into passive buyers.
CDV is stable, showing strength beneath the surface.
These are not guesses, they're signals built on experience and data.
🎯 What I’m Doing
If price returns to the blue box:
✅ I’ll wait for renewed absorption
✅ CDV must support the move
✅ Structure reclaim confirms the intent
When these align, I don't hesitate.
Because when you have a plan, you're not reacting, you’re executing.
📌I keep my charts clean and simple because I believe clarity leads to better decisions.
📌My approach is built on years of experience and a solid track record. I don’t claim to know it all but I’m confident in my ability to spot high-probability setups.
📌If you would like to learn how to use the heatmap, cumulative volume delta and volume footprint techniques that I use below to determine very accurate demand regions, you can send me a private message. I help anyone who wants it completely free of charge.
🔑I have a long list of my proven technique below:
🎯 ZENUSDT.P: Patience & Profitability | %230 Reaction from the Sniper Entry
🐶 DOGEUSDT.P: Next Move
🎨 RENDERUSDT.P: Opportunity of the Month
💎 ETHUSDT.P: Where to Retrace
🟢 BNBUSDT.P: Potential Surge
📊 BTC Dominance: Reaction Zone
🌊 WAVESUSDT.P: Demand Zone Potential
🟣 UNIUSDT.P: Long-Term Trade
🔵 XRPUSDT.P: Entry Zones
🔗 LINKUSDT.P: Follow The River
📈 BTCUSDT.P: Two Key Demand Zones
🟩 POLUSDT: Bullish Momentum
🌟 PENDLEUSDT.P: Where Opportunity Meets Precision
🔥 BTCUSDT.P: Liquidation of Highly Leveraged Longs
🌊 SOLUSDT.P: SOL's Dip - Your Opportunity
🐸 1000PEPEUSDT.P: Prime Bounce Zone Unlocked
🚀 ETHUSDT.P: Set to Explode - Don't Miss This Game Changer
🤖 IQUSDT: Smart Plan
⚡️ PONDUSDT: A Trade Not Taken Is Better Than a Losing One
💼 STMXUSDT: 2 Buying Areas
🐢 TURBOUSDT: Buy Zones and Buyer Presence
🌍 ICPUSDT.P: Massive Upside Potential | Check the Trade Update For Seeing Results
🟠 IDEXUSDT: Spot Buy Area | %26 Profit if You Trade with MSB
📌 USUALUSDT: Buyers Are Active + %70 Profit in Total
🌟 FORTHUSDT: Sniper Entry +%26 Reaction
🐳 QKCUSDT: Sniper Entry +%57 Reaction
📊 BTC.D: Retest of Key Area Highly Likely
📊 XNOUSDT %80 Reaction with a Simple Blue Box!
📊 BELUSDT Amazing %120 Reaction!
📊 Simple Red Box, Extraordinary Results
📊 TIAUSDT | Still No Buyers—Maintaining a Bearish Outlook
📊 OGNUSDT | One of Today’s Highest Volume Gainers – +32.44%
📊 TRXUSDT - I Do My Thing Again
📊 FLOKIUSDT - +%100 From Blue Box!
📊 SFP/USDT - Perfect Entry %80 Profit!
📊 AAVEUSDT - WE DID IT AGAIN!
I stopped adding to the list because it's kinda tiring to add 5-10 charts in every move but you can check my profile and see that it goes on..
CKB/USDT Massive Breakout Confirmed! Is This the Beginning?🧠 Technical Analysis Overview (1D Chart - Gate.io)
CKB/USDT has officially broken out of a long-term descending trendline that has capped price action since late 2024. This breakout marks a potential trend reversal from a prolonged bearish market into a bullish phase. The breakout occurs alongside a key horizontal accumulation zone (highlighted in yellow), indicating both volume absorption and buyer interest at this level.
📐 Pattern Breakdown:
Main Structure: Descending Trendline Breakout
Supporting Pattern: Horizontal Accumulation / Reaccumulation Box
Confluence Area: The breakout aligns with the top of the accumulation zone, indicating a structural shift.
Psychological Confirmation: The trendline that acted as resistance is now broken, flipping sentiment.
This setup represents a classical technical reversal signal, strengthened by the fact that CKB has consolidated sideways for weeks before breaking upward — a sign of strong base-building.
📊 Bullish Scenario (Primary Outlook):
If the price continues to close above the breakout zone around $0.0044–$0.0047, a multi-level rally could be triggered:
Target Level Zone Type
$0.00522 Minor resistance
$0.00611 – $0.00679 Mid-range liquidity zone
$0.00859 Key supply zone
$0.01010 – $0.01200 Bullish target zone
$0.01455 – $0.01811 Extended rally target
📈 These levels also align with previous support/resistance flips and Fibonacci-based projections.
✅ A successful retest of the breakout zone will add confidence to the bull case.
🐻 Bearish Scenario (Alternative Risk View):
If price fails to hold above the $0.0044–$0.0047 zone and closes back below with increasing sell volume, it may be a false breakout or bull trap. In this case:
Immediate support lies at $0.00360
Major demand and psychological level at $0.00295
Falling back into the downtrend channel would invalidate the bullish thesis
⚠️ Traders should watch for rejection candles, high selling volume, or breakdown retests that fail to recover quickly.
🔎 Key Takeaways:
Trendline Breakout: First time in 8+ months
Accumulation Zone Break: Validated with bullish momentum
Risk Management: Place stop-losses slightly below $0.0044
R/R Potential: Very attractive reward-to-risk toward $0.0085–$0.012 zones
📌 Summary:
CKB is flashing one of its most promising technical signals in recent months. The breakout from a long-term downtrend, combined with a strong horizontal base, makes this setup highly attractive for both swing and position traders.
All eyes are on whether this momentum can be sustained through key resistance levels. If so, CKB may be on its way to reclaiming lost ground with a potential 100%+ upside from current levels.
#CKBUSDT #CryptoBreakout #BullishReversal #AltcoinSeason #TrendlineBreak #TechnicalAnalysis #CryptoTrading #CKBAnalysis #NervosNetwork #CryptoSetup
CKBUSDT Enters Critical Accumulation Zone – Multi-X Rebound🧠 Overview:
After a prolonged downtrend throughout early 2025, CKB/USDT has now returned to a major macro support zone between $0.0026 – $0.0035 — a historically strong accumulation range seen during 2022–2023. This area has previously triggered powerful rallies, and once again, the market is flashing early signs of a potential trend reversal.
📈 Bullish Scenario (Potential Rebound):
1. Well-Tested Demand Zone:
The area between $0.0026 – $0.0035 has acted as a long-term floor multiple times over the past 2 years.
This suggests strong institutional accumulation or smart money positioning.
2. Rising Volume Could Confirm Trend Reversal:
A surge in volume from this range could validate a transition into a markup phase (Wyckoff Theory).
3. Stair-Step Rally Potential:
Immediate resistance: $0.0050 – $0.0058
Mid-term target: $0.0076 – $0.0090
Major breakout zone: $0.0127 – $0.0180
4. Technical Projection:
Formation of a Double Bottom or Inverse Head & Shoulders could signal a strong macro reversal.
If confirmed, price could aim for $0.027 – $0.038+ in the longer term.
5. Market Sentiment & Timing:
Historically, altcoins like CKB rally after Bitcoin dominance cools off or when BTC moves sideways.
📉 Bearish Scenario (Breakdown Risk):
1. Losing Macro Support:
If price breaks below $0.0026, further downside may accelerate toward sub-$0.0020 levels.
2. Fakeouts Without Volume:
A weak bounce from support without volume could indicate a bull trap or short-term relief rally only.
3. Sideways Risk:
Extended consolidation or ranging may continue for weeks if there’s no strong catalyst or market-wide recovery.
📐 Structure & Pattern Insights:
Long-Term Accumulation Range: The current price action mirrors the accumulation phase from 2022–2023, possibly forming a Wyckoff Re-accumulation structure.
Reversal Patterns Forming: With a potential higher low next week, we may see an Inverse Head & Shoulders begin to take shape.
📝 Conclusion:
CKB is currently in a "high-reward, low-risk" zone from a swing trader’s perspective. Price is near macro bottom levels, and any breakout from here could result in multi-fold returns in the medium to long term.
However, confirmation through volume and structure breakout is essential. Without that, the risk of prolonged ranging or deeper correction remains.
#CKBUSDT #CKB #AltcoinSeason #CryptoBreakout #TechnicalAnalysis #InverseHeadAndShoulders #WyckoffAccumulation #BullishReversal #CryptoGems #CryptoSetup

CKBUSDT 1W Analysis CKB ~ 1W Analysis
#CKB This is the lowest support for now. Buy here with a short term target of at least 15%+ from this support.
CKBUSDT 4D AnalysisCKB ~ 4D Analysis
#CKB Buy gradually from here if you still have confidence in this coin with a short term target of at least 20%+ from here.

CKBUSDT 1D AnalysisCKB ~ 1D Analysis
#CKB Buy gradually from here if you still have confidence in this coin with a short term target of at least 10%+ from here.

CKBUSDT 1DCKB ~ 1D Analysis
#CKB Buy after successfully penetrating this resistant line with a short -term target of at least 10%+ from here.

CKBUSDT 1WCKB ~ 1W Analysis
#CKB Buy when visiting this support with a short -term target of at least 15%+.

CKBUSDT 5DCKB ~ 5D Analysis
#CKB If you still have a Conviction on this coin,. This support you can consider to start buying back with a minimum target of 20%+.
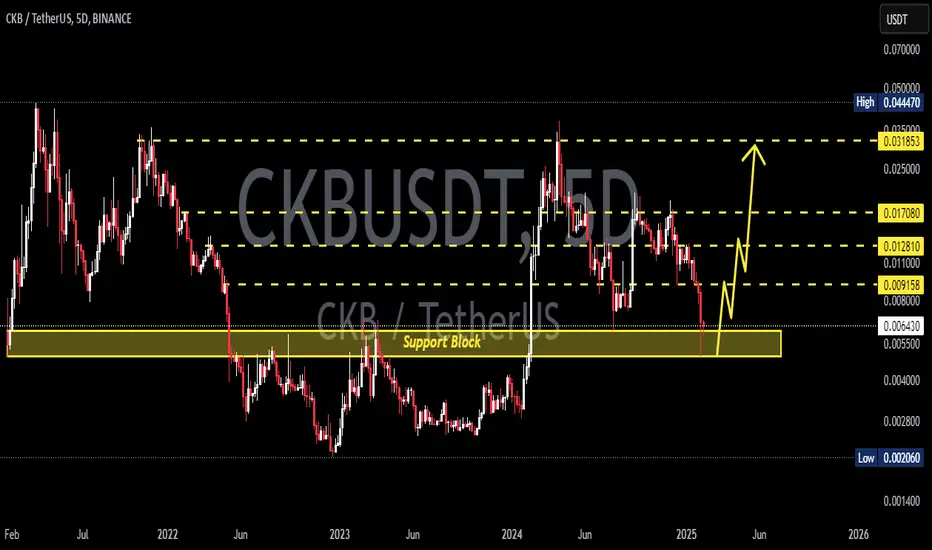
CKBUSDT 5DCKB ~ 5D
#CKB Coming back to revisit this support,. If you still have Conviction on this coin,. This support block would be a very good buying place for now,. With minimal targets 20%++

CKBUSDT: Bouncing from Support LevelCKBUSDT technical analysis update
CKB's price has touched a strong support level on the weekly chart and is now bouncing from it. We can expect a bullish move from the current level. On the daily chart, the price has dropped below RSI 30, which is another bullish sign for CKB.
This is a good time to accumulate some CKB.
Target 300%-500%
Regards
hexa

Nervos Network (CKB) Post After Halving + ALT SEASON at Q1 2025Good Day Traders !
First of all for my Opinion $CKB Price Action will get a NEW ATH at Q1 2025, there is an such thing do you know.
1. This is a First Time CKB HALVING
in my theory ALT that still using POW will get a higher price after first halving. (ONLY FIRST) not second halving
2. BTC SEASON ECOSYSTEM
CKB Release RGB+ as a supporting Layer for BTC, Seems CKB will got fresh CAPITAL for this new Project
i already bought CKB at 2022 when Bearish, still hold 50% of my portofolio because already MOONBAG!
BINANCE:CKBUSDT
see you at ATH!!
Cheers

CKBUSDT 1DCKB ~ 1D
#CKB Continue moving in this descending pattern.
The best way for now, Buy on breaking the resistance line of this pattern or buy on a retest of this key support.

CKBUSDT Inverse Head and Shoulders PatternCKBUSDT Technical analysis update
CKB price is forming an inverse head and shoulders pattern. The price of the right shoulder is now moving towards the neckline for a potential breakout, 100 and 200 EMA act as good support for the right shoulder. If the breakout occurs, we can expect a strong bullish move in CKB.
Only buy after the neckline breakout.
Stop Loss: $0.0111

CKBUSDT 1DCKB ~ 1D
#CKB Make a purchase after successfully breaking through this resistance line. with a minimum target of 10%++

CKBUSDT Crucial Support Test Ahead!Yello, Paradisers! Ready to see where #CKBUSDT is heading? Let’s dive into this critical analysis to stay ahead of the game.
💎 #CKB is currently resting on a key support area. For a confirmed rebound and upward movement, we need to see a bullish candle rejection here. Historically, this support has been strong, sustaining CKB multiple times and preventing further decline. Therefore, there's a high probability that the price will rebound and move back towards our target area.
💎 However, if CKB fails to rebound from the support and breaks down below $0.0135 with a daily close, this would be a bad sign. The price would likely continue downward to the Bullish Order Block (OB) area, where large orders are placed around $0.01.
💎 If CKB reaches the OB area, there's a high probability of a strong rebound and reversal to the upside. However, for the upward movement to continue, the price must reclaim the previous support at $0.0135. If this scenario fails, CKB could fall back to the OB area, which would be a concerning sign.
💎 Bullish invalidation will be confirmed if the daily close candle for CKB is below the OB area. If this happens, the probability of continued bearish movement increases, and the price may dip further.
If you want to be consistently profitable, you need to be extremely patient and always wait only for the best, highest probability trading opportunities.
MyCryptoParadise
iFeel the success🌴

CKB/USDT in the support area, possible to bounce and back upward💎 Paradisers, the recent market dynamics surrounding #CKB have indeed been noteworthy.
💎 Currently, CKB is hovering around the support zone area, and based on the candlestick patterns, there's potential for a bounce.
💎 If this bounce materializes, CKB could retest the resistance around the 0.0255 area. A successful breakout above this level could propel CKB towards our target strong resistance area.
💎 However, if CKB fails to bounce and breaks down below the support area, it could signal a bearish trend reversal, potentially leading the price to move downward towards the Bullish OB area.
💎 In the Bullish OB area, CKB must bounce back and reclaim the price above the support to maintain its upward momentum towards our target. Failure to do so, with a breakdown below the OB area, could lead to further downward movement.
MyCryptoParadise
iFeel the success🌴

#CKB/USDT#CKB
The price is moving in a triangle from the beginning of November 2023
We are about to break the triangle strongly
We are top Moving Average 100
The price now is 0.003464
The first target is 0.003457
The second goal is 0.003820
The third goal is 0.004000

CKB/USDT Indicating Breakout the key area and continue upward!💎 CKB has recently displayed noteworthy market dynamics, experiencing a significant upward movement towards the bearish OB and supply area.
💎 Should CKB successfully break out above the supply zone, this could signify a bullish momentum, the probability leading to substantial upward movement towards our target strong resistance area.
💎 However, if CKB fails to breach the supply zone, we may witness a rejection, prompting a downward movement towards the demand area around 0.099 to initiate a new momentum.
💎 Upon reaching the demand area, it is crucial for the price to bounce back upwards if there is an intention to resume the upward trajectory and attempt another breakout.
💎 Failure to bounce, or worse, a breakdown below the demand area, would indicate bearish sentiment, resulting in continued downward movement and a potential retreat to the accumulation zone area.

CKBUSDT Resistance Breakout!CKBUSDT Technical analysis update
CKB price has approached its resistance line, accompanied by a gradual increase in volume on the 1H chart. While this could suggest potential upward movement.
Buy zone : Below $0.0155
Stop loss : $0.0135
Regards
Hexa
