• Products
  • Community
  • Markets
  • Brokers
  • More
Get started
  • Ideas
  • /CLEBI

CLEBI

CLEBI Stock Analysis CommentaryCLEBI Stock Analysis Commentary 
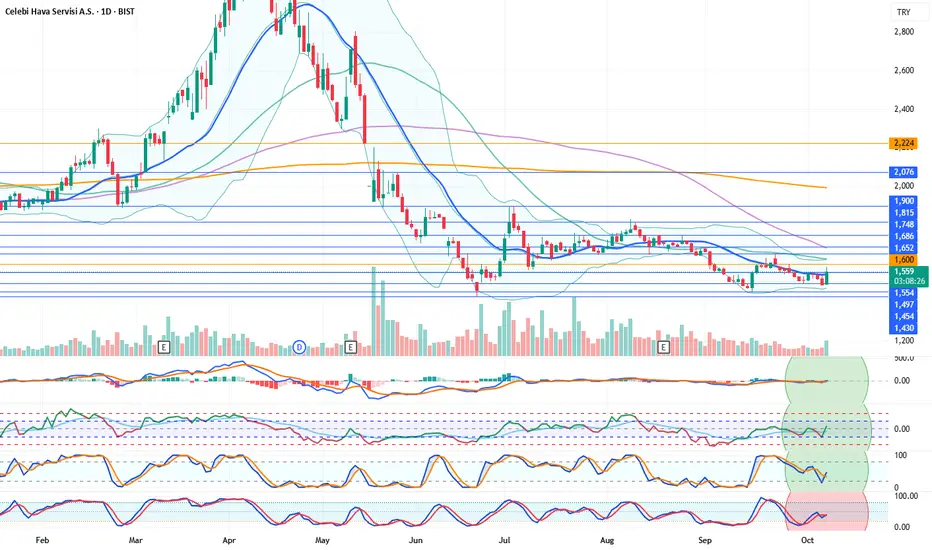
Daily technical indicators are positive. The stock is trying to stay above its 21-day moving average (1546). As of this post, we observe positive price movements above the 1554 support level. Volatility has also increased compared to the previous week. Closing the small price gap around the 1600 level could occur in the short term. If the stock manages to remain above the 21-day moving average, resistances at 1652 and higher levels will be the next to watch. With indicators remaining positive, the probability of seeing further upward movement in the stock has increased. Resistance Levels: 1554 – (1600) – 1652 – 1686 – 1748 Support Levels: 1497 – 1454 – 1430 If you enjoy our analysis, we’d appreciate your support — don’t forget to share it on your social media! Legal Disclaimer: The information, comments, and opinions provided here do not constitute investment advice. Investment advisory services are offered under a formal investment advisory agreement between the investor and authorized institutions such as brokerage firms, portfolio management companies, or non-deposit banks. The views expressed here are personal opinions and may not be suitable for your financial situation, risk tolerance, or return preferences. Therefore, no investment decisions should be made based solely on the information provided on this page.
BIST:CLEBILong
by SinerjiPortfoy

Select market data provided by ICE Data Services. Select reference data provided by FactSet. Copyright © 2025 FactSet Research Systems Inc.Copyright © 2025, American Bankers Association. CUSIP Database provided by FactSet Research Systems Inc. All rights reserved. SEC fillings and other documents provided by Quartr.© 2025 TradingView, Inc.

More than a product
  • Supercharts
Screeners
  • Stocks
  • ETFs
  • Bonds
  • Crypto coins
  • CEX pairs
  • DEX pairs
  • Pine
Heatmaps
  • Stocks
  • ETFs
  • Crypto
Calendars
  • Economic
  • Earnings
  • Dividends
More products
  • Yield Curves
  • Options
  • News Flow
  • Pine Script®
Apps
  • Mobile
  • Desktop
Community
  • Social network
  • Wall of Love
  • Refer a friend
  • House Rules
  • Moderators
Ideas
  • Trading
  • Education
  • Editors' picks
Pine Script
  • Indicators & strategies
  • Wizards
  • Freelancers
Tools & subscriptions
  • Features
  • Pricing
  • Market data
Trading
  • Overview
  • Brokers
Special offers
  • CME Group futures
  • Eurex futures
  • US stocks bundle
About company
  • Who we are
  • Space mission
  • Blog
  • Careers
  • Media kit
Merch
  • TradingView store
  • Tarot cards for traders
  • The C63 TradeTime
Policies & security
  • Terms of Use
  • Disclaimer
  • Privacy Policy
  • Cookies Policy
  • Accessibility Statement
  • Security tips
  • Bug Bounty program
  • Status page
Business solutions
  • Widgets
  • Charting libraries
  • Lightweight Charts™
  • Advanced Charts
  • Trading Platform
Growth opportunities
  • Advertising
  • Brokerage integration
  • Partner program
  • Education program
Community
  • Social network
  • Wall of Love
  • Refer a friend
  • House Rules
  • Moderators
Ideas
  • Trading
  • Education
  • Editors' picks
Pine Script
  • Indicators & strategies
  • Wizards
  • Freelancers
Business solutions
  • Widgets
  • Charting libraries
  • Lightweight Charts™
  • Advanced Charts
  • Trading Platform
Growth opportunities
  • Advertising
  • Brokerage integration
  • Partner program
  • Education program
Look FirstLook First