MARA HIGH PROBABILITY BUY SETUP SOON!!!🚨 MARA HIGH PROBABILITY BUY SETUP 🚨
* Here We Can See Clearly The Next Potential Moves For MARA Coming Hours/Days.
* Keep Your Eyes Close On Your Trading Positions.
* Happy PIP Hunting Traders.
FXKILLA.
CLSK

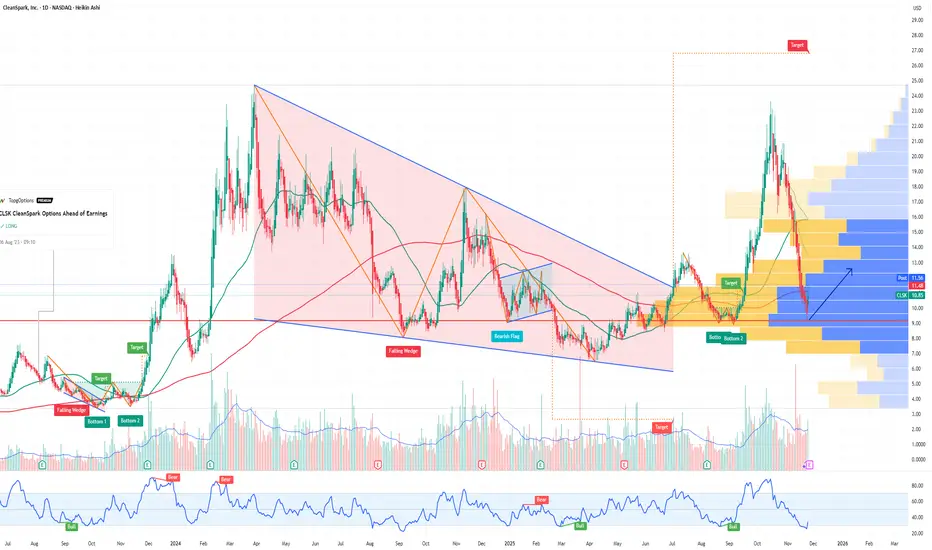
CLSK CleanSpark Options Ahead of EarningsAnalyzing the options chain and the chart patterns of CLSK CleanSpark prior to the earnings report this week,
I would consider purchasing the 12.5usd strike price Calls with
an expiration date of 2026-1-16,
for a premium of approximately $1.42.
If these options prove to be profitable prior to the earnings release, I would sell at least half of them.
CLSK 3 white knights, bullish divergenceNASDAQ:CLSK Price fell a dollar shy of breaking the triangle wave D target, keeping the triangle alive. The 3 green candle structure below is an extremely bullish pattern called 3 white knights.
Wave (2) of the triangle breakout move looks complete at the low-cap golden pocket 0.782 Fib. Wave (3) should be strong and powerful. Breaking out above the descending trend-line is the goal to find momentum. The target is the High Volume Node resistance, $42
📈 Daily RSI has printed a confirmed bullish divergence from oversold.
👉 Continued downside has a target of the High Volume Node at $8.41
Safe trading

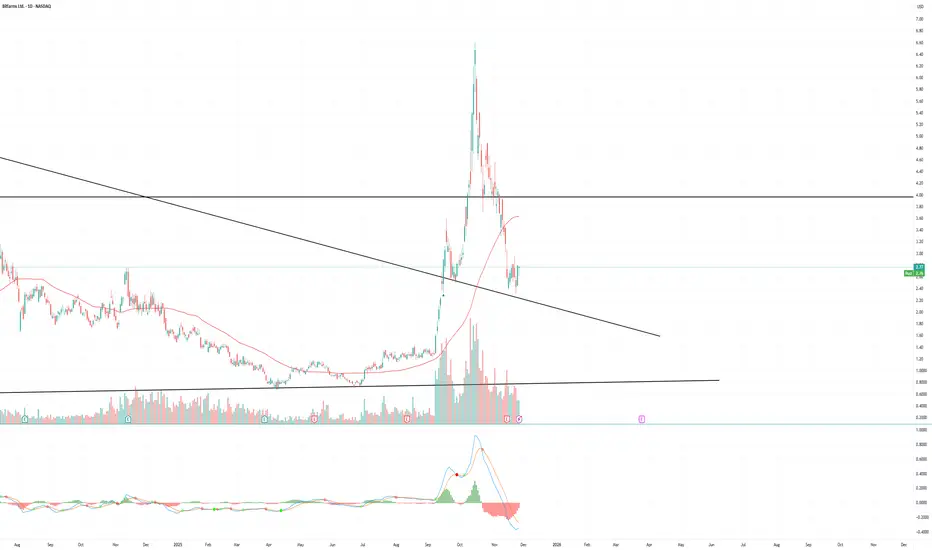
Is it time to reload $BITF? We caught the breakout in NASDAQ:BITF when it was below 3 earlier this year. It ripped all the way to $6+. Since then, the stock imploded back to the original crime scene amidst the AI overvaluation selloff. The $2.30 area provides good support and the stock has reacted off that level. If Bitfarms can scale its entrance into AI/HPC capabilities, the stock should be able to see the $3.8-4 area barring any further market selloff on AI names.
Stock is current trading around $2.70. I would put my stop at $2.30 if taking this idea.
Best of luck if tailing.
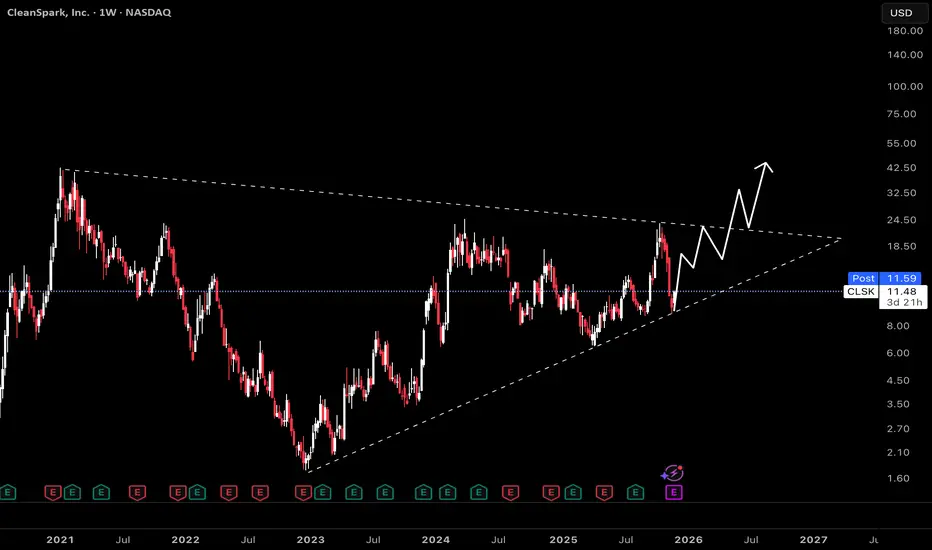
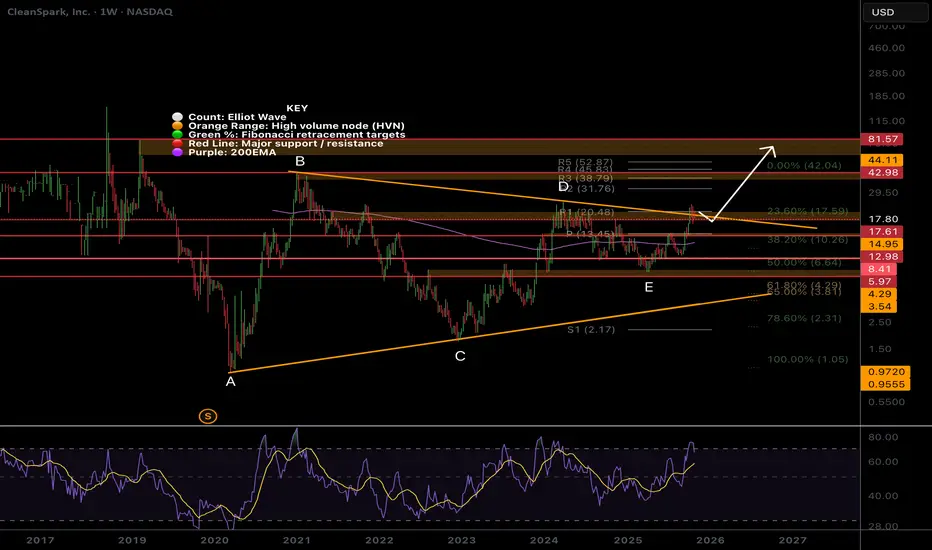
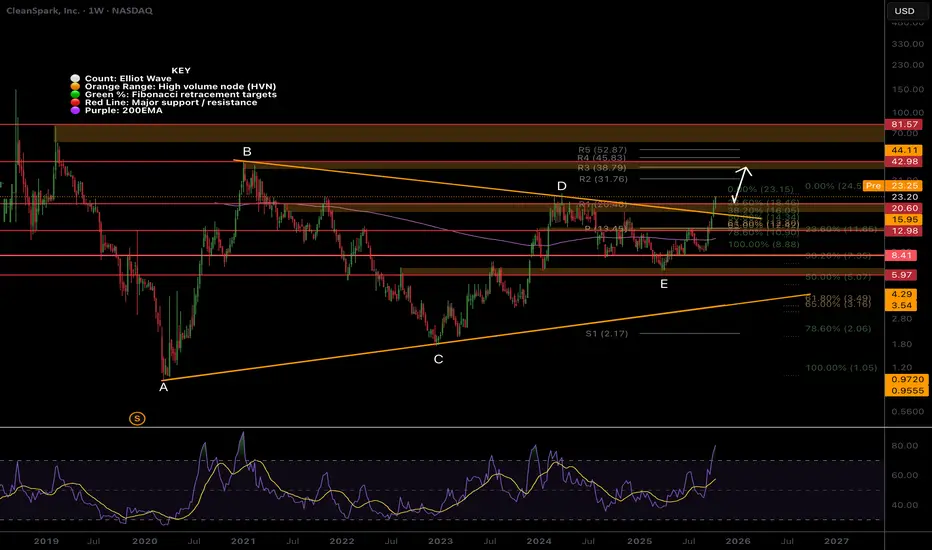
CleanSpark (CLSK): Approaching Triangle BreakoutThis weekly chart tracks CleanSpark, revealing an extended symmetrical triangle formation that has dictated price action since mid-2021. Symmetrical triangles often signal a period of compression in volatility, building up for a breakout as price coils between support and resistance trendlines.
Triangles like this signal indecision, as neither bulls nor bears have established control. The energy stored within the pattern typically results in a significant move once a breakout occurs.
Given the recent bounce off ascending support and renewed momentum, the most plausible scenario is a bullish breakout.
For a short-term opportunity, the upper resistance of the triangle offers a plausible setup for a countertrend trade. If price rallies toward the triangle's descending resistance and stalls, a short position could be initiated with tight risk management. The idea is to sell CLSK at resistance, anticipating that price may be rejected and revert lower within the triangle until a confirmed breakout occurs.
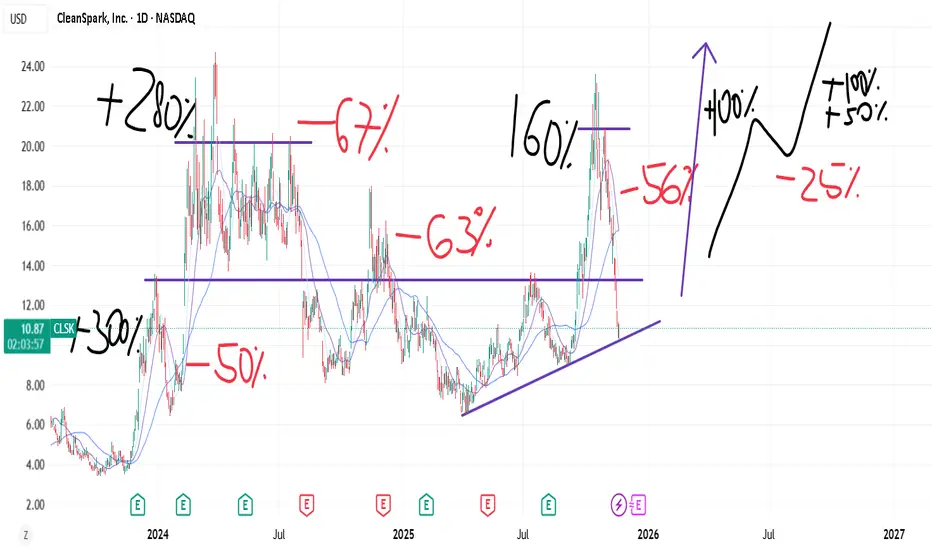
CLSK: Based on momentum principles.As long as BITSTAMP:BTCUSD delivers and AMEX:BLOK is relatively strong, and obviously NASDAQ:NVDA strong.
NASDAQ:CLSK every correction shows less damage (%) which I think is a bullish sign.
Momentum based on Dan Zanger principles. If you had a 160% rally. Even if trend was broken, I dont think you can kill a momentum this easily. Hence, at least "some" strength should follow. There are many examples, that I can show/fact proof.
The risks: I think TVC:TNX rallying is not good and TVC:DXY rally would both be a head wind.
Good: Gold topping should be defacto bottom for BTC near term? ie the driver for rotations. % chasing.
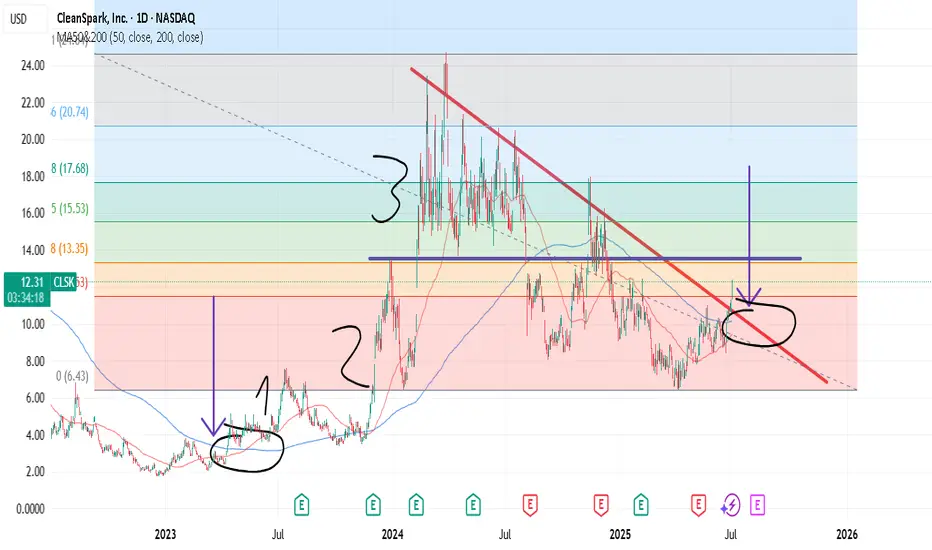
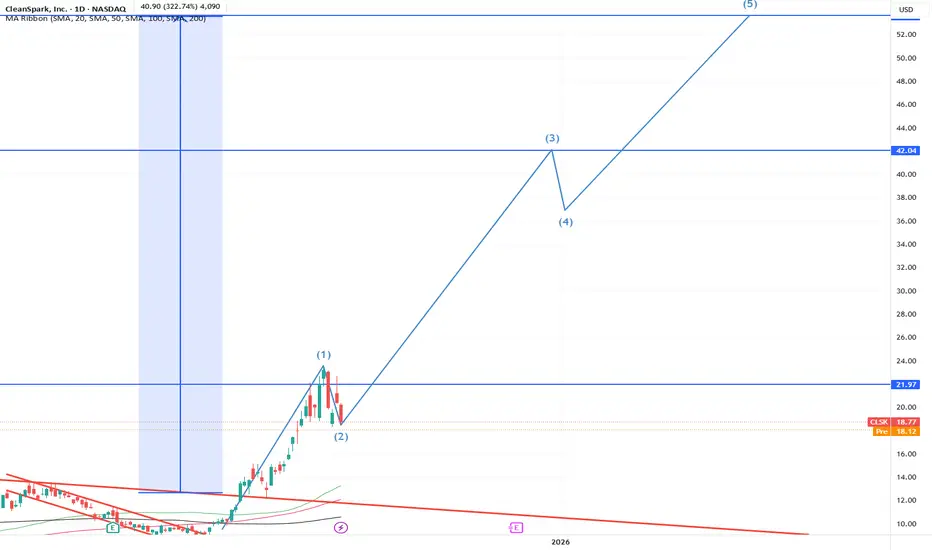
Mega bull trend starts now, CLSKIn short:
1) Goldencross soon to be triggered.
2) too see how the stock could perform (with accumulated, low 200dma), we can look in 2023. It peaked in mid July. After explosive rally in november.
3) 13$ levels is the 50% fibonacci..
4) 1st Elliot wave - people are skeptical. 2nd - woohoo. 3rd wave - fomo.
//Advancing in relative strength (CLSK/SPX).
//Small cap ( AMEX:IWM ) outperformance due to rate cut cycle (starts in September). Evidence is yesterday broadening rally.
//52WH is at november 18$. Expect a gamma squeeze?
position based on probabilities. I never make targets (future is unknown).
🥂
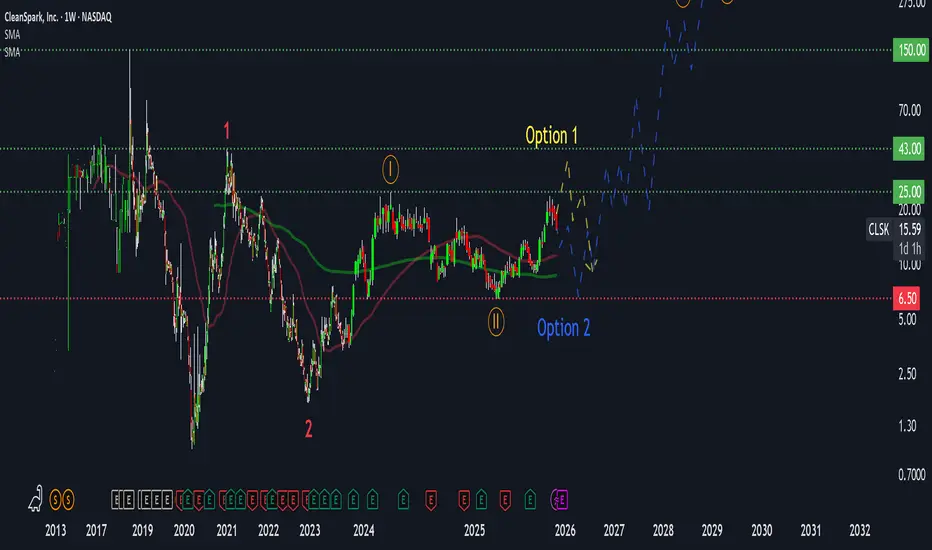
CleanSpark (CLSK): Strong Upside Expected After CorrectionWhy this matters now:
CleanSpark remains one of the strongest miners in the sector, but the current technical structure suggests a likely correction before the start of a major bullish cycle.
🔹 Main Thesis
Technically, CLSK is bullish, but a short-term correction to $8–10 is expected, after which the stock could launch a strong upward move toward $43 and beyond.
🔹 Key Arguments
Wave Structure:
Wave 1 is complete ✅, Wave 2 (correction) is underway. We are now in the final phase before the next impulse wave.
Resistance $25–43:
$25 is a key previous high. A short-term breakout with a small pullback is possible, followed by a retest and formation of the next upward wave. Targets: $43, then $150+.
Volume Cluster $8–10:
The main smart money cluster where significant positions were accumulated provides strong support. This is likely the bounce zone after the correction.
Fundamentals:
EPS growth ~50% YoY, forward P/E ~15. Cash flows are unstable.
Correlation with Bitcoin:
As a Bitcoin miner, CLSK is highly correlated with BTC. Historically, when BTC corrected 70–80%, CLSK tested lows in the $8–10 zone.
Currently, CLSK could first rise to $30–35 and then correct along with BTC by roughly 70%, aligning with the $8–10 support cluster.
Levels and Targets
Resistance: $25 - key level, possible false breakout
Support / Smart Money Cluster: $8–10 - likely bounce zone
Final Cycle Targets: $43 → $150 - breakout above $43 opens the path to $150+
🔹 Risk & Invalidation
Main Risk: strong BTC correction → CLSK tests $8–10 cluster.
Historically, four previous corrections in BTC were around 70–80%, matching the current structure.
❌ Invalidation: break and close below $6 → current wave structure would be invalidated and require reassessment.
🔹 Summary
CleanSpark is forming a strong bullish trend. After a possible correction to $8–10, a powerful upward impulse is likely, with targets at $43 and beyond. Potential from current levels: 10x+, but the path includes a consolidation phase.
🔹 Discussion
What’s your take on CLSK? Do you agree with the correction scenario, or do you see a different move?
💬 Comment below or suggest which ticker we should analyze next!
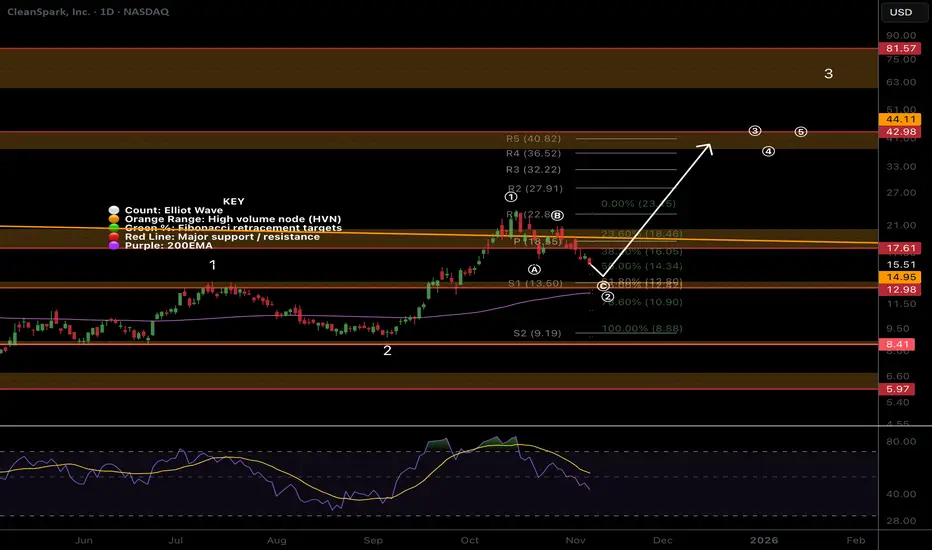
CLSK Local analysis, pullback does not violate larger trendNASDAQ:CLSK Price is pulling after a failed breakout falling back into the macro triangle. Behaviour appears to be a textbook corrective ABC which should end with one more thrust down to the S1 pivot before continuation to the upside.
Wave © can be strong and powerful, often where investors capitulate. The target is the High Volume Node support, rising daily 200EMA, Fibonacci golden pocket and S1 pivot.
Daily RSI has room to fall.
Breaking above wave (B) would suggest the correction is over.
Cleanspark $CLSK1. Executive Summary:
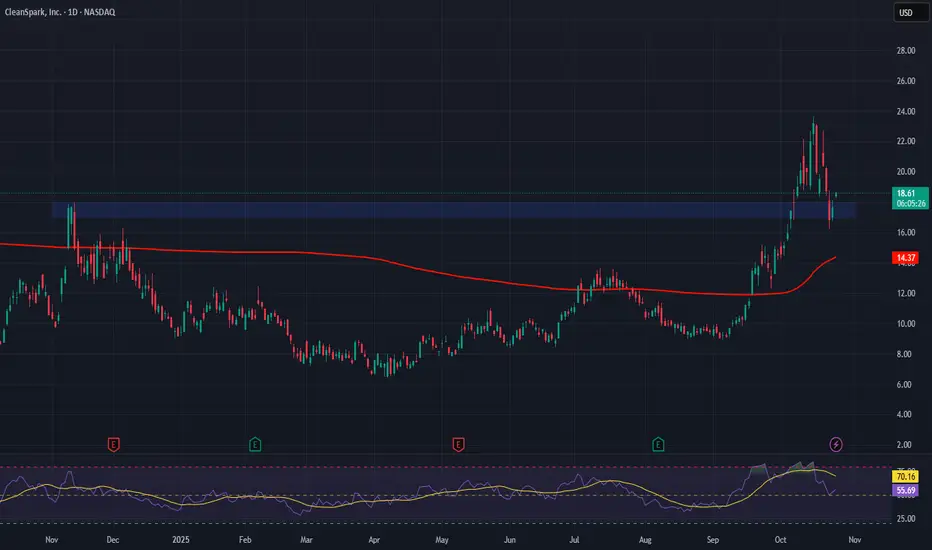
A significant bearish reversal pattern, a Double Top, has been identified on the NASDAQ:CLSK chart, suggesting the exhaustion of the prior uptrend and a potential shift to a sustained bearish phase. The breakdown has already breached the initial Fibonacci retracement support levels at 0.236 ($19.56) and 0.382 ($17.06). The current technical outlook points toward a continued descent towards the deeper Fibonacci levels at 0.50 ($15.03) and 0.618 ($13.01). It is at these deeper retracement zones that the market is anticipated to find a powerful base of support, potentially catalysing a significant rebound with the ultimate objective of retesting the all-time highs.
2. Pattern Analysis: The Double Top Formation
Identification: The pattern is defined by two distinct peaks occurring in February 2024 and October 2025, both reaching a similar price high. The trough between these peaks forms the "neckline" of the pattern.
Interpretation: A Double Top is a classic reversal structure indicating that buying momentum failed to create a new high on the second attempt. This failure often signals a transfer of control from buyers to sellers. A confirmed break below the neckline validates the pattern and activates its bearish price objective.
Implication: The completion of this pattern establishes a bearish near-to-medium-term bias, projecting a measured move downward.
3. Fibonacci Retracement Analysis:
The Fibonacci retracement tool has been applied to the key upward move that preceded the Double Top formation, likely the bull run that culminated in the first peak.
Current Market Progression: The bearish momentum following the Double Top breakdown has been significant, as evidenced by the breach of key Fibonacci support tiers:
0.236 Level ($19.56): The break below this first level confirmed the initial shift in momentum from the highs.
0.382 Level ($17.06): The violation of this more substantial level reinforced the strength of the sell-off, indicating it is more than a minor pullback.
Forward Projection & Strategic Levels:
Next Downside Targets: The path of least resistance remains downward, with the following Fibonacci levels acting as the primary targets for the ongoing bearish move:
0.50 Retracement ($15.03): This level represents a 50% pullback of the entire prior uptrend and is a psychologically significant benchmark watched closely by traders.
0.618 Retracement ($13.01): Known as the "Golden Ratio," this is a deep and historically strong support zone. A move to this area would represent a full and healthy correction of the preceding bull market.
The Rebound Thesis: The core strategic insight is that the 0.50 ($15.03) and 0.618 ($13.01) retracement levels are not merely targets, but potential reversal zones. These deep retracement areas are where long-term investors, value buyers, and institutional money often re-enter the market. The convergence of these levels with the measured move target of the Double Top creates a high-probability zone for a potent bullish reversal. The anticipated rebound from this support base would initially aim for the neckline of the Double Top, with the eventual, long-term objective being a return to challenge the all-time highs.
4. Synthesis and Strategic Outlook:
The current market structure for NASDAQ:CLSK is bearish, with a clear sequence of lower highs and lower lows. The prudent strategy is to anticipate a continued move down towards the $15.03 and $13.01 levels.
However, a sophisticated approach views this not as a one-sided bearish forecast, but as a two-stage process:
Bearish Phase: The downtrend remains intact, driving the price toward the key Fibonacci support cluster between $15.03 and $13.01.
Reversal Watch: As the price approaches this defined support zone, vigilance for bullish reversal signals (such as hammer candlesticks, bullish engulfing patterns, or positive divergence on momentum oscillators like the RSI) becomes critical. These signals would indicate that the selling pressure is exhausting and the anticipated rebound is beginning.
Conclusion:
In summary, NASDAQ:CLSK is operating within a bearish trend following a confirmed Double Top reversal. The technical evidence points toward a further decline to the $15.03 - $13.01 support zone. It is at this juncture that the conditions for a major trend reversal are expected to materialize, setting the stage for a powerful rebound with the potential to reclaim lost ground and ultimately target a return to the all-time highs. All bullish prospects, however, are contingent upon finding a solid base at these critical Fibonacci levels.

CLSK, Still much higher to goTheres a lot of fear in my comments across platforms due to the candle sizes. Participants need to understand the volatility of their holdings or face repeated mistakes and stress due to fear.
Price is attempting to breakout of the macro triangle upper boundary but was rejected. Breaking above wave D at $24 is key to trigger the next thrust I’m looking for towards $42 then $80 all time High Volume Node. Triangles are penultimate patterns found before a final strong move.
Price has momentum above the weekly pivot 200EMA but currently trapped in a High Volume Node where we expect price to stall before continuing upwards.
🎯 Terminal target for the business cycle could see prices hit $80- the all time High Volume Node
📈 Weekly RSI is oversold with no divergence and can remain here for months as price keeps increasing.
👉 Analysis is invalidated below wave E, keeping the triangle alive
CLSK, nothing changed, $40+ incoming, 2x minNASDAQ:CLSK is low cap asset and is prone to large volatile swing like we are seeing but also gives way to opportunities.
Price is attempting to breakout the macro triangle upper boundary was rejected at first. Breaking above wave D at $24 is key to trigger the thrust I'm looking for towards $42 and $80 all time High Volume Node after that.
Price has momentum above the weekly pivot 200EMA but currently trapped in a High Volume Node where we expect price to stall before continuing upwards.
RSI can stay in overbought for months.
Participants are still afraid of this asset coming against them and its volatility, a reflection of the broader sentiment of FEAR in retail that is still persisting at all time high. Ridiculous bear market PTSD.
A recipe for MUCH higher. until market wide confidence takes hold.
Safe trading

CleanSpark (CLSK)— Bridging Bitcoin Mining and AI InfrastructureCompany Overview:
CleanSpark, Inc. NASDAQ:CLSK is a leading Bitcoin mining and high-performance computing (HPC) company leveraging sustainable energy to power scalable digital infrastructure—offering investors exposure to both the crypto mining and AI computing sectors.
Key Catalysts:
Strong financial performance: Bitcoin holdings exceed 13,000 BTC, while Q3 2025 revenue surged 90.8% YoY to $198.6M, underscoring robust execution and institutional demand.
AI and HPC expansion: Strategic buildout of Georgia data centers positions CleanSpark at the crossroads of AI and blockchain, tapping into multi-trillion-dollar infrastructure opportunities.
Financial strength: A $500M Bitcoin-backed credit facility enhances liquidity and scalability while maintaining capital discipline and shareholder value.
Investment Outlook:
Bullish above: $17.00–$18.00
Upside target: $38.00–$40.00, driven by AI integration, operational scale, and Bitcoin price leverage.
#CleanSpark #BitcoinMining #AIInfrastructure #HPC #Crypto #SustainableEnergy #Blockchain #Investing #CLSK
CLSK, Gold and implied volatility highest since 2021 - get readyDJT inflated the volatility balloon. We can see that on all asset classes. VIX(SPX) and DVOL(BTC) implied volatility shows price target of 7100pts and 144kUSD per BTC accordingly by EOY. That means that big move is ahead of us.
Yesterday, there was a large profit-taking in gold and seems gold will stay relatively muted for some time.
Now the question is where money from gold will go into? Also fed announced faster rate cut pace - Bonds will have much lower premium.
So my expectation is that money will flow from gold and bonds market to the risk assets like SPX, emerging markets na BTC. I dont need to explain how higher BTC price will influence CLSK share price.
STAY PUT !
Long, medium term CLSK is glued to BTC performance. But... daily/weekly CLSK tends to be leading indicator to BTC not BTC to CLSK like most people think. We can see it right now - Yesterday BTC was up but miners were down and today BTC is again back below 110k. That's due to much lower liquidity
don't get fooled by short term moves huge bull run is ahead of us !
Not financial advice just sharing my observations and thoughts.
P.S. I put money where my words are - Yesterday I bought additional ~500 shares.
CLSK Almost confirmed huge macro triangle breakout signal!NASDAQ:CLSK Should hit the wave D high today signalling the macro triangle breakout is ready to really move!
Nothing more to add.. send it!
Safe trading
CLSK BULLISH BREAKOUTCLSK Bullish breakout after a long long time .
you can see on the weekly and daily both it has not even broken the long term bearish trend but also retested the descending resistance top channel and what an amazing bounce back from that.
This is beautifully setting up for a streak to 18$ minimum so get ready with stop loss of 12 and jump in the trade
Entry now
Stop loss 12
TP 18

Why CleanSpark Remains a Great Entry Point in Q4 2025
CleanSpark’s core Bitcoin-mining story now carries optionality from HPC/AI and stronger policy positioning, turning current pullbacks into compelling buy zones for investors seeking asymmetric upside.
Thesis
Mature, fast-growing hashrate plus low-cost renewable power drives durable margin advantage.
Strategic BTC treasury preserves upside while funding growth.
New revenue diversification into HPC/AI hosting reduces single-commodity risk and increases enterprise valuation multiples.
Constructive engagement with U.S. policymakers improves regulatory visibility and potential for supportive grid/energy treatment.
Fundamentals - updated with diversification
Hashrate and margins: Continued fleet expansion and modern ASIC deployment compound revenue per share as network difficulty rises.
Power and cost structure: Contracted low-cost renewable supply and multi-site footprint protect margins during BTC drawdowns.
HPC/AI diversification: CleanSpark is deploying idle capacity and building data-center capabilities to host high-performance computing and AI workloads, creating higher-margin, recurring revenue streams that complement cyclical mining income.
Capital mix and treasury: Equity-led growth plus a balanced BTC hold/sell policy preserves optionality while funding capex.
Technical snapshot (entry-friendly)
Shares trading near established support with higher-volume bounces on dips.
Long-term moving averages maintain a constructive slope, supporting the view that pullbacks are accumulation, not trend reversal.
Relative strength vs smaller miners indicates market preference for scaled, diversified operators.
Policy backdrop - talks with U.S. administration
CleanSpark’s growing footprint and large, contracted renewable loads have enabled constructive dialogues with U.S. federal and state energy officials about grid services, demand response, and tax/energy policy that favor resilient, flexible loads.
Better regulatory visibility reduces execution risk and can unlock incentives or grid access advantages versus smaller, less-engaged operators.
Talks with Scott Bessent (practical significance)
Public‑level engagement that includes Treasury leadership increases the odds of clearer, constructive policy outcomes for large, flexible loads and grid-service participants.
Visible dialogue with high‑level officials shortens regulatory uncertainty, enhances institutional underwriting, and can unlock programmatic or pilot opportunities that improve site utilization and economics.
Final thoughts
CleanSpark combines scaled mining economics, intentional BTC exposure, and real diversification into HPC/AI, all while engaging constructively with U.S. policymakers. That mix creates asymmetric upside from current levels, making this pullback a high-conviction entry for investors wanting leveraged Bitcoin exposure through an operator that’s evolving into a diversified infrastructure player.

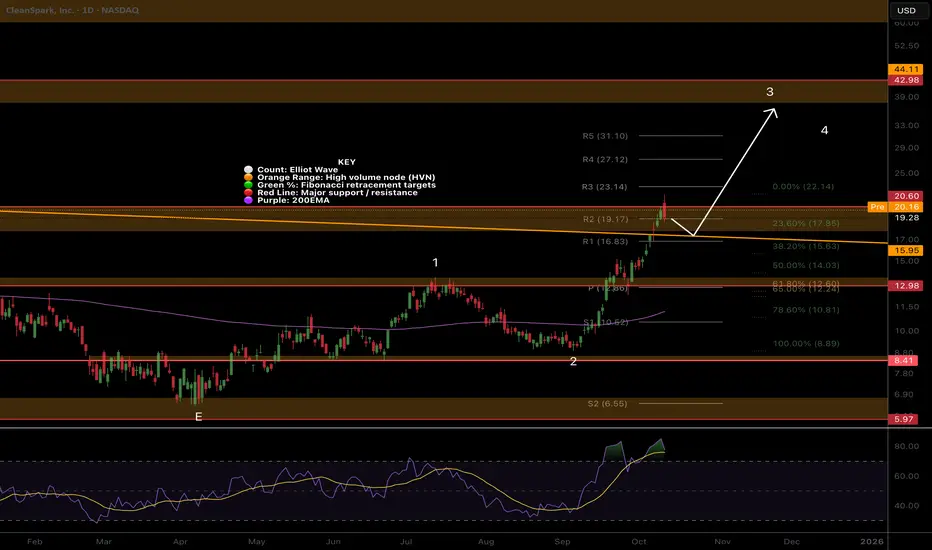
CLSK Rejected at thr major resistance, higher to go CLSK hit our first take profit target at the major resistance High Volume Node but has broken out of the macro triangle structure hinting at a big move still to come! Nothing concerning for me yet happening.
Wave 3 is underway to a minimum target of the $40 High Volume Node
RSI is overbought but no divergence and this can persist up here for months.
Safe trading
CLSK Breaking out!CLSK continues with momentum closing above the macro triangle upper boundary trend-line and now testing the last resistance before a breakout! This will coincide with a break above wave D and flip the macro structure bullish bringing in more capital!
Daily RSI is overbought with slight bearish divergence but can remain this way for weeks in a strong uptrend!

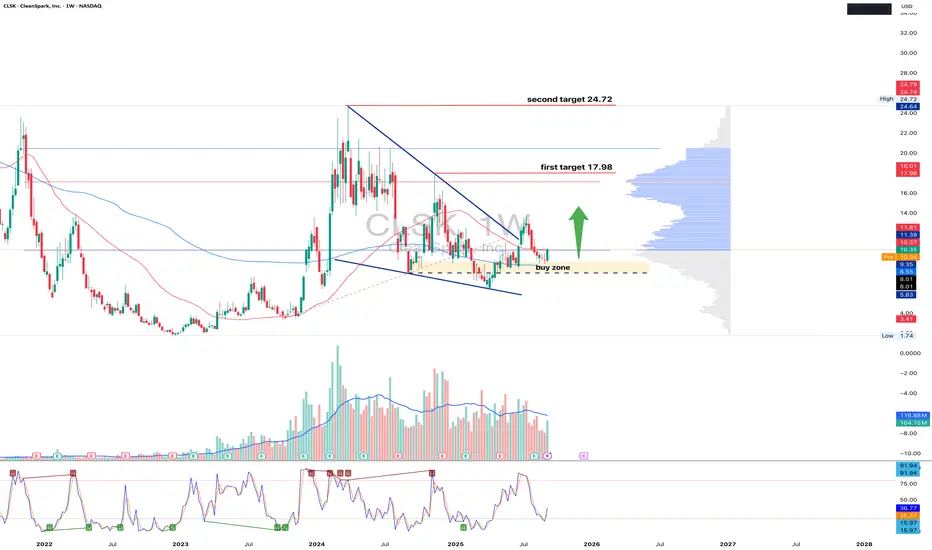
CLSK - accumulation before a breakout or a trap?CLSK price is consolidating in the 9.5–10.5 buy zone, which aligns with a key volume area. On the weekly chart, a breakout from the falling wedge is forming, and if bulls manage to hold above the current range, the next targets stand at 17.98 and 24.72. Volumes indicate institutional interest, while RSI at lower levels suggests a potential reversal.
Fundamentally , CLSK is strongly correlated with Bitcoin and the mining sector: declining hash rate among competitors and expectations of a softer Fed policy provide a supportive backdrop.
The tactical setup is straightforward: defending 9.5–10.5 opens the way toward 17.98 and 24.72, while a breakdown would shift the price lower.
For now, it looks like accumulation, but the real question is who will give up first - the bulls or the bears.
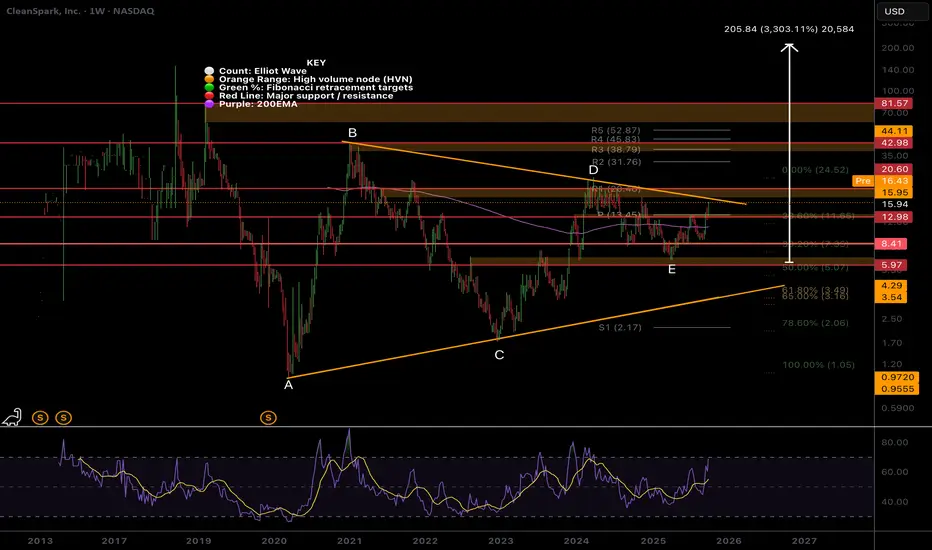
CLSK Testing Macro Triangle Upper Boundary!NASDAQ:CLSK Macro analysis shows a multi-year triangle has completed at the mid EQ, where price has the highest probability of completing wave E. CRYPTOCAP:XRP Did a x10 after this breakout and I am expecting similar move with CLSK.
Price should consolidate for a while in $16-$20 range as it works through wave D and trend-line resistance. Downside target is the weekly pivot at $13.45 which could offer a great buy!
All time high sits at $80, triangle pattern target is extremely high at $200 (triangle height measured from wave E bottom) but take this with a pinch of salt and keep your profit taking realistic! Crazier price moves have happened!
Weekly RSI is not yet oversold and price often gathers months of strong momentum when RSI gets to these levels reinforcing the analysis.
Safe trading
CLSK Attempting a significant resistance breakout!NASDAQ:CLSK has awoken at long last and has smashed through the wave 1 resistance High Volume Node straight into the Macro Triangle upper boundary i have been sharing in the weekly time frame posts. Breaking out above this and wave D at $20 will be a bullish signal with significant upside to come!
The High Volume Node resistance held as support in the big drop last week, quickly recovering back to highs showing strong demand.
The next local target is the wave D resistance $20 with continued upside in wave 3
Daily RSI is overbought but divergence yet and daily 200EMA has flicked positive.
Analysis is good unless we go back below wave 2 into the golden pocket.
Safe trading
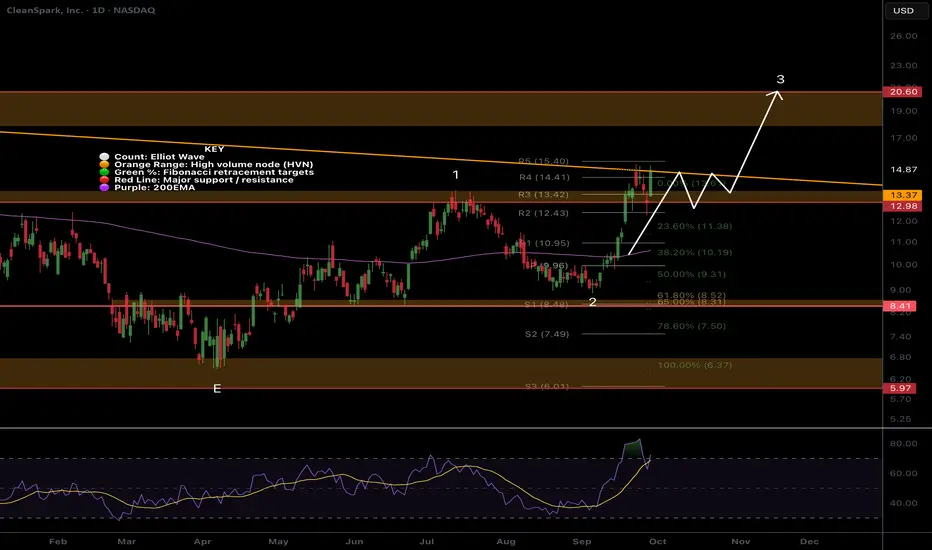
CLSK Moving Fast!Local Analysis / Targets / Elliot Wave
CLSK sentiment was awful as I explained a few weeks ago, it appeared to be in a macro triangle similar to XRP before the x10 breakout. That breakout is now underway with a huge move last week characteristic of wave 3 and reinforcing my analysis. Minimum wave 3 targets are well above $20 and price should move quickly once it over comes the triangle resistance it is now approaching at $15.
Price was front run above High Volume Node support and the golden pocket leaving limit orders behind forcing them to buy higher if they want to participate pushing the price up further.
Daily RSI is overbought but so was NASDAQ:IREN and that continued upwards for weeks, as has $WULF.
Standard Deviation Band Analysis
Standard deviation bands remain negatively sloped but I am expecting that to change and price continues upwards. That said, investors should be weary of a reversal in this area where price spends <5% of the time. Bulls are looking for a sustained move into the zone and a breakout above the SD+3 threshold offering a target of $50.
Safe trading
