Daily Orderflow on $ES $NQ $GC. 23.07.2025, WednesdayOutlining the orderflow along with the examples of todays trades. Outlined PM session expansion as well
Cme!

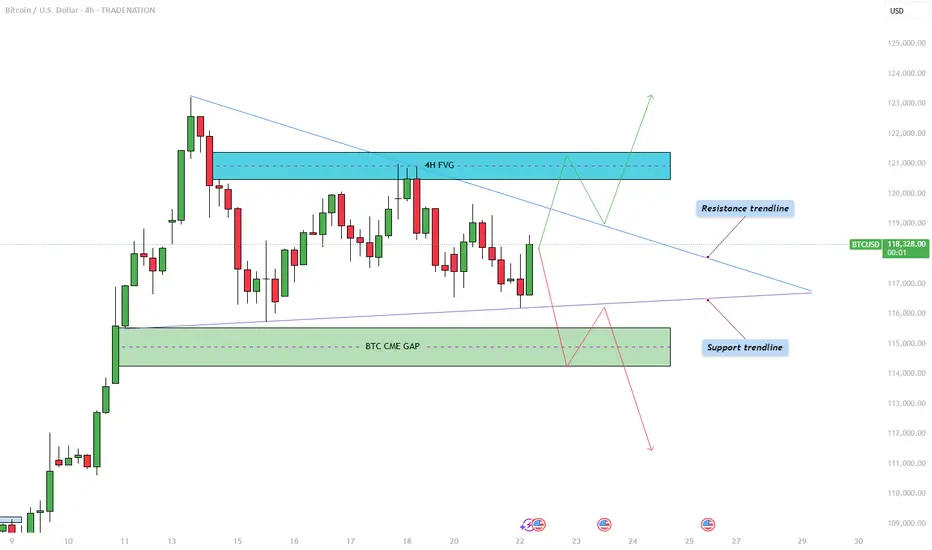
Bitcoin - Triangle pattern consolidation!The Bitcoin price action is currently coiling within a symmetrical triangle pattern on the 4-hour chart, as illustrated in the chart provided. After a significant bullish move earlier this month, BTC has now entered a phase of consolidation, marked by a series of lower highs and higher lows. This has formed a triangle pattern, suggesting an imminent breakout as price nears the apex. The upper boundary of the triangle acts as dynamic resistance, while the rising lower trendline provides firm support. Given the preceding upward momentum leading into this consolidation, the bias slightly favors a breakout to the upside, though the market can always surprise.
Bullish Scenario
In the bullish case, Bitcoin would need to break convincingly above the descending resistance trendline. Should that occur, the next key level to watch lies within the 4-hour bearish Fair Value Gap (FVG) between $120,500 and $121,400. This region represents an area of inefficiency where price moved rapidly in the past, and it is likely to attract selling pressure again. Bulls would ideally aim to reclaim this zone with strong momentum and potentially use it as support in a retest scenario. A successful retest of the triangle’s upper boundary could also trigger a liquidity grab above recent highs, particularly above the all-time high levels.
Bearish Scenario
On the flip side, a bearish breakout would involve BTC breaking below the ascending support trendline. If this happens, the most probable downside target would be the CME gap left behind from two weekends ago, located between $114,300 and $115,500. This price gap occurred due to the discrepancy between Friday’s closing price and Sunday’s opening price on the Chicago Mercantile Exchange, often a magnet for price reversion. After this gap is filled, it is possible that BTC sees a short-term bounce to retest the triangle from below, before potentially continuing lower to address further imbalances in price action.
How to Confirm a Valid Breakout
Trading triangle patterns can be deceptive, as BTC often exhibits false breakouts designed to trap traders on the wrong side. To confirm a valid breakout, it's crucial to observe at least a few 4-hour candles closing decisively above or below the triangle boundaries. Additionally, breakout strength should be accompanied by a noticeable increase in volume. A breakout without volume confirmation is often a sign of a fake move, and entering trades under such conditions can be highly risky.
Final Thoughts
BTC is currently consolidating within this symmetrical triangle formation, signaling a period of indecision and potential volatility ahead. While both bullish and bearish scenarios are plausible, it is essential to wait for clear confirmation before committing to a position. Patience and discipline are key, especially when navigating patterns prone to fake-outs. For now, remaining on the sidelines until a confirmed breakout occurs may be the most prudent strategy.
--------------------------
Disclosure: I am part of Trade Nation's Influencer program and receive a monthly fee for using their TradingView charts in my analysis.
Thanks for your support. If you enjoyed this analysis, make sure to follow me so you don't miss the next one. And if you found it helpful, feel free to drop a like and leave a comment, I’d love to hear your thoughts!
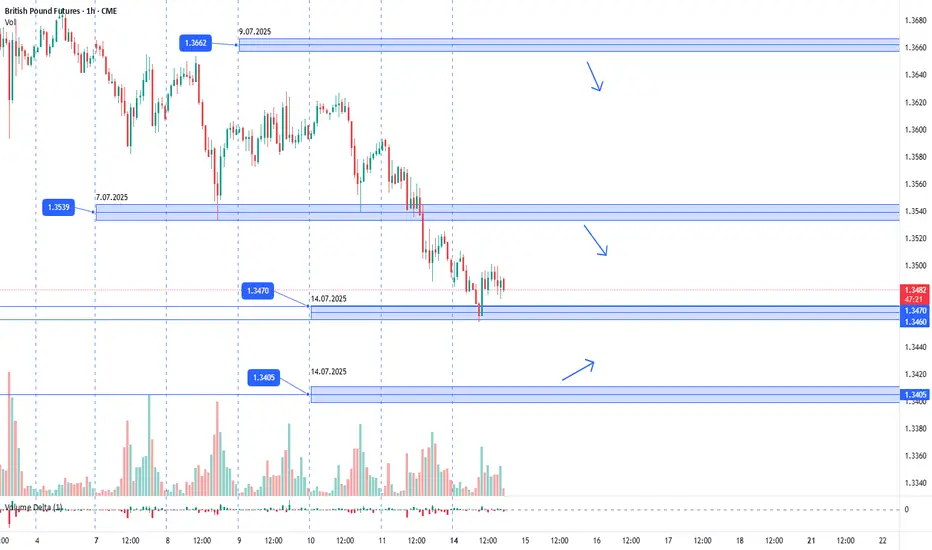
GBPUSD. 14.07.2025. The plan for the next few days.The nearest interesting resistance zone was already worked out in the morning and gave a good reaction. Let's mark the others where we can expect a reaction. It's not certain that there will be a major reversal, but I think we'll see a correction that can be monetized. We're waiting for a reaction and looking for an entry point.
The post will be adjusted based on any changes.
Don't forget to click on the Rocket! =)
Emini Nasdaq 100. Daily Market Walkthrough. Entries & Exits. Explained in depth overview of NQ. What exactly my thought process was in a specific time window

Bitcoin [BTC1!] Draw and Bias. 05.07.25, SaturdayLooking for bullish action on BTC. No stance on alts.

Live Market Walkthrough Emini Nasdaq 100Outlined the orderflow distribution and trading All time highs

Ethereum - ETH - Heading towards the CME Gap - 3200 Target+ After a significant crash, Ethereum has shown a strong recovery.
+ A large CME gap exists between $2,880 and $3,270.
+ Historically, 90% of CME gaps tend to get filled sooner or later.
+ Current price action suggests Ethereum is heading directly toward this gap.
+ High probability that the CME gap will be filled during this move.
+ Next target for ETH: $3,200.
Stay tuned for more updates.
Cheers,
GreenCrypto


CAD Option Flow Positive Sentiment. It's worth taking a closer Based on the analysis of yesterday's trading on CME, we have captured an excellent portfolio in the lens.
The trader methodically formed this position in a 5-minute period of time, which is a good sign.
Сonfirmation - the market is already moving in his direction
But, reasonable entry level - above 0.7339.
Don't rush it. The risk/profit ratio is still at acceptable levels, but it's worth waiting for the resistance to be overcome.


Bitcoin CME Gap June 21thBitcoin has a CME gap at $103.292 . Historically, these gaps tend to get filled and if it happens again, it could mean a short-term move before continuation.

E mini Nasdaq 100. 20.06.2025, Thursday [Day after FOMC]Clean delivery after FOMC. Massive meltdown on NQ.


Nikkei 225. Tokyo Open Delivery cause of Geopolitical DriversSharing my Tokyo Open model for the daily expansion on Nikkei. Along with Intraday market profiles. And Quarterly Theory

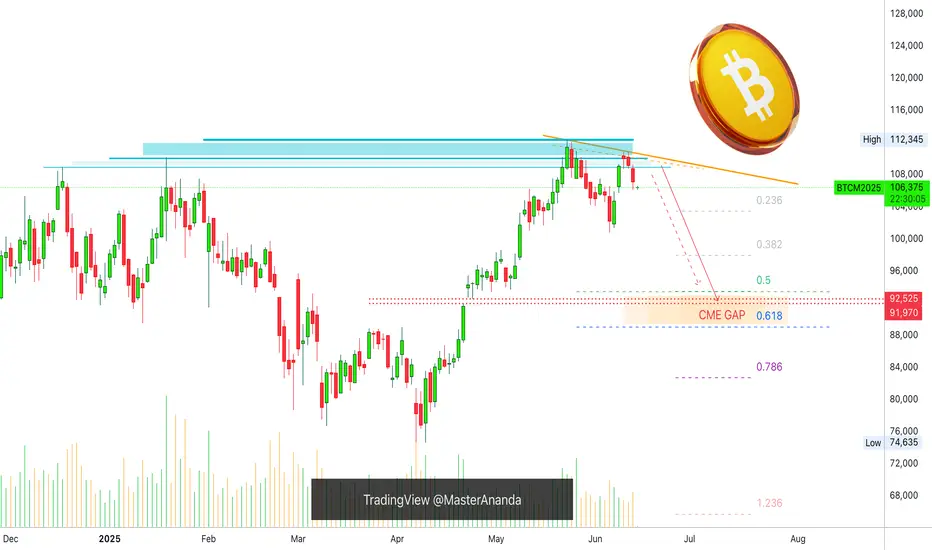
5 Bearish Signals —Bitcoin CME Gap (91,970 - 92,525)Bitcoin's bearish bias is confirmed clearly. Bearish signals are starting to pile up one on top of the other, let's recap those real quick:
1) Bitcoin is trading below its December 2024 high, it's January 2025 peak price and the recent 22-May all-time high. Trading below these levels open the doors for a move downward.
2) Recent lower high. 10-June closed lower compared to 22-May. This is a local lower high.
3) Overall low volume. Total volume decreasing since January 2025. No strong buying activity.
4) Sustained growth. Bitcoin grew straight up for 45 days. It is normal to see a retrace after sustained growth.
5) CME Gap. This is the latest signal that came to my attention and this gives further strength to the bearish case. The GAP sits between $91,970 and $92,525.
It is likely that Bitcoin will move lower before producing a new all-time high. Bitcoin is not likely to move below 80K. This is very unlikely.
Most likely Bitcoin will find support above 90K and if it moves below 90K this might be a brief occurrence lasting only a few hours or a few days at max. When all is set and done, we will continue to see long-term growth based on a bullish structure of higher highs and higher lows. The 7-April bottom will remain untouched.
Namaste.
Emini Nasdaq 100. CPI. 11.06.2025, WednesdayExpecting major meltdown on the daily. The triad should melt from here on

ES Futures-Weekly OutlookCME_MINI:ES1!
Fundamentals and Economic Calendar
Data Recap:
• Friday: 06/06/2025
o US Non-Farm Payrolls (May) 139k vs. Exp. 130k (Prev. 177k, Rev. 147k)
o US Unemployment Rate (May) 4.2% vs. Exp. 4.2% (Prev. 4.2%)
o US Average Earnings YY (May) 3.9% vs. Exp. 3.7% (Prev. 3.8%, Rev. 3.9%)
• Overnight Monday: 06/09/2025
o Chinese Trade Balance (USD)(May) 103.22B vs. Exp. 101.3B (Prev. 96.18B)
o Chinese Exports YY (USD)(May) 4.8% vs. Exp. 5.0% (Prev. 8.1%)
o Chinese Imports YY (USD)(May) -3.4% vs. Exp. -0.9% (Prev. -0.2%)
o Chinese CPI MM (May) -0.2% vs. Exp. -0.2% (Prev. 0.1%)
o Chinese PPI YY (May) -3.3% vs. Exp. -3.2% (Prev. -2.7%)
o Chinese CPI YY (May) -0.1% vs. Exp. -0.2% (Prev. -0.1%)
Looking ahead this week on the calendar, notable economic data releases are as follows:
• Wednesday: 06/11/2025
o US CPI YoY (May)
o US CPI MoM (May)
o US 10 year Note Auction
• Thursday: 06/12/2025
o US PPI MoM (May)
o US PPI YoY (May)
o US 30 year Bond Auction
• Friday: 06/13/2025
o Michigan Consumer Sentiment (Jun)P
o Michigan 1-year and 5-year Inflation Expectations (Jun)P
On the trade and tariff front, we have China-US trade talks continuing in the UK today. The Chinese Vice Premier is visiting the UK from June 8th-13th.
There has been progress made which is visible in terms of China relaxing export controls on rare earth minerals and President Trump stating that they are very far advanced on the China deal ahead of high level talks in London today.
The FED is in a blackout period until the FOMC meeting. Trade, tariffs, and geopolitical risks still need to be monitored.
Technical:
What has the market done?
With NQ leading, ES has also reclaimed yearly open. It held above yearly open in the overnight session.
What is it trying to do?
Climb higher, overlapping bars and yearly VPOC shifting higher denote acceptance at higher prices.
How good of a job is it doing?
Overlapping bars, headline risks and leveraged positions also point towards potential for prices moving lower before resuming higher or remaining range bound. TACO acronym traders may be in for max pain.
What is more likely to happen from here?
Given the data above, we would iterate given our previous explanation that recent data including CPI, PPI, Trade imports, exports is skewed due to trade tensions and this being reflected in business and consumer behavior. FED is likely to remain on hold while it waits and averages out the impact on growth, inflation and labor market.
Scenario 1: Push higher
Prices continue to push higher, if CPI comes in lower than expected, this may prompt a short-term continuation higher.
Scenario 2: Range bound
Markets remain in wait and see mode this week having climbed above yearly open. Markets build value higher and we expect VPOC to shift higher too.
Scenario 3: Sell-off
A mix of factors could e.g., trade talks stalling, weaker than expected US 10 year and 30 year auctions could foreshadow cracks appearing in the bonds market. This may fuel a wider sell-off if yields climb back higher.
Glossary:
ES - emini-S&P 500 Futures
NQ - emini-NASDAQ 100 Futures
VPOC - Volume Point of Control: The most traded price by volume in a given range. Represents acceptance or consensus

Emini Nasdaq 100 Weekly Outlook and Walkthrough. Outlined the orderflow and my thought process on Daily profiles and expansion days. Marked out my thought process. And how I would execute in that very specific moment. One of my best examples. Go ahead check it out.

Crude. Daily Internal to External Range Liquidity. 06.06.25Covering the crude expansion from daily internal towards the first external range liquidity

Gold NFP delivery. Thursday High Of The Week Market ProfileCovering Gold orderflow on thursday and NFP friday with proper reasoning.

GOLD 05.06,2025, Thursday. Day before NFPCovering my all star model. The criteria the setup the thought process and the narrative behind this model.

Gold 01.06.2025, SundayExpecting bullish price delivery on gold to make a All Time Highs. Before the meltdown on the quarterly Fair Value Gap

NQ Daily Orderflow, MMXM swing points Market Efficiency ParadigmDaily orderflow on NQ. How it formed why it formed. Using Internal Liquidity and sub Internal Liquidity
