COAI - BOTTOMED? $COAI - update:
Luckily I closed my position with huge gains on the previous pump around 0.9500$ (35% up) ✅💰
I think it's time to load another bag around the 0.7500 - 0.7600$ retest. 📈
Again, it's a very risky asstet to be traded. #DYOR before investing.
Lower supports: 0.7300 - 0.700 - 0.6600$
Coai

COAI - ITS TIME?? $COAI - It's TIME ?? 🚀🚀🚀
🟩YES
🟥NO
IF THIS ONE TOUCH 2.00$ before tomorrow, I'll give 50$ to one lucky winner who comment, like & share! 📈🎁

COAI - IS BOTTOM IN ?? Volume increasing on #COAI & setup I gave this morning played well with a 20%+ bull increase from the low! 📈
Following the same plan, I think that the bottom could be in if 0.786 fib act as bottom & retest (1.3200$).
Therefore, bulls could push prices toward 1.80$+ from here next! 🚀 (or even much higher, if we catch the monthly low & whales join the party again... here after a 90%+ retracement!)
I took 140% profits, I'll buy again this dip :) (x10)
Chart structure looks much safer.
Let's see! 👀
Just sharing a possible bottom here!
Not a financial advice team! Huge volatility! #DYOR

COAI Buy/Long Setup (2H)First of all, you should know that this is a highly volatile and risky asset, so you need to enter the position in a way that if it hits the stop loss, you only lose about 1–2% of your capital, or even less | so manage your risk carefully.
The marked entry zones are considered strong supports for this coin, which could potentially lead to good profits. You should enter in spot, as this coin has wide zones.
Targets are shown on the chart.
For risk management, please don't forget stop loss and capital management
When we reach the first target, save some profit and then change the stop to entry
Comment if you have any questions
Thank You

COAI - BEARISH$COAI - update:
Honestly price manipulation on this asset is just absurd!
How can it still be listed on major CEX??
The current trend remain pretty bearish, with a clean downtrend channel H1📉
I don't think that the bottom is in yet.
Key support i'm watching as potential bottom before bull reversal:
2.00 - 2.10$ 🎯
1.720 - 1.680$ 🎯
Short term PA is very volatily.
Best to day is keeping an eye on the channel trends.
#DYOR #COAI

COAIUSDT.P - October 29, 2025The chart exhibits a strong bearish trend with sustained lower highs and lows, indicating continued downside momentum. Expecting potential continuation toward the lower target near $0.01 — I am basically shorting this until it loses 99% of its market cap.

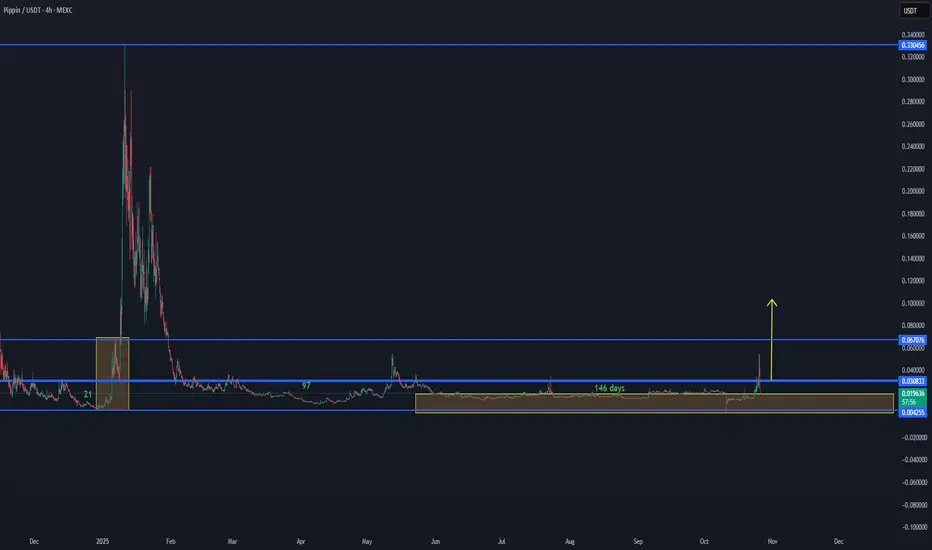
PIPPIN:USDT Market Outlook – Volume Range Formation💠 PIPPIN:USDT Market Outlook – Volume Range Formation
PIPPIN:USDT is showing early signs of new volume activation after an extended 146-day accumulation period within the lower range between 0.0042 – 0.0308 USDT.
This current setup indicates a potential volume range development, similar to the previous expansion phase observed earlier in the chart.
If momentum continues to build and volume sustains, the next major resistance zone sits around 0.067 USDT, followed by a broader target area toward 0.33 USDT on higher timeframes.
At this stage, stability above 0.018–0.020 USDT would confirm the base structure and strengthen the bullish outlook.
📊 Summary:
Range support: 0.0042 – 0.018 USDT
Key activation zone: 0.018–0.030 USDT
Target zones: 0.067 → 0.33 USDT
Structure: Accumulation → Early volume build-up
🔎 Focus: Watching for continuation of volume inflow and break above 0.0308 USDT to confirm next phase expansion.
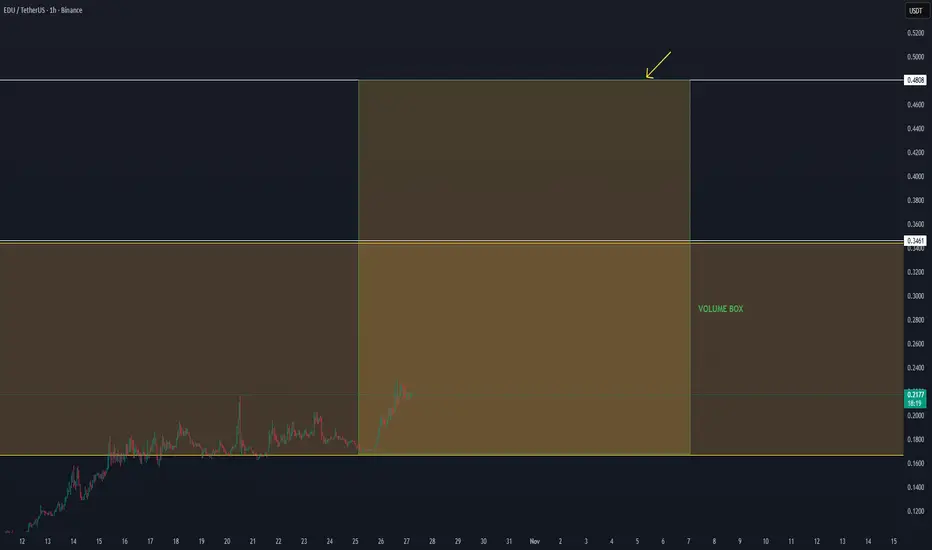
EDU/USDT – Volume Expansion Setup🔹 EDU/USDT – Volume Expansion Setup
EDU continues to show strong structure after the last move up, holding steady inside the volume box. The pair is building momentum with consistent volume increase on the lower time frames, showing clear accumulation signals.
If the current structure remains stable, EDU can continue this short-term uptrend and target the next resistance zone around $0.48, where the main reaction level is expected.
We follow the data and volume development closely — as long as the price stays supported inside the box, the momentum remains valid for a potential breakout continuation toward the upper range.
PIPPIN/USDT — Path Toward $0.50 with 500M Market Cap PotentialPIPPIN/USDT — Path Toward $0.50 with 500M Market Cap Potential 🚀
PIPPIN is currently showing early structural strength after a long accumulation phase.
Based on current supply metrics and market behavior, a 500M market cap could push the price toward the $0.50 zone, representing a major expansion phase from current levels.
📊 Market Structure Overview:
Current base forming near $0.028
Next psychological and technical targets at $0.33 → $0.50
The $0.50 region aligns with ~500M market cap potential
If momentum continues building, PIPPIN could be entering a stage where new capital inflows drive a high-multiple move, similar to its previous historical run.
💡 Observation: The chart shows similar accumulation and volume buildup patterns seen before large runs — a breakout could mark the start of a new growth cycle.
📈 Outlook: Bullish scenario toward $0.50
🎯 Market Cap Target: 500M

$COAI — market maker in full control🎯 When a market maker has a goal — no market sentiment can stop him.
💥 The price of $COAI has almost been “pushed” to its all-time high around $20, while the project’s market cap has already climbed to nearly $4B.
A lot or not — for such a “young” project? 🤔
📈 What’s more, arbitrage traders are adding fuel to the fire — with a funding rate of -1.5%/h, short sellers are literally paying long holders to stay in position.
That creates a chain reaction: short liquidations → less liquidity → another price spike 🚀
⚠️ But once the market maker reaches his target — this could all end suddenly.
The market’s emotional right now, so stay alert.
💡 Some even speculate that similar moves might be repeated on other freshly listed tokens.
What do you think — could that happen again?
Drop your thoughts in the comments and we will analysis this coins 👇
______________
◆ Follow us ❤️ for daily crypto insights & updates!
🚀 Don’t miss out on important market moves
🧠 DYOR | This is not financial advice, just thinking out loud.

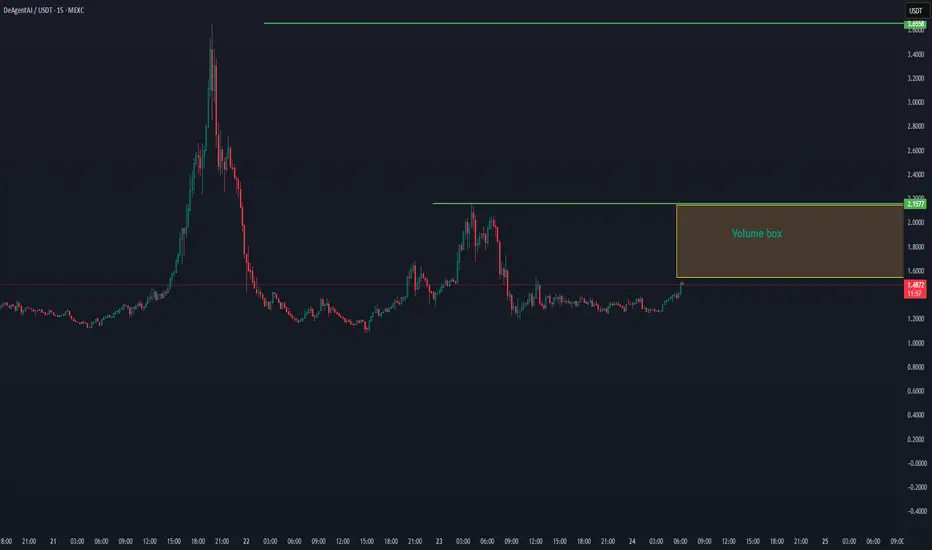
AIA/USDT — Volume Box Forming, Potential Expansion TowardAIA/USDT — Volume Box Forming, Potential Expansion Toward $2.15 🚀
DeAgentAI (AIA) is showing renewed strength after a long consolidation phase, with price now building momentum toward the $1.50–$1.60 zone. The chart highlights a volume box area between $1.50–$2.15, which often acts as a liquidity build-up zone before a strong breakout move.
If AIA confirms continuation inside this range and breaks above $2.15, it could trigger a high-volume expansion, potentially opening a path toward higher time-frame targets.
📊 Technical Overview:
Support Zone: $1.40 – $1.50
Volume Box Range: $1.50 – $2.15
Breakout Level: $2.15
Bias: Accumulation → Bullish
AIA’s structure remains constructive as long as it maintains above the lower range. Watch for volume confirmation near $2.00+ for signs of strong trend continuation.
📈 Outlook: Range buildup with breakout potential
🎯 Targets: $2.15 → $2.80
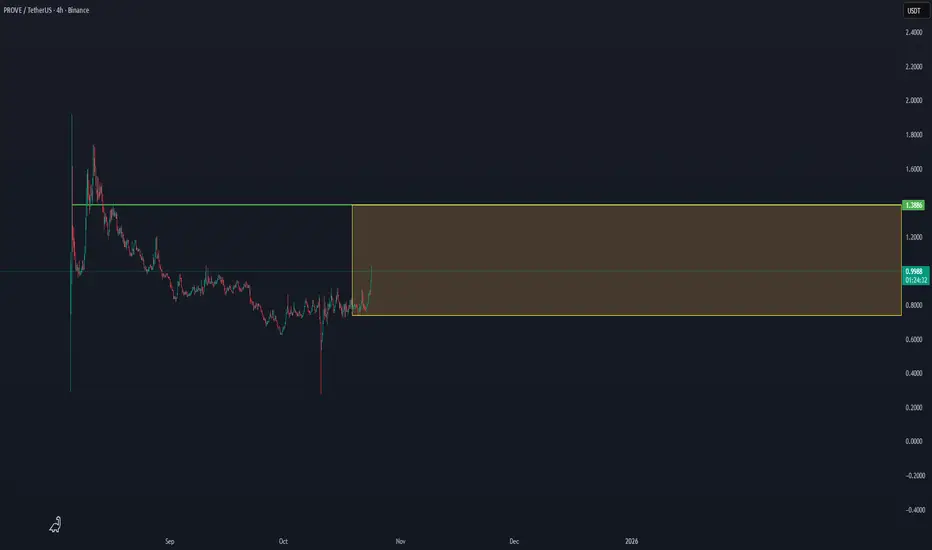
PROVE/USDT — Volume Range Expansion Forming, Eyeing $1.38 PROVE/USDT — Volume Range Expansion Forming, Eyeing $1.38 Breakout 🚀
Prove Network (PROVE) is gaining momentum after a long accumulation phase, now trading near the mid-point of its volume box between $0.74 – $1.38.
This structure indicates a potential accumulation-to-expansion pattern, where sustained buying pressure could push the price toward the upper boundary of the range.
If PROVE confirms a close above $1.38, it would likely initiate a strong breakout continuation, supported by previous high-volume reactions around that zone.
📊 Technical Overview:
Support Zone: $0.74
Range Mid-Level: $0.99
Breakout Level: $1.38
Bias: Accumulation → Bullish continuation
Volume is gradually building, suggesting that buyers are re-entering the market, and the breakout confirmation at $1.38 could trigger a rapid move toward the next major resistance area.
📈 Outlook: Range expansion setup
🎯 Targets: $1.38 → $1.80
COAI Price Rallies 96%— Yet Rug Pull Warnings Surface, Why?COAI’s 96% rally in a single day would normally be viewed as bullish momentum. Yet, in this case, the rapid climb may signal speculative excess rather than genuine growth. The speed of the rise is amplifying concerns about the sustainability of its valuation.
The concentration of supply and inflated demand indicate that COAI could face a steep correction. If selling pressure emerges, the price could drop from $16 to $5 almost instantly, erasing most of the recent gains.
Conversely, if the top wallets refrain from offloading their holdings, COAI could extend its rally beyond $21. Sustained confidence could even push the token toward its all-time high of $48, though the risk of collapse remains significant.

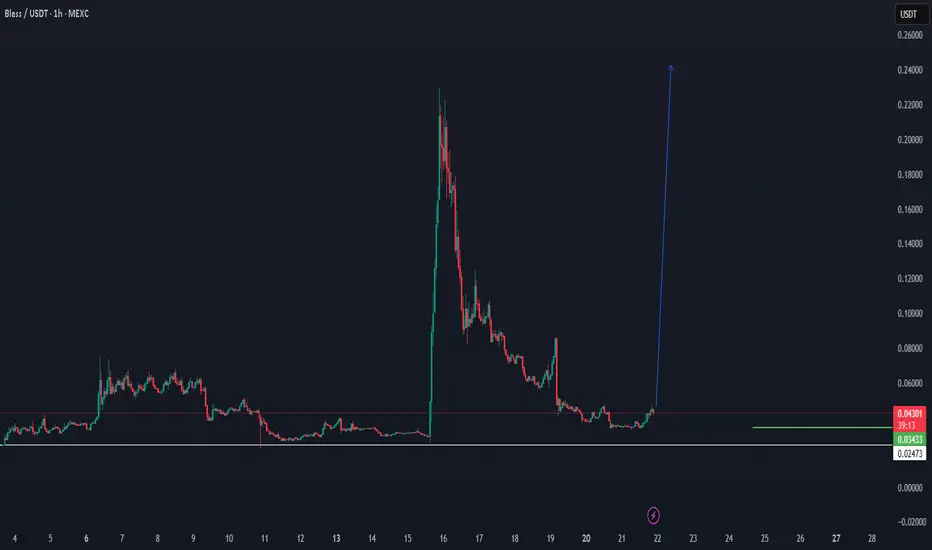
BLESS CAN DO IT AGAIN.. BACK TO $0,20+We following Bless from this bottom trend, with the expecting that it can return again with new wave, it can take some time, but the high chance is there depending on data.
$COAI – Bullish Reversal in Play?ChainOpera AI ($COAI) is redefining how artificial intelligence meets blockchain — delivering seamless, secure smart contract execution powered by AI-driven infrastructure. As the crypto market leans deeper into the AI narrative, COAI stands out as a frontrunner blending intelligence with decentralization.
The team behind ChainOpera_AI is building an AI-driven foundation for decentralized computation and synthetic agents — a true next-gen leap for Web3.
TECHNICAL OUTLOOK:
ChainOpera AI is flashing a bullish reversal setup on the 2-hour chart.
After rebounding from the $4.40 demand zone, the price shows potential for a retest toward the $9–$10.5 range.
If we get a rejection at that level, the price could retrace back toward the $4–$2 area.

MEMECORE/USDT — Range Recovery Forming, Watching Higher levelsMEMECORE has shown a steady rebound from the lower range near $2.00, regaining short-term momentum as it attempts to reclaim the $2.34 zone, which has acted as a strong resistance multiple times.
A confirmed breakout above $2.34 would signal a shift in momentum and open the path toward the range high at $2.53, where the next major liquidity zone sits.
📊 Technical Overview:
Range Support: $2.00
Range Resistance: $2.34
Breakout Target: $2.53
Bias: Neutral → Bullish above $2.34
If MEMECORE continues to hold above the $2.00 base with rising volume, the structure suggests potential for a range breakout and short-term trend reversal.
📈 Outlook: Building strength inside range
🎯 Targets: $2.34 → $2.53

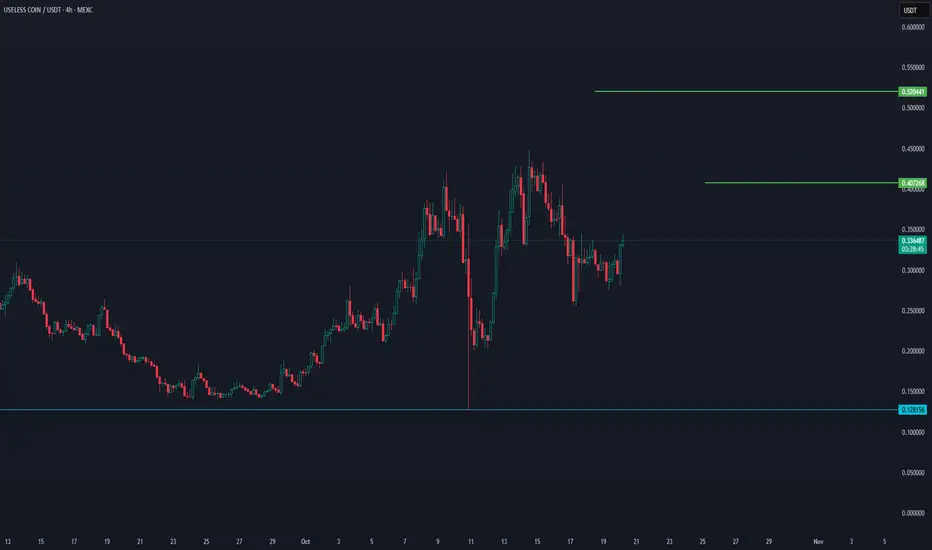
Useless Coin (USDT Pair) – 4H Chart Update📊 Useless Coin (USDT Pair) – 4H Chart Update
Current Price: $0.3424
Change (Last 4H): +3.6%
Volume: 456K
The price is currently attempting to recover from a recent downtrend, showing some short-term strength as it moves upward from the local support area.
🔹 Support Level: $0.128 – This remains the key bottom support and has held firmly in the previous correction.
🔹 Immediate Resistance: $0.407 – This is the first resistance to watch; a confirmed breakout above could trigger further bullish momentum.
🔹 Next Target Zone: $0.520 – This would be the next major resistance area if volume continues building and the current trend holds.
Market Structure:
The structure is neutral to slightly bullish — the market is forming higher lows, suggesting buyers are gradually stepping in.
However, there is still a lack of strong follow-through volume, which means the uptrend is not yet confirmed.
Summary:
Useless Coin shows early signs of a potential recovery with higher lows forming, but it remains in a consolidation phase. A close above $0.407 on strong volume would confirm a short-term bullish continuation toward the $0.52 level. Failure to hold above $0.30 could reopen the downside toward $0.20 or even $0.128.
KMNO HOLDING THE MAIN TREND ON WAY TO NEW LEVEL..KMNO is still holding the important Maintrend, as long as this coin continues to do this, there is a high chance it will get a new increase in volume in the coming time frames.

KMNO/USDT — Bullish Momentum Building Toward $0.10 Breakout KMNO/USDT — Bullish Momentum Building Toward $0.10 Breakout 🚀
KMNO is showing renewed strength after holding its key support zone and forming a steady higher low structure. The current move suggests a shift in momentum, with buyers stepping back in around the $0.066 level.
If KMNO can maintain this recovery and close firmly above the $0.070 zone, the next target area sits around $0.103, marking a potential breakout level for continuation.
📊 Technical Overview:
Support: $0.029 – $0.066
Resistance / Target: $0.103
Momentum: Bullish shift forming on 1H
A confirmed break above $0.070–$0.075 could open space for a strong upward move, with the $0.10 zone as the main focus area in the coming sessions.
📈 Bias: Bullish setup
🎯 Targets: $0.085 → $0.103

COAI — the most manipulated coin on the market
Pair: COAIUSDT.P (perps)
Bias: Short (tactical)
Thesis TL;DR: Timeline is flashing classic manipulation tells—crowded leverage, public pleas to delist, an “unknown wallet” repeatedly selling into rips, and whipsaw liquidations both sides. I’m fading spikes into prior ATH supply with tight invalidation and scale-out targets.
Why this is a “manipulation” setup (from social timeline)
Open manipulation meme: “PAWNZI” label and multiple posts calling COAI a casino-like gamble.
Crowded leverage: Repeated notes of huge liquidations on both sides and a callout that a mass liquidation triggers near $5.83 if price nukes.
Smart seller behavior: “Unknown wallet” reportedly sells repeatedly into strength, trapping late buyers.
Public escalation: Users tagging @CZ_Binance and demanding review/delist for “price manipulation.”
Behavioral fuel: Screenshots of 292x PnL and regret posts (airdrops sold “too early” → FOMO) stoke late momentum buyers—perfect exit liquidity.
Failed short triggers: Traders trying to frontrun the short got chopped/stopped BE multiple times—signals engineered liquidity hunts before the real move.
Levels I care about
Short interest zone: $6.90–$7.20 (prior ATH pocket / squeeze fuel). Expect wicks.
Momentum pivot: $6.50 — loss/reclaim flips intraday bias.
Liquidation magnet: $5.83 (widely-circulated “mass liq” level = honey pot).
Deeper shelves: $5.60 and $5.20 — prior reaction zones where trapped longs may puke.
Trade plan (short bias)
Entry: Scale $6.90 → $7.20 on spikes; add on 15–60m structure breakdown below $6.50.
Invalidation: 4H close > $7.50 (acceptance above prior high = out, no debate).
Targets:
T1: $6.10 (first shelf; take partials, pay yourself)
T2: $5.83 (liquidation cluster—expect violent reaction)
T3: $5.60 → stretch to $5.20 if momentum accelerates
Risk: Size so that full-stop loss = ~1% account risk. If we wick >$7.35 and snap back in-range, I’ll re-engage with smaller size.
Execution notes:
Expect engineered squeezes before any trend. Let price tag your zone—don’t chase.
If $6.90 is reclaimed after a breakdown, reduce risk—possible bear trap/reset.
Watch perp funding/OI — extreme positive funding into resistance = better fade.
Narrative context (why fade)
The public narrative is doing the heavy lifting: casino vibes, “unknown wallet” selling into pumps, and open calls for Binance action.
Retail euphoria (292x screenshots, airdrop regret posts) provides late long fuel.
If the crowd is staring at $5.83 as the “big liq,” market often hunts it—either as a clean flush or a spoofed front-run to trap shorts. I’ll manage partials proactively there.

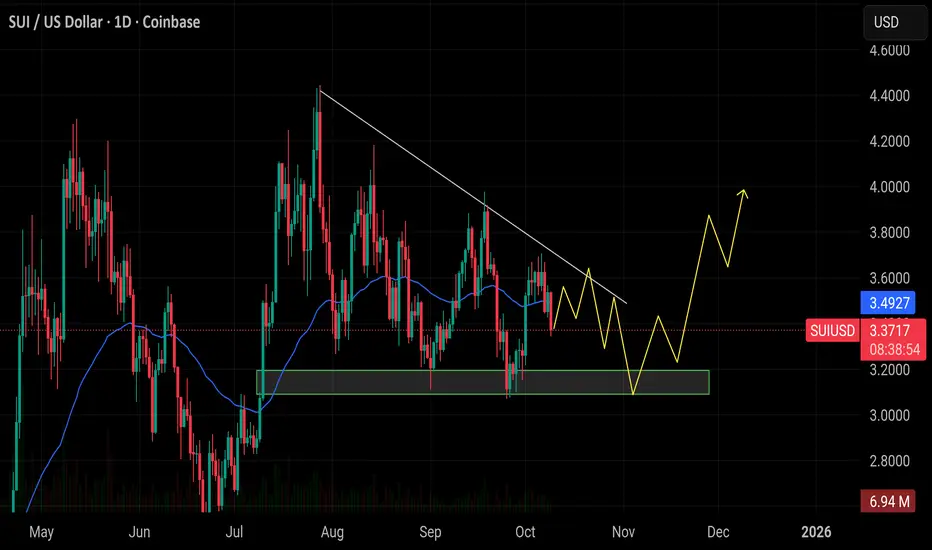
$SUI is forming a bullish structure on the daily chartCRYPTOCAP:SUI is forming a bullish structure on the daily chart, consolidating near support around $3.1. A breakout above the descending trendline could trigger a move toward the $4 zone.
COAI DID ONE OF THE BEST INCREASES - NEXT ONE AVL:USDTChainOpera AI (AI/USDT) — From Our First Scan to Explosive Gains 🚀
We first scanned ChainOpera AI at just $0.38, and since then it has delivered an incredible surge, reaching new highs above $4.00+ — a massive performance move backed by strong momentum and trend continuation.
📈 Our First Scan: $0.38
💥 Current Levels: $4.32
🔥 Gain: +1000%+
The same technical setup and market structure now appear to be forming on AVL/USDT, showing early signs of accumulation and breakout potential similar to what ChainOpera AI showed before its explosive run.

THE LAST ALV CHART: Binance + Burning the Key — 2025 Will Be ...ALV/USDT Final Chart — The Golden Setup for 2025
After consistent daily updates, this could be the final and most powerful ALV chart leading into 2025.
There’s a strong probability that ALV will target $0.50 on its way toward a $1.70 high in 2025.
As long as the price remains well above the secure zone around $0.11, ALV stays technically bullish and positioned for another breakout — whether early or late in the next cycle. The setup is now confirmed for a solid swing trade into 2025.
There’s also growing speculation that Binance may list ALV, especially following the surge in Binance Alpha volume. Combined with the potential for the team to burn more token supply, the technicals and fundamentals align perfectly — making ALV one of the most promising breakout candidates for 2025.
🔥 ALV could truly be the golden chart of the year.
