Coca-Cola (KO) Pullback Trade Aligns With Trend Strength!🔥 KO Playbook: Bullish Pullback Trap or Clean Rebound? 🥤📈
📌 Asset
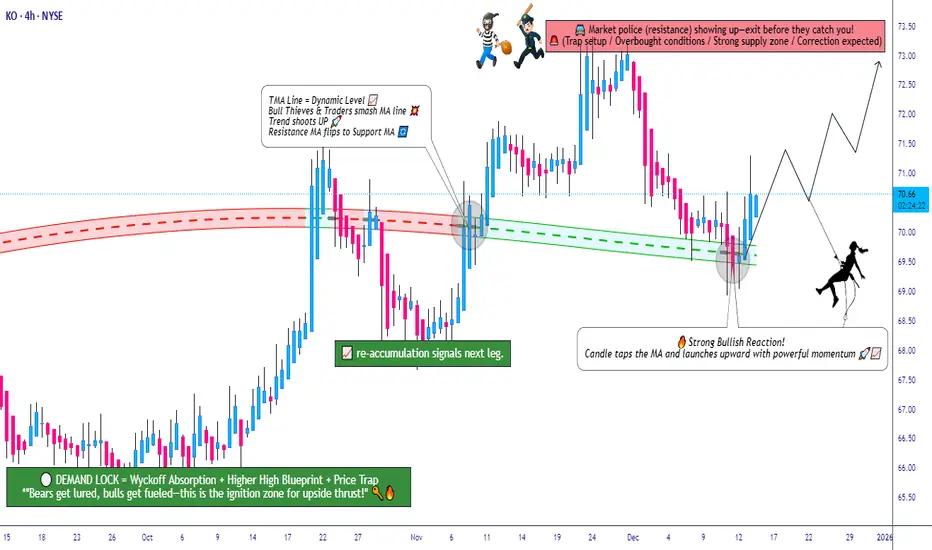
NYSE:KO — The Coca-Cola Company
NYSE | Stock Market Profit Playbook
Style: Swing Trade / Day Trade
🧠 Market Structure & Technical Thesis
KO is currently showing a Bullish Pullback Setup after a healthy retracement into a Triangular Moving Average (TMA) zone, indicating potential mean-reversion and continuation strength.
Key technical factors supporting the bullish bias:
📐 Price pulling back into TMA dynamic support
📉 Controlled retracement (no breakdown structure)
🧲 Liquidity resting below current price (ideal for layered entries)
📊 Context supports a buy-the-dip strategy, not a chase
🎯 Trade Plan — Thief Style (Layered Entry Method) 🕵️♂️
🟢 Entry Strategy (Layering Method)
This plan uses a multiple buy-limit layering strategy, also known as scale-in entries, to reduce average cost and manage volatility.
Buy Limit Layers (Example):
🟢 70.00
🟢 69.50
🟢 69.00
👉 You may increase or adjust the number of limit layers based on your own risk management and execution style.
👉 Aggressive traders may also choose any price level entry, depending on confirmation.
🛑 Stop Loss (Risk Control)
Thief SL Reference: 68.00
⚠️ Note:
Dear Ladies & Gentleman (Thief OG’s),
I am not recommending you to use only my Stop Loss. Risk management is a personal choice — protect capital and trade responsibly.
🎯 Target / Exit Zone
Primary Target: 73.00
🚨 Why this level matters:
🚓 “Police force” zone = Strong resistance area
📈 Price likely to be overbought near this zone
Potential bull trap or profit-taking zone
👉 Kindly escape with profits if price reaches this level.
⚠️ Note:
Dear Ladies & Gentleman (Thief OG’s),
I am not recommending you to use only my Take Profit. Secure gains based on your own plan and comfort level.
🔍 Related Stocks to Watch (Correlation Insight)
NASDAQ:PEP (PepsiCo Inc.) 🥤
👉 Strong sector correlation with KO. Bullish continuation in PEP often supports upside momentum in KO.
AMEX:SPY (S&P 500 ETF) 📊
👉 Overall market strength matters. A bullish SPY environment increases follow-through probability for defensive stocks like KO.
AMEX:XLP (Consumer Staples ETF) 🛒
👉 If XLP holds support or trends higher, KO usually benefits as a sector leader.
💡 FINAL THOUGHTS FROM YOUR TRADER
This isn't a "set and forget" trade—it's an active, discipline-required play. The setup is clean, the technicals are aligned, but markets always have surprises.
The margin of safety exists at these levels. But margin of safety ≠ guaranteed profit. Ever.
Trade with conviction but manage risk like a pro. 🚀
📲 COMMUNITY APPRECIATION
✨ If you find value in my analysis, a 👍 and 🚀 boost is much appreciated — it helps me share more setups with the community!
Happy Trading, Legends! 🚀💰 Chart your own path. The market rewards the prepared mind. 📊
Cocacolasignals
Coca Cola Are We Making New Highs or Dropping to $52 Good evening Trading Family
So here is the analysis if we can hold above 67.20 then we can see new highs being created all the way up to 80 dollars or higher.
However if we break below 67.20 we can see the market deeply correct back down to possibly as low as 52 levels.
Stay Sharp and follow the trend not your ego
Kris/ Mindbloome Trading

COCA COLA preparing a final rally to $62.00The Coca-Cola Company (KO) is trading within the 1D MA200 (orange trend-line) and 1D MA50 (blue trend-line) following the October 06 market bottom, the lowest level it's been since March 25 2021. This rally since the bottom is technically the (e) - (f) bullish wave of the symmetrical pattern that the stock traded in from April 25 2022 to December 14 2022. Both are Bearish Megaphone patterns with underlying common characteristic, the Lower Highs Zone, which effectively keeps KO still within the Bear Cycle that started on the April 25 2022 All Time High (ATH).
With the 1D RSI backing up the pragmatic correlation that the wave-length has one more extension to give, we remain bullish on Coca-Cola, targeting $62.00, which is marginally below both the bottom of the Lower Highs zone as well as the 0.936 Fibonacci retracement level, which is the symmetrical level where the December 14 2022 Lower High was priced at.
-------------------------------------------------------------------------------
** Please LIKE 👍, FOLLOW ✅, SHARE 🙌 and COMMENT ✍ if you enjoy this idea! Also share your ideas and charts in the comments section below! This is best way to keep it relevant, support us, keep the content here free and allow the idea to reach as many people as possible. **
-------------------------------------------------------------------------------
💸💸💸💸💸💸
👇 👇 👇 👇 👇 👇

Coca-Cola fall back to 1.618Coca-Cola fall back to 1.618
This chart shows the weekly candle chart of Coca Cola Company's stock from the end of 2019 to the present. The graph overlays the bottom to top golden section at the beginning of 2020. As shown in the figure, after peaking at the end of April 2022, the stock of Coca Cola Company broke out of the large triangle fluctuation and consolidation trend. In October 2022, after stepping back on the bottom of the graph to the top of the golden section at 1.382, it also broke out of the triple shoulder position of the head, shoulder, and top! At present, Coca Cola's stock has fallen back to the bottom of the chart, which is 1.618 on the golden section. In the future, this position will serve as the watershed for judging its strength!

COCA-COLA Rejected and pulling-backThe Coca-Cola Company (KO) got rejected on the Lower Highs trend-line cluster of April May and is pulling-back. A test of the 1D MA50 (blue trend-line) while forming a 1D Golden Cross with the 1D MA200 (orange trend-line) would be very healthy for the long-term growth of the stock, which is perfectly trading on a Fibonacci Channel Up.
The 1W RSI also got rejected on its own late February Lower Highs trend-line, so a weekly candle close below the 1D MA50 can kick-start further selling towards Fibonacci 0.5, even 0.0 (bottom of the Channel).
Until that happens though, the pull-back should be bought, targeting the 1.5 Fib and by Q3 2023 the 2.0 Fib.
-------------------------------------------------------------------------------
** Please LIKE 👍, SUBSCRIBE ✅, SHARE 🙌 and COMMENT ✍ if you enjoy this idea! Also share your ideas and charts in the comments section below! This is best way to keep it relevant, support me, keep the content here free and allow the idea to reach as many people as possible. **
-------------------------------------------------------------------------------
You may also TELL ME 🙋♀️🙋♂️ in the comments section which symbol you want me to analyze next and on which time-frame. The one with the most posts will be published tomorrow! 👏🎁
-------------------------------------------------------------------------------
💸💸💸💸💸💸
👇 👇 👇 👇 👇 👇

KO Coca-Cola Buy Now !!!According to my chart analysis , KO Coca-Cola Show strong signal to buy , buy max as you can .

COCA-COLA showing strength but needs to avoid this fractal.The Coca-Cola Company (KO) has been having an impressive non-stop rally ever since the March 10 low as last week it broke above its yearly High. With the 1D RSI approaching the overbought zone of 70.000, exhaustion for this rally may be close. In fact, it resembles the September - November 2020 sequence, as it just flashed a Red Ichimoku, which on the 2020 sequence was a bearish reversal signal.
If the price fails to break the 1.236 Fibonacci extension, be ready for a pull-back that can reach as low as the 1D MA200 (orange trend-line). On the other hand, a closing above the 1.236 Fib, could deliver a rally extension similar to December 2021 - February 2022, that reached as high as the 2.0 Fib extension. On the current sequence, the 2.0 Fib is around $68.50.
--------------------------------------------------------------------------------------------------------
** Please support this idea with your likes and comments, it is the best way to keep it relevant and support me. **
--------------------------------------------------------------------------------------------------------
