COINBASE entering a brutal Bear Cycle. 1st Stop = $150Coinbase (COIN) has been on a strong decline since its July All Time High (ATH) and right now is within the 1W MA50 (blue trend-line) - 1W MA100 (green trend-line) range. This is similar so far to the correction phases since March 2024 that found a bottom on the Support Zone but more importantly looks identical to the start of the 2022 Bear Cycle.
Based on the latter, after the current 3-wek consolidation is over, the stock should decline more, towards the 0.236 and 0.382 Fibonacci levels. The latter is where the Support Zone is, hence our medium-term Target is $150.00 (marginally above).
If the Support Zone breaks and the market keeps mirroring the 2022 Bear Cycle, we are looking at a brutal sell-off that could be as low as $54.00 (Fib 0.786) and $32.00 (Fib 1.0). Notice that in 2022, the most efficient bottom buy signal was given initially by a massively oversold 1W RSI (nearly 20.00) and finally confirmed by a Higher Lows Bullish Divergence of the same indicator. Use that to time the bottom to your advantage regardless of the price and buy for the next long-term Bull Cycle.
---
** Please LIKE 👍, FOLLOW ✅, SHARE 🙌 and COMMENT ✍ if you enjoy this idea! Also share your ideas and charts in the comments section below! This is best way to keep it relevant, support us, keep the content here free and allow the idea to reach as many people as possible. **
---
💸💸💸💸💸💸
👇 👇 👇 👇 👇 👇
Coinbasesignals

Coinbase Global Inc. Expands 24/7 Altcoin Futures TradingCoinbase Global Inc. (NASDAQ: COIN) is expanding its derivatives business with the introduction of 24/7 altcoin futures beginning December 5. The new lineup will include long-dated, perpetual-style futures for Avalanche, Bitcoin Cash, Cardano, Chainlink, Dogecoin, Hedera, Litecoin, Polkadot, Shiba Inu, Stellar, and SUI. This expansion builds on Coinbase’s existing 24/7 markets for Bitcoin, Ethereum, Solana, and XRP, significantly broadening access for traders seeking diverse crypto exposure.
A Major Expansion of Altcoin Futures
The move signals Coinbase’s commitment to meeting rising demand for round-the-clock crypto trading. By extending futures beyond major assets into popular altcoins, Coinbase strengthens its position as a U.S.-regulated venue offering continuous derivatives access. The newly added assets operate under the same structure as existing futures: perpetual-style mechanics with hourly funding and twice-daily settlement to keep contract pricing closely aligned with spot markets.
Unlike traditional perpetual contracts, Coinbase’s U.S. version carries five-year expirations, blending long-term optionality with the flexibility traders expect from perpetual futures. This hybrid approach appeals to institutions and advanced traders who want exposure without rolling short-dated contracts.
Strategic Positioning in a Competitive Market
With global crypto exchanges competing aggressively in derivatives, Coinbase’s move positions it as a key player offering regulated futures across a wide basket of assets. The expanded lineup enhances liquidity, attracts hedging activity, and deepens Coinbase’s ecosystem ahead of growing institutional interest.
Technical Outlook for COIN
COIN recently retraced sharply from its $444 high, falling toward the $240 support zone, where it currently trades. This level is critical: a breakdown could send price toward the ascending trendline near $170, aligning with the previous higher low.
If either support level holds, the broader bullish trend remains intact. A strong rebound may set COIN on track to retest, and potentially reclaim the $444 high, supported by its expanding derivatives business and improving market sentiment.
Coinbase at Support-Cancels $2B BVNK Deal as It Expands GloballyCoinbase has officially terminated its $2 billion plan to acquire the UK-based stablecoin startup BVNK, ending what could have been one of the biggest acquisitions in the stablecoin industry. The decision, reached during the due diligence phase, was reportedly mutual, though neither company disclosed the reasons behind the collapse.
If completed, the deal would have nearly doubled Stripe’s $1.1 billion Bridge buyout, positioning Coinbase as a dominant player in stablecoin infrastructure. Despite the setback, Coinbase remains aggressive in its global expansion. The exchange recently launched Coinbase Business in Singapore, a platform designed to help startups manage crypto payments, transfers, and treasury operations more efficiently.
In another strategic move, Coinbase announced plans to reincorporate from Delaware to Texas, citing a friendlier and more predictable legal climate. Chief Legal Officer Paul Grewal highlighted that Delaware’s recent legal unpredictability prompted the shift, while Texas offers “efficiency and stability” — critical traits for a company navigating evolving crypto regulations.
Technical Outlook
On the charts, COIN is forming a strong cup-and-handle pattern, signaling bullish continuation potential. Price is currently retesting the $300–$310 support zone, previously a key resistance. A successful hold above this range could trigger the next bullish leg, targeting $440–$450. Volume remains steady, suggesting investor confidence in the broader uptrend.
With the U.S. government nearing resolution of its shutdown and rate cuts anticipated in December, improving liquidity conditions could further boost Coinbase’s stock and crypto-related equities.

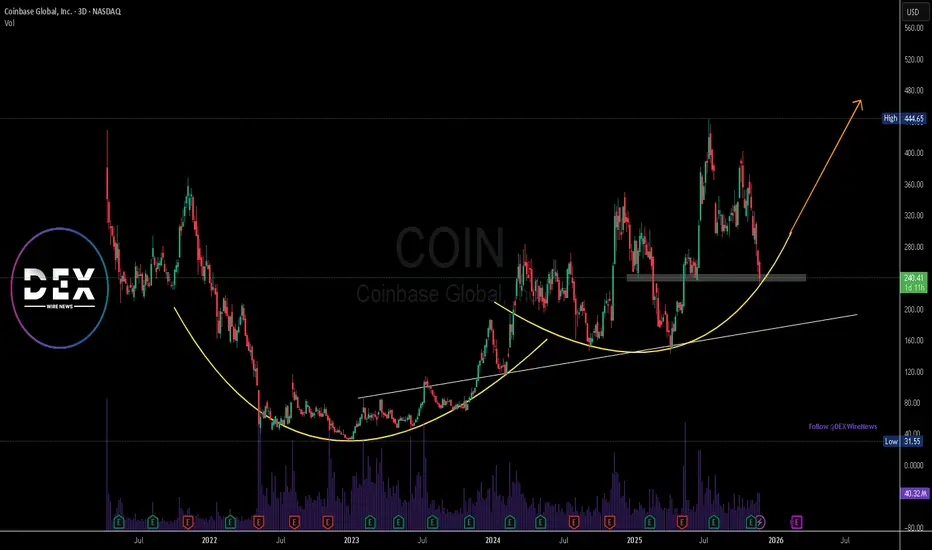
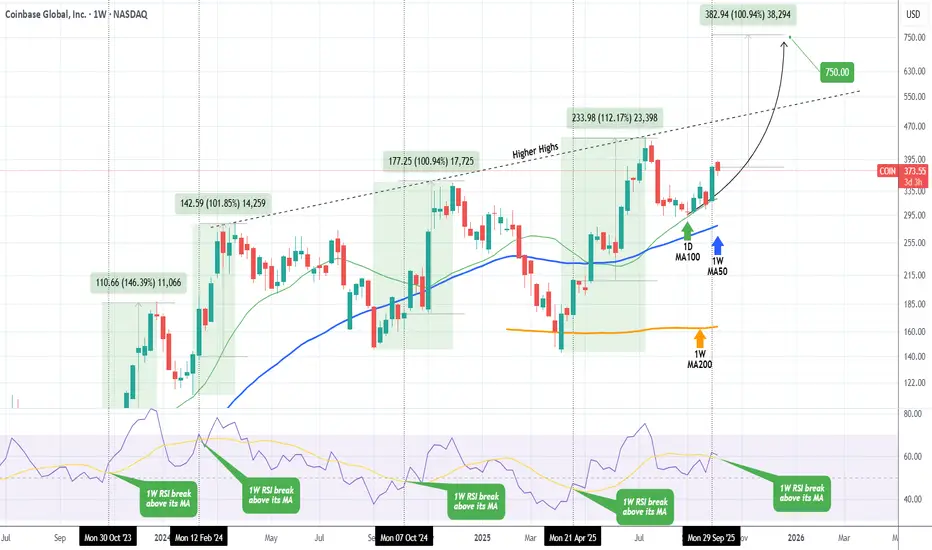
COINBASE Last time it did this, it rallied at least +100%Coinbase (COIN) has set eyes on its Higher Highs trend-line again, the very same structure which we targeted successfully ($400 Target) on our buy signal 5 months ago (May 07, see chart below):
This time we have in our hands perhaps the strongest bullish confirmation signal of this Cycle, the 1W RSI breaking above its MA trend-line. This took place last week and every time Coinbase did this in the past 2 years, it rallied by at least +100%.
If that's repeated, it means the price would target $750, which is however well above the Higher Highs trend-line. A solid strategy would be targeting the Higher Highs trend-line initially and if the price breaks above it and re-tests/ holds it as Support, re-buy and then target $750.
-------------------------------------------------------------------------------
** Please LIKE 👍, FOLLOW ✅, SHARE 🙌 and COMMENT ✍ if you enjoy this idea! Also share your ideas and charts in the comments section below! This is best way to keep it relevant, support us, keep the content here free and allow the idea to reach as many people as possible. **
-------------------------------------------------------------------------------
💸💸💸💸💸💸
👇 👇 👇 👇 👇 👇
Can COIN's $330 Breakout Reach $380? ~ Tactical Entry Plan📈 COINBASE GLOBAL, INC. (COIN) - Money Heist Plan (Swing/Day Trade) 🕵️♂️
🚨 Ready to execute the ultimate heist on COIN? This Money Heist Plan uses the Thief Strategy, a layered limit order approach to catch the breakout at $330.00 ⚡. Below, I've outlined the setup, technicals, fundamentals, and macro insights to help you navigate this trade like a pro. Set your alarms, plan your escape, and let’s dive into the details! 🔒
🛠️ Trade Setup: The Thief Strategy
The Thief Strategy is a tactical approach using multiple limit order layers to enter the trade post-breakout, maximizing flexibility and precision. Here’s how to execute it:
Asset: COINBASE GLOBAL, INC. (COIN) 💰
Entry Trigger: Breakout above $330.00 ⚡
Set a price alert on TradingView to catch the breakout in real-time! 🔔
Layered Entries (Thief Style): Place multiple buy limit orders to scale in:
$310.00
$315.00
$320.00
$325.00
$330.00
Pro Tip: Adjust layers based on your risk tolerance and strategy. Confirm entries only after the breakout at $330.00! ✅
Stop Loss (SL): Place at $295.00 post-breakout 🛑
Note: Adjust SL based on your risk management. The Thief Strategy is flexible—manage risk at your discretion, dear Traders (Thief OGs)! 😎
Take Profit (TP): Target $380.00 🎯
Resistance and overbought levels signal a potential police barricade 🚔. Escape with profits before the trap! Adjust TP based on your strategy.
Disclaimer: TP is not fixed—take profits at your own risk and preference.
📊 Why This Plan? Technical & Fundamental Breakdown
🔍 Technical Analysis: The Thief’s Blueprint
Breakout Catalyst: COIN is testing the $330.00 resistance. A confirmed breakout signals strong bullish momentum 📈.
Thief Strategy Advantage: Layered entries reduce risk of false breakouts and allow scaling into the move.
Key Levels to Watch:
Support: $295.00 (SL zone)
Resistance/Target: $380.00 (overbought zone)
Setup Confirmation: Use volume spikes and RSI for breakout confirmation. Set TradingView alerts to stay sharp! 🔔
📉 Fundamental & Macro Insights
Market Cap: $81.47B
PE Ratio (TTM): 30.52 (above industry avg., signaling high valuation)
EPS (TTM): $10.39
Revenue Growth (YoY): +12.36% (2025 est.) 💪
Profit Margin: 42.67% 🔥
Cash Reserves: $7.54B (strong balance sheet)
Risks:
Q2 profit drop to $33.2M vs. $294.4M YoY 📉
High P/E (30.71) and Price/Sales (12.61) raise valuation concerns
Macro Drivers:
Genius Act: Boosted crypto optimism 🚀
Crypto Market Trends: Bitcoin’s record highs in July 2025 fuel COIN’s upside potential
😰 Fear & Greed Index
Current Sentiment: Neutral to Greedy (Crypto Fear & Greed Index: 0-100)
Trend: Mixed emotions due to crypto volatility and regulatory developments
Takeaway: Greed supports breakout potential, but stay cautious of volatility spikes.
🧠 Investor Sentiment
Retail Traders: Cautiously optimistic 😊, holding for long-term crypto growth but cautious of short-term volatility.
Institutional Traders: Mixed 🤔—some see overvaluation, others bet on crypto adoption and regulatory clarity.
🐂 Bullish vs. Bearish Outlook
Bullish Score: 60% 🐂
Why? Strong revenue growth (+13.72% YoY est. for 2026), crypto adoption, and institutional interest.
Bearish Risks: 40% 🐻
Why? Profit volatility, high valuation, and crypto market dependence.
Key Watch: Q3 earnings (Sep 2025) and crypto market trends.
💡 Why Trade COIN Now?
Short-Term: Neutral to slightly bearish due to profit concerns, but the $330.00 breakout could spark a quick swing/day trade.
Long-Term: Bullish on COIN’s role in crypto infrastructure and regulatory tailwinds.
Thief Strategy Edge: Layered entries and disciplined risk management make this setup ideal for volatile markets.
🔗 Related Pairs to Watch (USD)
BITSTAMP:BTCUSD : Bitcoin’s momentum drives COIN’s price action.
BITSTAMP:ETHUSD : Ethereum’s performance impacts COIN’s trading volume.
BITSTAMP:XRPUSD : Watch for altcoin rallies tied to regulatory news.
AMEX:SPY : Broader market trends influence COIN’s beta (3.69).
📅 Market Data Snapshot (10 Sep 2025)
Previous Close: $318.78
Day’s Range: $315.88 - $328.67
52-Week Range: $142.58 - $444.65
Avg. Volume: 13.43M shares
✨ “If you find value in my analysis, a 👍 and 🚀 boost is much appreciated — it helps me share more setups with the community!”
#TradingView #COIN #SwingTrading #DayTrading #CryptoTrading #TechnicalAnalysis #ThiefStrategy #MoneyHeist

COINBASE HIGH PROBABILITY SETUP SOON!!!🚨 COIN HIGH PROBABILITY BUY SETUP 🚨
* Here We Can See Clearly The Next Potential Move For COIN Coming Hours/Days.
* Keep Your Eyes Close On Your Trading Positions.
* Happy PIP Hunting Traders.
FXKILLA.
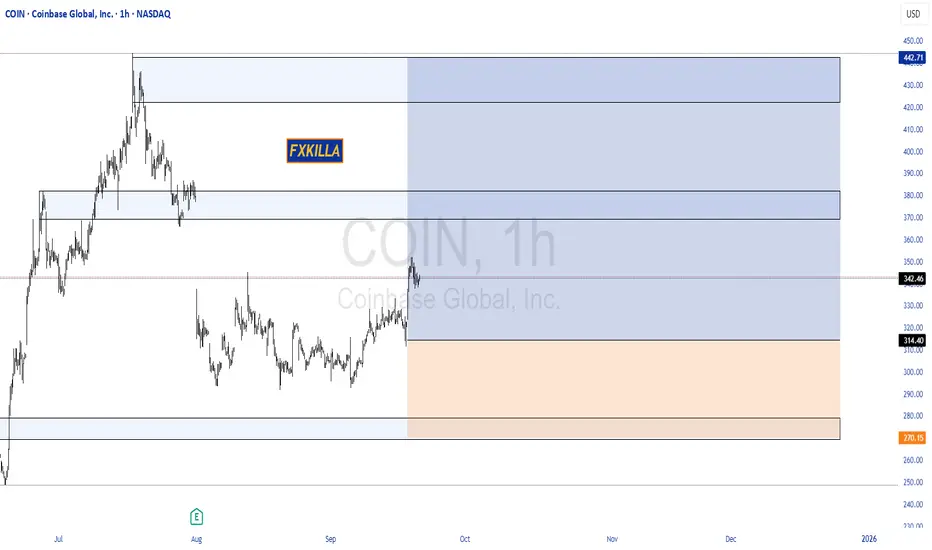
COIN HIGH PROBABILITY SETUP SOON!!!🚨 COIN HIGH PROBABILITY BUY SETUP 🚨
* Here We Can See Clearly The Next Potential Move For COIN Coming Hours/Days.
* Keep Your Eyes Close On Your Trading Positions.
* Happy PIP Hunting Traders.
£ FXKILLA £

COINBASE about to issue a massive buy signal.Last time we looked at Coinbase (COIN) was more than 3 months ago (May 07, see chart below) where we gave a strong buy signal on its 1D MA50 (blue trend-line), which instantly delivered a rally that eventually hit our $400 long-term Target:
The stock has since dropped off its All Time High (ATH) and is trading right now below its 1D MA50 (blue trend-line). The 1D RSI has given perhaps the most optimal Buy Signal when it double bottoms (red and green circles).
At the moment it has made the first Low and we are anticipating the second, which might very well be on the 1D MA200 (orange trend-line). That would be the signal for maximum gains and our Target will be on the Higher Highs trend-line at $450.
-------------------------------------------------------------------------------
** Please LIKE 👍, FOLLOW ✅, SHARE 🙌 and COMMENT ✍ if you enjoy this idea! Also share your ideas and charts in the comments section below! This is best way to keep it relevant, support us, keep the content here free and allow the idea to reach as many people as possible. **
-------------------------------------------------------------------------------
💸💸💸💸💸💸
👇 👇 👇 👇 👇 👇
Are you Bullish on Coinbase?Do you think my T1 will get hit? Let me know.
I hope so, since Coinbase is a leading indicator for the crypto market.
But I wouldn't be surprised if it went lower after hitting T1

Are you bullish on Coinbase?Obviously I want Coinbase to do well, becuase it is a leading indicator for the crypto market.
But it's still a chart, like all other charts, that all do the same thing. So let's hope no further downside is necessary.

COIN Gamma Strom Incoming!!!🚀 COIN Weekly Swing Setup (2025-08-09) 🚀
**Bias:** 📈 **Modestly Bullish** — strong call flow + low VIX, but weak volume tempers confidence.
**🎯 Trade Plan**
* **Ticker:** \ NASDAQ:COIN
* **Type:** CALL (LONG)
* **Strike:** \$350.00
* **Entry:** \$0.90 (open)
* **Profit Target:** \$1.70 (+89%)
* **Stop Loss:** \$0.45 (-50%)
* **Expiry:** 2025-08-15
* **Size:** 1 contract
* **Confidence:** 65%
**📊 Key Notes**
* Call/put ratio 2.83 → strong bullish options flow ✅
* RSI mixed but recovering from oversold ⚠️
* VIX low → low gamma risk, favorable for option buyers ✅
* Watch volume closely at open for confirmation 🔍

COIN Gamma Storm Incoming!!!## 🚨 COIN Weekly Options Setup (Aug 7, 2025) 🚨
**Massive Call Flow vs. Bearish Momentum — Who Wins?**
> 🔍 Multiple AI models conflicted. Gamma risk rising. One day to expiry. Here's the trade...
---
### 🧠 Key Model Consensus (Across Grok, Claude, Llama, DeepSeek, Gemini):
✅ **Bullish Options Flow** from institutional players
📉 **Bearish Price Momentum** and RSI
⚠️ **High Gamma Risk** into expiration
🤔 **Signal Divergence** = Uncertainty + Volatility
---
### 🟩 **Bulls’ Case (Grok, Claude, Llama):**
* Oversold conditions + call buying = Rebound Setup
* Volume spike confirms institutional interest
* Moderate bullish lean with upside potential
### 🟥 **Bears’ Case (DeepSeek, Gemini):**
* Price action still weak
* Distribution pressure detected
* Recommending no trade or puts
---
### 📊 Trade Setup Summary
| Parameter | Value |
| -------------------- | ----------------- |
| 🎯 **Strike** | \$322.50 |
| 📅 **Expiry** | 2025-08-08 (1DTE) |
| 📈 **Direction** | CALL (LONG) |
| 💵 **Entry Price** | \$0.96 |
| 🎯 **Profit Target** | \$1.44 |
| 🛑 **Stop Loss** | \$0.57 |
| 📏 **Size** | 2 Contracts |
| 🔁 **Entry Timing** | Market Open |
| 🧪 **Confidence** | 65% (Moderate) |
---
### ⚠️ Risks to Watch:
* 1DTE = High volatility swings ⚡
* Momentum still leaning bearish 📉
* Gamma moves could trigger sharp reversals
---
📌 **Final Take**:
**Trade if you’re aggressive. Sit out if you’re cautious.**
This is a classic high-risk/high-reward setup driven by **options flow vs. price action divergence**.

COIN 0DTE Trade Breakdown – July 25, 2025
📉 COIN 0DTE Trade Breakdown – July 25, 2025
Put Play or Pass? Let’s break it down 👇
📍 Price: $392.34
🧠 Sentiment: Neutral → Bearish
📊 Call/Put Ratio: 1.08 (Balanced flow)
⚠️ Gamma Risk: HIGH
⌛ Time Decay: Accelerating (0DTE!)
⸻
🎯 TRADE IDEA: 0DTE PUT
✅ Strike: $380.00
💵 Entry Price: $0.69
🎯 Profit Target: $1.00
🛑 Stop Loss: $0.37
📆 Expiration: Today (Jul 25)
📈 Confidence: 65%
📍 Entry Timing: At Open
⸻
⚠️ Why This Trade?
🔻 RSI trending down
🚫 Weak institutional volume
⚠️ High volatility expected from gamma squeeze
🕒 Tick. Tock. Time decay’s your biggest enemy here.
📌 Strategy:
➡️ Naked PUT (speculative short-term play)
⛳ Goal? Quick move → quick exit
⸻
🚨 Risk Warning:
❗ 0DTE = Massive swings
❗ One wrong move = rapid premium decay
❗ Stay nimble. Know your exit.
⸻
💬 Drop a 🔥 if you’re watching COIN today
#OptionsTrading #0DTE #COIN #DayTrading #PutOption #TradingView #StockTok #GammaRisk #TradeSetup

COIN Weekly Bullish Options Setup (Jul 22, 2025)
🚀 NASDAQ:COIN Weekly Bullish Options Setup (Jul 22, 2025)
Institutional call flow is heavy. Momentum is fading — but not dead. Volume confirms bulls. This is a calculated strike before earnings zone noise.
⸻
📊 Trade Setup
• 🎯 Direction: CALL
• 📍 Strike: 410
• 💰 Entry: $14.70
• 🎯 Target: $17.00+
• 🛑 Stop: $11.60
• ⏰ Expiry: 07/25/2025 (3DTE)
• 📈 Confidence: 65%
• 📍 Entry Timing: Market open
⸻
🔍 Model Consensus (Multi-AI Synthesis)
• 🟢 3/5 models bullish: Grok, Llama, DeepSeek
• 🟡 1 neutral: Gemini (momentum divergence noted)
• 🔴 1 bearish: Claude (overbought RSI divergence risk)
• 📈 VIX < 22 = Green Light
• 🧠 Key Catalyst: PNC x Coinbase partnership + institutional volume surge
• 📉 Watch for RSI reversal > Weekly 83.5
⸻
📎 Trade Logic
• Options flow + volume = 🔥 institutional accumulation
• RSI high but manageable — expect momentum pockets, not full reversals
• Range target: $428–$444.65
• Stop loss = discipline, not fear
⸻
🧠 Risk Note:
• Momentum divergence is real.
• Avoid chasing if VIX > 22 or if open shows reversal.
• Size small. Let the volume do the work.
⸻
📢 Tagline (for virality)
“Snakes see a breakout, but bulls smell blood. NASDAQ:COIN loading calls on institutional flow. 3DTE scalp or breakout runner. Your move.” 🐂📈

COINBASE and ALTS going hand in hand! Massive break-out expectedCoinbase (COIN) and the Crypto Total Market Cap (excluding top 10) are going hand in hand in this Cycle as their patterns since the November 08 2021 High have been virtually identical.
Right now we are on a strong rebound which was initiated on both after breaching below the 1W MA200 (orange trend-line). That is basically a Double Bottom, aiming at a break-out above their respective Resistance levels, which is expected to be massive.
Notice how even their 1W RSI patterns are similar, both Falling Wedges. Also their Bull Cycles both started on an Inverse Head and Shoulders pattern, so there is every reason to expect that the two will continue hand in had until their very peaks of the Cycles.
-------------------------------------------------------------------------------
** Please LIKE 👍, FOLLOW ✅, SHARE 🙌 and COMMENT ✍ if you enjoy this idea! Also share your ideas and charts in the comments section below! This is best way to keep it relevant, support us, keep the content here free and allow the idea to reach as many people as possible. **
-------------------------------------------------------------------------------
💸💸💸💸💸💸
👇 👇 👇 👇 👇 👇

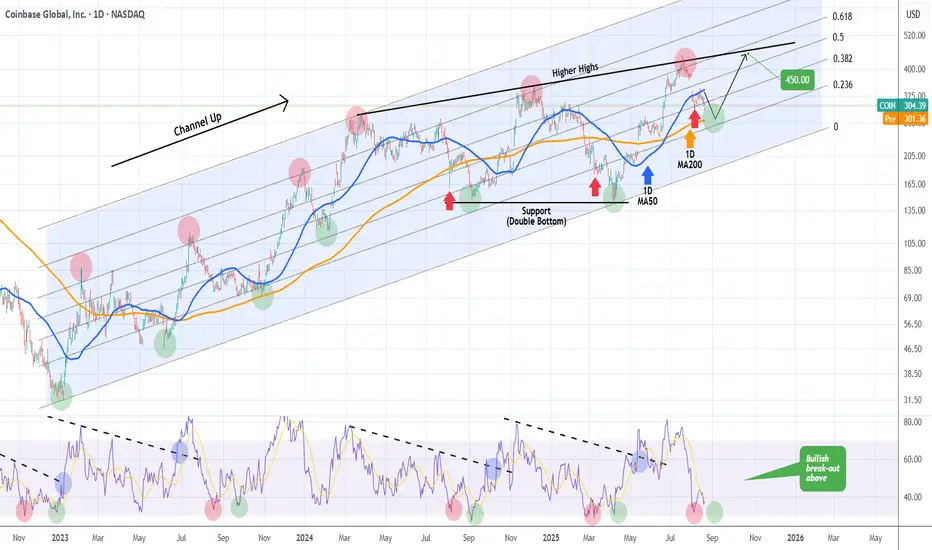
COINBASE Can the 1D MA50 catapult it to $400?Coinbase (COIN) has been trading within a Fibonacci Channel Up ever since the Bull Cycle started on the January 06 2023 market bottom. The price made a Double Bottom on April 07 following the correction from its most recent High in early December.
That is a strong long-term market Support and a clear Demand Level as the stock's immediate rebound showed. The fact that it has currently flipped the 1D MA50 (blue trend-line) into a Support and is consolidating is a clear signal of a Re-accumulation Phase.
A break above its 1D MA200 (orange trend-line) will technically confirm the extension of the new Bullish Leg. The previous High was on the 0.786 Fibonacci Channel level and the one before that on the 1.0 Fib. If this declining rate continues, we should be expecting the next High to just hit the 0.618 Fib.
As a result, we have $400 as a medium-term Target, slightly above the stocks previous All Time High (ATH) at $370.
-------------------------------------------------------------------------------
** Please LIKE 👍, FOLLOW ✅, SHARE 🙌 and COMMENT ✍ if you enjoy this idea! Also share your ideas and charts in the comments section below! This is best way to keep it relevant, support us, keep the content here free and allow the idea to reach as many people as possible. **
-------------------------------------------------------------------------------
💸💸💸💸💸💸
👇 👇 👇 👇 👇 👇

COINBASE This is the time to buy and target $400Coinbase Global (COIN) has been trading within a Channel Up pattern since the March 25 2024 High, so effectively a whole year. In the past 10 days it has been consolidating on top of the 1W MA100 (red trend-line), which is the natural long-term Support of the market.
During the same time it entered the Mayer Multiple Bands (MMB) Buy Zone, consisting of the 3 SD (green trend-line) and 2 SD (blue trend-line) below levels, which has given the ultimate buy signals since the January 2023 market bottom. Practically, the stock is consolidating within the 2 SD below and 1W MA100, a tight buy range.
Given the symmetry of the Channel Down Bearish Legs (both -48.39%), we expect a similar symmetry on its Bullish Legs too. Since the previous one reached the 1.236 Fibonacci extension, we are confidently targeting $400 before this Cycle tops. That would also make a perfect entry within the MMB Sell Zone that consists of the Mean MM (black trend-line) and 1 SD above (grey trend-line).
Notice also how the 1W RSI touched the Support of the September 06 2024 Low.
-------------------------------------------------------------------------------
** Please LIKE 👍, FOLLOW ✅, SHARE 🙌 and COMMENT ✍ if you enjoy this idea! Also share your ideas and charts in the comments section below! This is best way to keep it relevant, support us, keep the content here free and allow the idea to reach as many people as possible. **
-------------------------------------------------------------------------------
💸💸💸💸💸💸
👇 👇 👇 👇 👇 👇

COINBASE about to start a rally to $550Coinbase (COIN) broke above its 1D MA50 (blue trend-line) again yesterday, but is practically still consolidating around it for the past 2 weeks. Still, it has already broke above December's Channel Down, which on the wider, long-term bullish trend, is nothing but a Bull Flag pattern, similar to January 2024.
As you can see, both patterns were initiated after previously a Falling Wedge broke upwards and above the 1D MA50 and on all occasions, the price increase has been significant, with the smallest being +139.50%.
As a result, being also on a 1D MACD Bullish Cross, we expect the stock to kick-start the new Bullish Leg soon. Expecting to register at least another +139.50% Leg from the recent Low, our Target is $550.
-------------------------------------------------------------------------------
** Please LIKE 👍, FOLLOW ✅, SHARE 🙌 and COMMENT ✍ if you enjoy this idea! Also share your ideas and charts in the comments section below! This is best way to keep it relevant, support us, keep the content here free and allow the idea to reach as many people as possible. **
-------------------------------------------------------------------------------
💸💸💸💸💸💸
👇 👇 👇 👇 👇 👇

COINBASE approaching the 1W MA50 and turns into a Buy again.Coinbase (COIN) has gone a long way since our September 09 buy signal (see chart below):
Even though it marginally missed the $360 Target, the pattern served in an excellent way those investors who bought at the bottom of its dominant 2-year Channel Up. The September - December Bullish Leg was by a narrow margin, the shortest (+141.45%) of Coinbase's total 5 major rallies within this pattern.
As the price is yet again approaching the 1W MA50 (blue trend-line), it is gradually turning into a Buy opportunity again. Even though the shortest Bearish Leg has been -38.74% and that currently places the projected bottom level a little over $215, the 1W RSI has already broken below its MA (yellow trend-line), which has been the ultimate buy signal on all previous technical corrections with the exception of last April.
As a result, there are more probabilities to see COIN resume the 2-year bullish trend, with the Risk/ Reward Ratio (RRR) turning favorable again. A Dollar-cost-averaging strategy is also suited for those seeking less risk.
Our Target from now on is $500, which represents a +141.45% rise (as mentioned above, the shortest within the Channel Up).
-------------------------------------------------------------------------------
** Please LIKE 👍, FOLLOW ✅, SHARE 🙌 and COMMENT ✍ if you enjoy this idea! Also share your ideas and charts in the comments section below! This is best way to keep it relevant, support us, keep the content here free and allow the idea to reach as many people as possible. **
-------------------------------------------------------------------------------
💸💸💸💸💸💸
👇 👇 👇 👇 👇 👇

COINBASE Ahead of an enormous bullish break-out.In recent times, we have focused on Coinbase's (COIN) long-term potential on higher time-frames (1W) like the one below (September 09) where we gave a great buy signal on the absolute bottom of the 2-year Channel Up:
On today's analysis we look into the 1D time-frame as Coinbase is about to test its longest 2024 Resistance, the Lower Highs trend-line that started after the March 25 2024 High. With added bullish pressure by the 1D MACD Bullish Cross formed 2 days ago, if this Lower Highs trend-line breaks, we can technically have a very aggressive rally.
The September 06 bottom can be seen as the start of the Head of an Inverse Head and Shoulders (IH&S) pattern, which has a standard Target on the 2.0 Fibonacci extension. That is just above $340. As a result, if the Lower Highs trend-line breaks, you can take additional buys to target $340.
-------------------------------------------------------------------------------
** Please LIKE 👍, FOLLOW ✅, SHARE 🙌 and COMMENT ✍ if you enjoy this idea! Also share your ideas and charts in the comments section below! This is best way to keep it relevant, support us, keep the content here free and allow the idea to reach as many people as possible. **
-------------------------------------------------------------------------------
💸💸💸💸💸💸
👇 👇 👇 👇 👇 👇

COINBASE Surges as Bitcoin Breaks $71,000! Next Price Target?Analysis of Coinbase (COIN) - 15m Timeframe
Trade Setup: Coinbase has shown a significant uptick as Bitcoin surged past the $71,000 mark, triggering a bullish entry point at $214.90.
Volume and Momentum: Current trading volume stands at 10.46M, surpassing the 30-day average of 9.32M, signaling strong interest and momentum.
Technical Levels:
Entry: $214.90
Target 1 (TP1): $221.45
Target 2 (TP2): $232.06
Target 3 (TP3): $242.66
Target 4 (TP4): $249.21
Stop Loss (SL): $209.60
Catalyst:
Bitcoin’s recent price surge has positively influenced Coinbase’s stock, aligning with its correlation to crypto trends. The upcoming earnings report in 2 days may add further volatility, providing potential upside if positive results are announced.
Conclusion: This entry marks an opportune moment to capitalize on Coinbase's rally tied to Bitcoin’s performance. Traders should watch the earnings announcement closely as it could propel the stock further, potentially reaching the set targets.

COINBASE Bears in Control: More Downside Likely!COINBASE Short Trade Technical Analysis:
Coinbase Global on the 15-minute timeframe shows a strong short trade setup, with TP1 already hit. The stock is trading below the Risological dotted trendline, reinforcing the bearish sentiment.
Key Levels:
Entry: 207.12
Stop Loss (SL): 213.68
Target 1 (TP1): 199.00 (Done)
Target 2 (TP2): 185.87
Target 3 (TP3): 172.74
Target 4 (TP4): 164.62
Observations:
The price remains under significant selling pressure, evident by its inability to recover above the Risological dotted trendline.
With increasing volume on the down moves and resistance holding strong, the continuation of the downtrend appears highly likely.
The structure suggests more downside as sellers maintain control, and buyers struggle to regain any meaningful momentum.
Coinbase Global continues to look bearish after TP1, and the price action is aligned for further declines. Keep an eye on the lower targets as they are within reach, supported by the clear downward trend and weak buying attempts!

Coinbase Surges! Long Trade Hits All Targets – Bulls Drive GainsCoinbase has shown strong bullish momentum since the long entry at 168.72 on 11th October, reaching all designated profit targets.
Key Levels
Entry: 168.72 – The long trade was initiated at this level, supported by a bullish breakout.
Stop-Loss (SL): 165.30 – Positioned below recent support to manage risk and guard against downside movement.
Take Profit 1 (TP1): 172.93 – The first target was hit, confirming the strength of the upward move.
Take Profit 2 (TP2): 179.76 – Continued buying pressure led to this level being reached.
Take Profit 3 (TP3): 186.59 – The bullish momentum carried the price to this target.
Take Profit 4 (TP4): 190.81 – The final profit target, signaling a successful trade completion.
Trend Analysis
The price remains well above the Risological Dotted trendline, affirming the strong uptrend. The sustained upward movement indicates solid market sentiment, which has driven the price through all target levels.
The long trade on Coinbase has been highly successful, with all targets hit and the final level at 190.81 achieved. The trade's success showcases the power of the Risological Dotted trendline in guiding bullish entries and exits.
