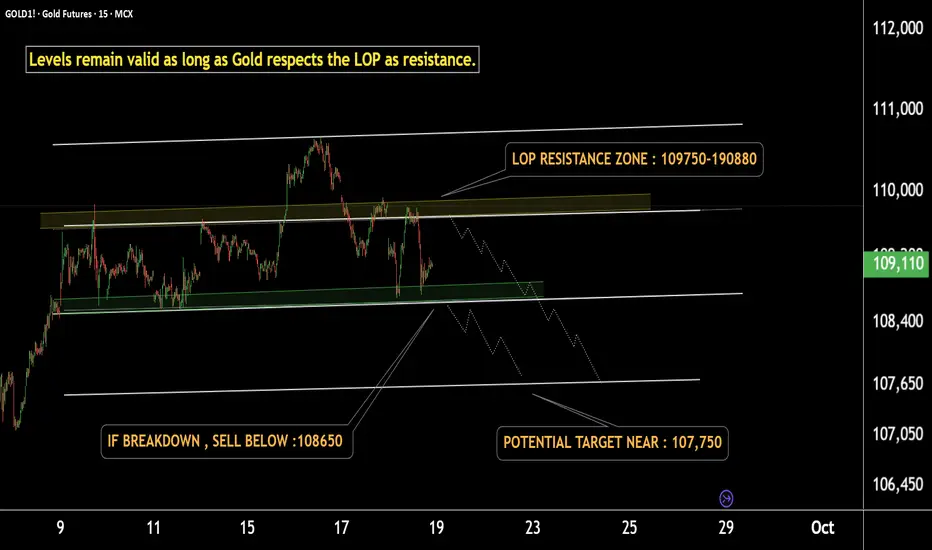
Gold setup indicates a fall ahead – Stay alert, traders!This is the 15-minute chart of GOLD1!
Gold is moving in a well-defined parallel channel and currently respecting the LOP resistance zone at 109750–109850.
The channel’s lower boundary near 108650 may act as short-term support.
If Gold breaks down below this support, the projected downside target is near 107750.
In case of range-bound movement, the ideal sell zone remains at the LOP (109750–109850).
If this resistance level sustains, Gold may fall and test the lower targets.
Additionally, a Head & Shoulders pattern has formed within the channel, with its downside target aligning with the channel projection.
Thank you.
Commdodities
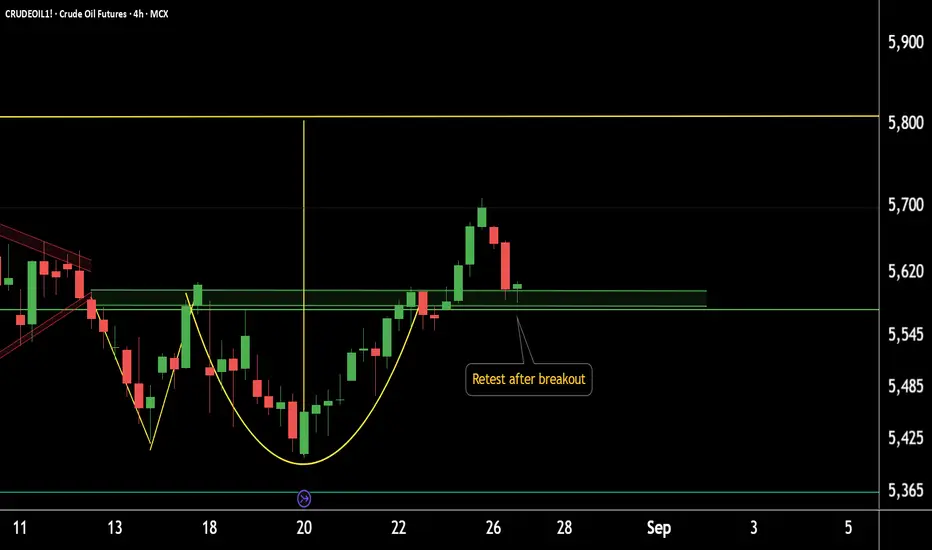
CRUDEOIL1! breakout + support confirmation=potential upside move4-Hour Chart Update: CRUDEOIL1!
CRUDEOIL1! has retested the breakout zone at 5580–5600.
If this level sustains, we may see higher prices ahead in CRUDEOIL1!.
Thank you!
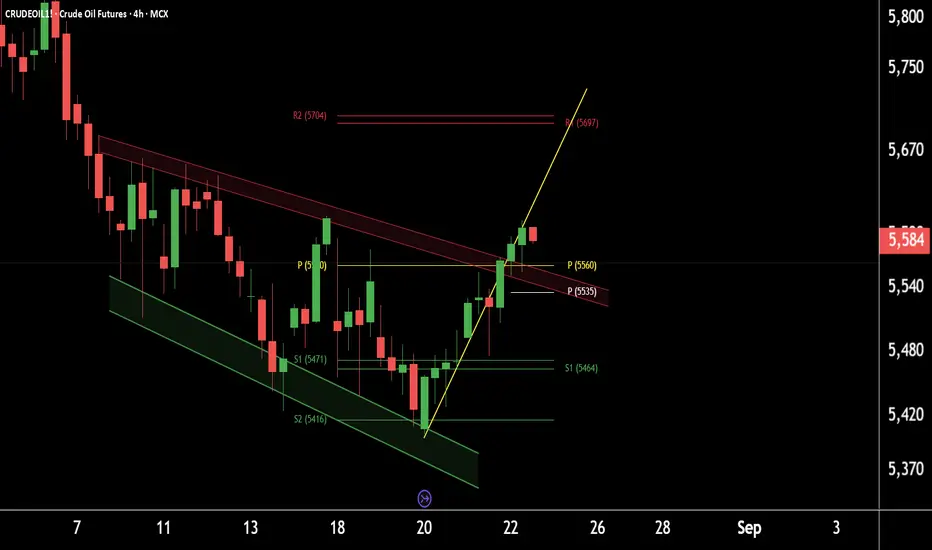
Crude Oil breaks out of falling channel –Watch for higher level.This is the 4-hour timeframe chart of CrudeOil1!.
The price has been moving within a well-defined falling channel and has now given a breakout. A possible retest of the breakout level around 5560 may occur, after which CrudeOil could move towards the falling channel completion target near 5700.
Weekly pivot support is also placed around the 5400–5450 zone and resistance around 5700.
If this level is sustained, we may see higher prices in CrudeOil1!
Thank You !!
Oil: Thoughts and AnalysisToday's focus: Oil
Pattern – Support Hold
Support – 71.80
Resistance – 78.80
Hi, traders; thanks for tuning in for today's update. Today, we are looking at Oil.
After a solid three-day decline, buyers have put up a fight from 71.80, but is this enough to hold the current uptrend? A break below yesterday's bar with a trend break could suggest that the current move lower has further to go.
We have reviewed a few scenarios we are looking for, depending on what we see today.
Good trading.

GBPCAD: Hidden Bearish Divergence Confirming a 3rd Lower HighWe have some Hidden Bearish Divergence on the monthly MACD as the GBP is failing to get above the highs for the 3rd time. This could eventually lead to a huge breakdown that could take it all the way down to the 1.618 Fibonacci Extension.

NATURAL GAS Possible Long analysisThe NATURAL GAS trend is bearish for the last couple of months. The market placed a 1.9625 low on 22-Feb-2023. In a 4Hour time frame market reject the resistance area ( $2.54-2.61 ) as mentioned in the price chart and continued the bearish move. Now price is traded near the Support area ( $2.31-2.24 ). Volume indicates bears lose momentum. Price respect the Trendline in the past two times and now again near to test. Price also traded above the 200 MA ( moving average ) which indicates a bullish trend. So initiate long positions after closing above the Support area and also the trendline. On the other side, Short selling is favorable near the resistance area as mentioned above in the price chart after confirmation by a bearish price action structure.
Support and Resistance levels for day trading ;
Pivot Point Level: PP 2.3776
Support Levels: S1 2.3137, S2 2.2684, S3 2.2045
Resistance Levels: R1 2.4229, R2 2.4868, R3 2.5321

GOLD - trade idea - from 27.04.2021 - active Analysis: Gold was advancing to the upside since our last trade (27.04) and I am waiting for a price action for the price to hit my first target in the upcoming weeks. Once we can manage to clear the zone near the 1850$ level it will open the road to test the second target around the 1960$ level.Bad fundamental news from the worlds large economies or geopolitical/healthcare news can boost up the price momentum.
Trade from 27.04.2021 - ACTIVE
Trade: BUY
Entry: 1780$
1st target: 1850$
2nd target: 1950$
S/L: 1750
