#USDJPY , Follow it !📊 Morning Market Brief | London Session Prep
🔎 Instrument Focus: #USDJPY
⚠️ Risk Environment: High
📈 Technical Overview:
Crazy moves by USDINDEX and it keep dropping so lets be same way of Momentum
ENTRY ONLY AND ONLY BY LTF entry sign
🚀 Trading Plan:
• LTF ENTRY NEEDED
• Just and Only for QuickScalp
🧠 Stay updated with real time news and macro events, visit 👉 @News_Ash_TheTrader_Bot
#Ash_TheTrader #Forex #EURUSD #MarketInsight #PriceAction #TradingPlan #RiskManagement #LondonSession #Scalping #Futures #NQ #Gold
Commodities

Stop!Loss|Market View: SILVER🙌 Stop!Loss team welcomes you❗️
In this post, we're going to talk about the near-term outlook for SILVER ☝️
Potential trade setup:
🔔Entry level: 115.78874
💰TP: 92.94021
⛔️SL: 125.46576
"Market View" - a brief analysis of trading instruments, covering the most important aspects of the FOREX market.
👇 In the comments 👇 you can type the trading instrument you'd like to analyze, and we'll talk about it in our next posts.
💬 Description: Metals are still considered for short-term buy, but given today's Fed meeting and its interest rate decision, prices could reverse sharply based on Powell's potential rhetoric. Rhetoric favoring keeping rates unchanged would allow buyers to lock in after the rally, thereby triggering a correction in silver toward the 95 level. Selling is only considered in this scenario, and most likely during the Fed press conference itself.
Thanks for your support 🚀
Profits for all ✅

Is Not Reversing — It’s Deciding Where the Next ATH StartsOANDA:XAUUSD just printed a sharp pullback after failing to hold above the ATH range, but structurally this is not a breakdown. Price is currently reacting around the prior breakout support, while the deeper demand zone below remains untested, acting as a liquidity magnet if downside continuation occurs. From a technical standpoint, this is a classic post impulse correction: strong expansion → distribution near highs → liquidity sweep → decision point . If buyers defend the current support and reclaim the ATH range, continuation toward the next upside target is back on the table; however, failure here likely sends price into the demand zone to rebalance inefficiencies before the next leg. Macro wise, gold still benefits from rate-cut expectations, geopolitical risk, and central bank accumulation but price still needs liquidity before expansion. This is not a prediction chart. it’s a conditional map: hold support and break ATH = continuation; lose support = deeper reset before the real move.

The "Grinding" Bull—High Noise, Low EfficiencyUnlike the smooth Gold rally, Silver is struggling. The Neural Brain identifies a trend that is moving up but fighting heavy resistance every step of the way.
1. THE PHYSICS: Efficiency Score (0.05)
Status: Critical Inefficiency
The Data: For every $1 the price gains, it travels $20 in total path ($0.91 Net Move vs. $18.05 Total Noise).
The Meaning: The market is "churning." Buyers and sellers are in a violent tug-of-war. The price isn't gliding; it's clawing its way up.
2. THE MIND: Conviction (LOSING)
Status: Repelling Risk
Conviction: LOSING. The AI sees the chaotic volatility and determines the probability of a clean move is dropping.
Mode: FLAT (REPELLING). The system is mathematically rejecting new entries because the "Micro Action" is too messy.
3. THE STRATEGY: "HOLDING (Ignoring Noise)"
Status: Sit on Your Hands
Macro: Strong Bullish (Trend is up).
Micro: Noisy/Chop (Price action is messy).
Action: HOLD. The trend hasn't broken, so don't sell—but the "cost" of movement is too high to buy more. Wait for the Efficiency Score to recover (>0.30) before adding size.

Neural Brain Comprehensive Diagnosis: Gold (XAU/USD)This forensic analysis combines two critical data streams from the Neural Brain—Efficiency (The Physics) and Conviction (The Math)—to explain why the AI has issued a 100% Confidence BUY signal on Gold.
1. The Physics: Efficiency Score (0.52)
Status: Sustainable / "The Goldilocks Zone"
The "Efficiency Score" measures the structural integrity of the price movement. It answers the question: Is this trend fragile?
The Data:
Net Move: 112.11 (Distance gained)
Total Noise: 216.22 (Effort/Volatility used)
Score: 0.52 (Mid-range)
The Implication:
Not Overheated (>0.80): The price isn't going vertical. Buyers aren't blindly chasing; they are building support floors on the way up.
Not Stalling (<0.30): The trend isn't churning or exhausted.
The Verdict: We are seeing "Constructive Friction." For every $1 gained, the market travels $2. This means bears are selling, but bulls are consistently absorbing that supply. This two-way trading creates a stable ladder, making the trend resilient against sudden crashes.
2. The Math: Conviction Monitor (GAINING)
Status: Accelerating Probability
The "Conviction Monitor" uses a Rational Quadratic Kernel to calculate the probability of the trend continuing. It answers the question: Is the smart money leaving?
The Data:
Bias: BULLISH
Conviction: GAINING (Green)
Mode: TRENDING (TRACKING)
The Implication:
Defying Gravity: Typically, as a price moves higher, conviction drops because the risk of a pullback increases (mean reversion).
The AI Paradox: Here, Conviction is GAINING despite historic highs.
Why? The AI sees the Efficiency Score of 0.52 and recognizes that the volatility is "organized," not chaotic. The math determines that this specific volatility pattern matches historical profiles of continuation, not exhaustion. The "Brain" is getting more confident the higher it goes because the structure remains stable.
3. The Synthesis: The "Glass Box" Verdict
System Output: STRONG BUY (100% Confidence)
When we combine these two layers, we get the complete forensic picture:
"The Efficiency Score (0.52) proves the trend is physically stable and not a bubble. Because of this stability, the Conviction Monitor is mathematically projecting a higher probability of upside continuation, instructing the system to ignore intraday noise and TRACK the macro trend."
Strategic Action:
Macro Structure: STRONG BULLISH
AI Strategy: TRACKING (Standard)
Instruction: Do not fade this move. The data suggests Gold is climbing a structural wall, not a speculative spike. Stay long/look for entries on minor dips.

Parabolic / Blue Sky BreakoutThe SLV chart depicts a massive "blow-off top" or hyper-growth phase. The momentum is aggressively to the upside, but the distance from the nearest technical support (27.66) indicates the asset is significantly over-extended from its mean.
Bull Case: Momentum is dominant. With no overhead resistance, the price can theoretically run until buyer exhaustion occurs.
Bear/Risk Case: The vertical ascent leaves the asset vulnerable to sharp, volatile corrections, as there is little established market structure between 101 and 30 to catch a falling price.

NG1! - Correction NeededFrom January 15 to January 26 of this year, a five-wave impulse was completed. We now expect a correction.
Potential targets:
6.360
5.741
5.204
4.677
The most probable range appears to be between 5.204 - 4.677 or lower, given that this is a commodity.
The exact correction structure will become clear as the move develops.
Estimated movement potential from current levels:
Approximately 4-30%
---
Please subscribe and leave a comment!
You’ll get new information faster than anyone else.
---

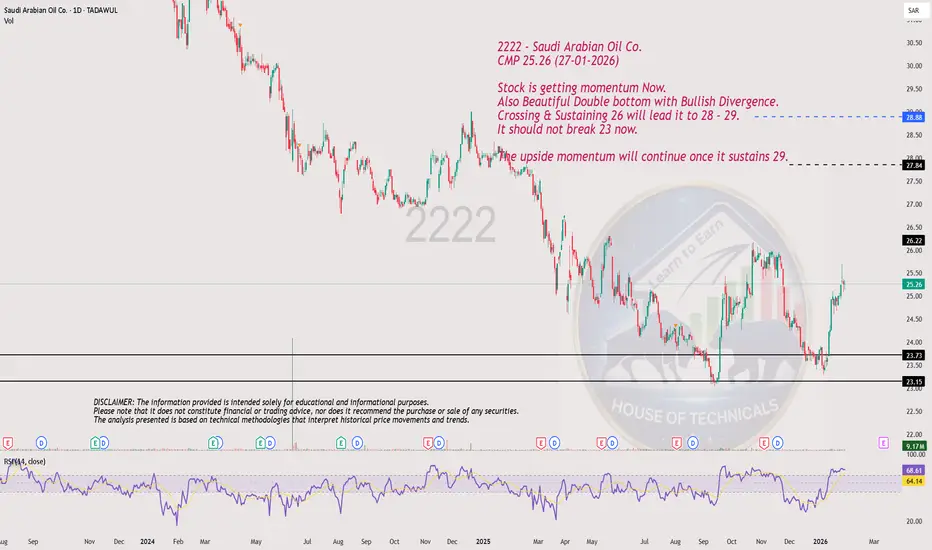
Stock is getting momentum Now.2222 - Saudi Arabian Oil Co.
CMP 25.26 (27-01-2026)
Stock is getting momentum Now.
Also Beautiful Double bottom with Bullish Divergence.
Crossing & Sustaining 26 will lead it to 28 - 29.
It should not break 23 now.
The upside momentum will continue once it sustains 29.
Gold silver ratio - possible pathThe RSI says we should change from silver to gold - but only if the silver market under control. IF its not than we go the levels of the RSI when silver traded free. Just some thoughts , not trading or swapping advise.

EURUSD: flight from USD🛠 Technical Analysis: On the H1 chart, EURUSD remains in a clean ascending channel, holding a bullish structure after the sharp impulse move higher. Price is now consolidating just under the recent swing high, suggesting a potential continuation if the channel holds. The SMA cluster (50/100/200) sits below price, supporting the uptrend. A pullback into the 1.1866 area can serve as a retest entry for a push toward the upper channel boundary near 1.1923.
———————————————
❗️ Trade Parameters (BUY)
———————————————
➡️ Entry Point: 1.18663
🎯 Take Profit: 1.19235
🔴 Stop Loss: 1.18282
⚠️ Disclaimer: This is a potential trade idea based on current analysis; market conditions and price direction are subject to change based on news factors and volatility.

GC Compression Under ATH — Break or Rotate 1/27/26🟡 GC (Gold Futures) 📊 | Premarket Trading Plan
🧲 Key Decision Zone
5,080 – 5,070
→ Prior rejection zone + range midpoint
This is the battle line between continuation and rotation.
🔴 Resistance / Supply
5,095 – 5,108 → ATH supply / distribution cap
5,083 – 5,090 → Active seller zone (multiple rejections)
🟢 Support / Demand
5,000 – 4,990 → Prior week high + imbalance support
4,960 – 4,950 → Trend support / acceptance base
4,910 – 4,900 → Extreme downside / range low
🧭 Trade Thesis
🟢 Bull Case
Acceptance above 5,080 keeps GC in continuation mode
Holding 5,070 = dip buyers still active
Clean reclaim opens 5,095 → 5,108 (ATH test)
Break and hold ATH = price discovery
🔴 Bear Case
Rejection at 5,080–5,090 keeps GC range-bound
Acceptance below 5,050 opens rotation toward 5,000
Loss of 4,990 exposes 4,960 → 4,950
📌 Market Context (Why This Matters)
GC is extended but not breaking structure
Momentum slowing under ATH = compression
Expect reaction-based trades, not chasing
Best setups = acceptance or hard rejection, not chop

Generational Wealth | Precious Metals Super Cycle | Palladium Strategy: Impulse Correction
Direction: Bullish
Moving Average: Blue above Red
Fib Retracement: 38.2 reached
MACD > 0
Support : Finding additional confluence, as the weekly bounces off a massive support structure.
Alongside this, we can see that a reverse pattern is becoming clear with additional support illustrated by the support level in the form of the rectangular red box.
1st Target = 1678
2nd Target = 1836
3rd Target = 2039
Lots: 0.1 (Plan to pyramid into this one)
INSIGHTS: Precious metals continue to show strength with a weakening dollar. Pay attention to the DBC commodity Index which is indicating strength across the commodity complex. Alongside this, the DXY is sitting at an interesting level. Lets see whether will bounce at this level off a multiyear trend or whether the dollar will give way to lower lows in the coming months.

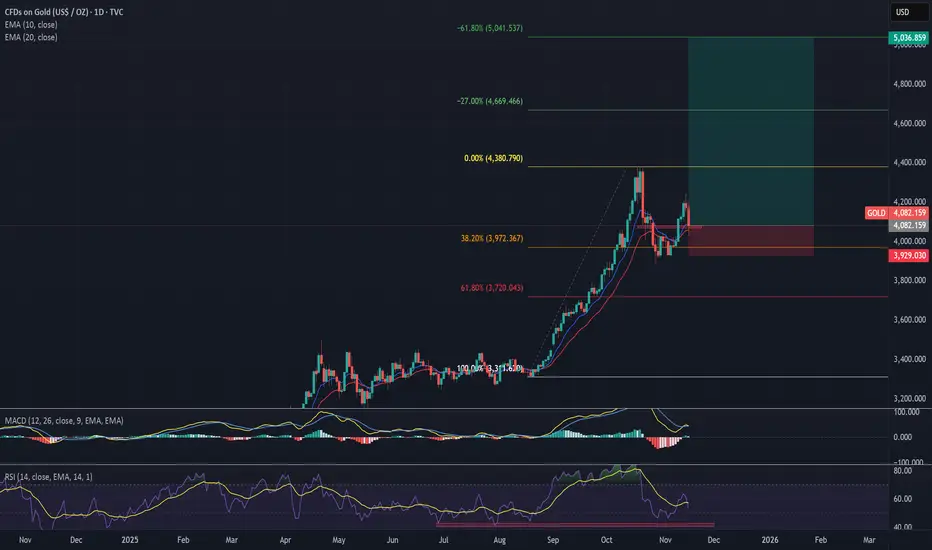
Generational Wealth | Precious Metals Super Cycle | GoldStrategy: Impulse Correction
Direction: Bullish
Moving Average: Blue above Red
Fib Retracement: 38.2 reached
MACD > 0
Support: After a massive sell-off across the board, we will look to see if gold can hold support by bouncing off the moving averages. Lets see if it can find bullish strength and regain the move experienced on Friday. If it moves lower, we could see it going back to 4000, before a potential reversal.
1st Target = 4380
2nd Target = 4669
3rd Target = 5041
Lots: 0.1 (Plan to pyramid into this one)
INSIGHTS: Precious metals continue to show strength with a weakening dollar. Pay attention to the DBC commodity Index which is indicating strength across the commodity complex. Alongside this, the DXY is sitting at an interesting level. Lets see whether will bounce at this level off a multiyear trend or whether the dollar will give way to lower lows in the coming months.
GOLD approaching Buying ClimaxGold is trading 35% above the 50 Week MA and approaching a buying Climax.
RSI is elevated and unsustainable, even more so on the monthly timeframe.
Max Upside Risk 5200$
First Level Down is the 4800$ Area
Max Downside is the upcoming 50 Week MA.

XAUUSD: false breakout setup🛠 Technical Analysis: On the 4-hour timeframe, XAUUSD remains in a strong uptrend, but the price is currently squeezing below a clearly defined resistance band in the 5080-5100 region. A probable breakout above this zone could potentially form a "false breakout," trapping buyers before a corrective move begins. The key trigger is the rising trendline support: a confirmed break below it would confirm a bearish correction scenario. The price is still above the 50/100/200 SMA, but a loss of the trendline + SMA50 area will likely accelerate the downward momentum. The next important demand zone is near 4900. A sustained hold above the resistance zone (and especially above the 5184 area) would invalidate the sell signal and maintain the bullish trend.
———————————————
❗️ Trade Parameters (SELL)
———————————————
➡️ Entry Point: Sell on a confirmed false breakout at 5,080–5,100 followed by a break below the rising trend support (approx. 5,050–5,070)
🎯 Take Profit: Support near 4,900
🔴 Stop Loss: 5,184
⚠️ Disclaimer: This is a potential trade idea based on current analysis; market conditions and price direction are subject to change based on news factors and volatility.

EUR/USD | Going higher? (READ THE CAPTION)As you can see in the 2H chart of EURUSD, it reached a high of 1.19072 before dropping into the NWOG Zone, just below the high of the NWOG, being traded at 1.18630. It went inside the Jan 26th's NWOG zone, but managed to bounce back up.
For the time being, the targets are: 1.18710, 1.18890, 1.19070.

USD/JPY | Up or down? (READ THE CAPTION)As you can see in the 4H chart of USDPJY, this pair has been gradually dropping for quite a while, going down from 159.45 all the way to 153.17! It is currently being traded at 153.58, just below the low of the Bullish OB.
I expect USDJPY to struggle with the Bullish OB for a while before making its next move.
Bullish Targets: 154.00, 154.45, 154.88 and 155.30
Bearish Targets: 153.20, 153.00, 152,80 and 152.60.


Fundamental Note: DXY(USD) 26 Jan 2026DXY starts the week hovering near the 97 handle and around four-month lows as investors reassess the dollar’s “safe-haven” role amid rising policy/geopolitical uncertainty and increased FX-hedging by foreign holders of US assets. The key event is the Fed’s Jan 28 FOMC meeting, where rates are widely expected to be kept unchanged and the market will trade off Powell’s tone rather than new projections. Beyond the policy statement, the Fed-independence narrative is a real macro risk premium now, with political pressure and legal/probe headlines potentially impacting USD confidence and rate expectations simultaneously. US Treasuries are the second big driver: this week’s heavy auction slate (2Y/5Y/7Y) can swing front-end yields and the curve, which usually feeds directly into DXY momentum. However, if investors demand higher term premium because of Fed credibility/fiscal-policy concerns, long yields can rise without a “clean” USD bid (a classic setup for choppy, headline-driven DXY). Geopolitics remains two-sided: Greenland-linked US–EU tariff threats and Middle East/Iran risk can spark haven demand, but recent bouts have also pushed flows into gold and other havens while the dollar softened.
Bottom line: DXY is set for a volatility week where Fed communication + Treasury yields + geopolitical headlines decide whether the dollar bounces or stays “sold on rallies.”
🟢 Bullish factors:
1. Fed holds rates and sounds less dovish than market pricing → yields/USD rebound.
2. Firm US data (e.g., durable goods) supporting growth/real yields.
3. Risk-off spikes can still generate short-term USD demand via liquidity preference.
🔴 Bearish factors:
1. Any dovish tilt from Powell (or clearer “cuts by mid-2026” guidance) pressures DXY.
2. Fed-independence/policy uncertainty → more FX hedging / “Sell America” diversification flows.
3. FX-intervention talk around USDJPY can weigh on broad USD sentiment.
🎯 Expected targets: Base-case range trading 98.0–100.0 into/through the FOMC; a hawkish-hold + firmer yields scenario can lift DXY toward 99.8–100.6 , while dovish messaging or renewed Fed-independence headlines risk a slide toward 97.5–96.8 .

Silver Buy Trading Opportunity SpottedH1 - Strong bullish move
Currently it looks like a pullback is happening.
Until the two support zones hold I expect bullish continuation.
👉 If you enjoy this analysis, please Like, Follow, and Support the profile! Your engagement motivates us to share more quality setups.

Stop!Loss|Market View: EURUSD🙌 Stop!Loss team welcomes you❗️
In this post, we're going to talk about the near-term outlook for the EURUSD currency pair☝️
Potential trade setup:
🔔Entry level: 1.19043
💰TP: 1.19701
⛔️SL: 1.18587
"Market View" - a brief analysis of trading instruments, covering the most important aspects of the FOREX market.
👇 In the comments 👇 you can type the trading instrument you'd like to analyze, and we'll talk about it in our next posts.
💬 Description: The US dollar remains under pressure early this week, and this trend is likely to continue until at least mid-week. Against this backdrop, euro buyers are effectively pushing toward resistance at 1.18960, which will likely lead to an upward breakout toward 1.19 and 1.2. A buy entry is being considered through a breakout.
Thanks for your support 🚀
Profits for all ✅

Silver have more room to surgeSilver briefly surged to a new record high, exceeding 116 USD/ounce, before consolidating around 110 USD/ounce, propelled by escalating geopolitical tensions initiated by the US. Markets anticipate a "polycrisis" as the new paradigm, disrupting the post-World War II global order. Consequently, investors are diversifying away from Gold into other precious metals, such as Silver and Palladium.
The Gold/Silver ratio collapsed from a peak of 110 to 46, trending toward the 2011 low of 32. Persistent geopolitical risks could drive prices to the 160–200 USD/ounce range. Silver maintains a high correlation with Gold but exhibits a higher standard deviation, which may amplify price gains—particularly as supply deficits loom due to surging demand from the energy transition and AI infrastructure.
Technically, XAGUSD retreated to test the EMA21 before rebounding above both expanding EMAs, signaling a continued uptrend.
If price surpasses the recent swing high, XAGUSD could target the 227.2% Fibonacci extension at 131.
Conversely, failure to sustain levels above the EMA21 may trigger a retest of the lower trendline boundary.
By Van Ha Trinh - Financial Market Strategist at Exness

#GBPJPY , Another Short ??📊 Morning Market Brief | London Session Prep
🔎 Instrument Focus: #GBPJPY
⚠️ Risk Environment: High
📈 Technical Overview:
Maybe , We can have GJ again but this time would be so Risky.
🚀 Trading Plan:
• Check Momentum around Entry point . if it be high momentum , SKIP IT
• LTF ENTRY NEEDED
🧠 Stay updated with real time news and macro events, visit 👉 @News_Ash_TheTrader_Bot
#Ash_TheTrader #Forex #EURUSD #MarketInsight #PriceAction #TradingPlan #RiskManagement #LondonSession #Scalping #Futures #NQ #Gold
