Possible trend reversal confirmation and next resistance levels*DISCLAIMER: I am not a financial advisor and this is not financial advice as these are purely my opinions and speculations. You should always do your own due diligence before trading or investing.
*Follow me for the latest cryptocurrency analyses on my watchlist
*Thank you to those who donated, I very much appreciate it.
*Let me know in the comment section if you agree or disagree, would love to hear your ideas too.
COMPUSD


✳️Compound/USDT (27/10) #COMP $COMP #COMPUSDTCOMP is continuously breaking the lowest levels so we should not expect too much on this coin.
Currently, selling pressure has subsided and COMP is looking to rebound with Inverse Head & Shoulders. This pattern will be formed if the COMP fails to break the 92$ bottom and bounce back to break the 108$ zone. The target is the 120$ zone.
The main trend of COMP is currently moving sideways in the 90-120$ zone.
COMP will continue to bottom out if it breaks below 90$

Compound (COMP) - October 10Hello?
Hello, traders.
"Like" is a huge force for me.
By "following" you can always get new information quickly.
Thank you for always supporting me.
-------------------------------------------------- -----
At this time, the downtrend cannot be seen as overflowing.
You have to wait until you get the same flow as A.
You need to make sure it can move like the B flow shown on the Volume indicator.
I think we can say that we are out of the downtrend by going sideways by rising above 162.08 points on the current chart.
-------------------------------------------------- -------------------------------------------
** Check support, resistance, and abbreviation points.
** Support or resistance is based on the closing price of the 1D chart.
** All explanations are for reference only and do not guarantee profit or loss on investment.
Explanation of abbreviations displayed on the chart
R: A point or section of resistance that requires a response to preserve profits
S-L: Stop-Loss point or section
S: A point or segment that can be bought for generating profit as a support point or segment
(Short-term Stop Loss can be said to be a point where profits and losses can be preserved or additionally entered through installment trading. You must trade from a short-term investment perspective.)

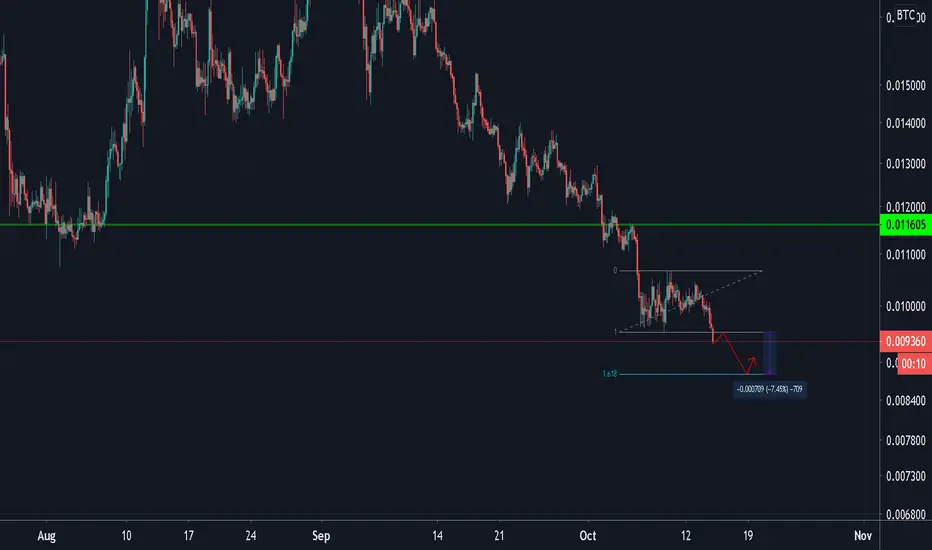
COMP/BTC (4H TF Bear Flag?)💎Technical Analysis Summary💎
BINANCE: COMPBTC
-After breaking the key level of support at 0.0116 sat
-The price keeps falling and now it is also breaking its local support
-This could be a small Bear flag that could fall the price down to 0.0088 sat
-If you are waiting for a trend reversal, it might take more days or even weeks
-But if you are playing on the Bearish side
-This might be a trigger event on your strategy
A big Thanks for donating 💰 via Tradingview coins this week to billstenzel 🙏🎉
``````````````````````````````````````````````
Trading Involves High Risk ⚠️
Not Financial Advice 💸
Please Exercise Risk Management 💱
``````````````````````````````````````````````
Thank You All!🙏😊💖For Supporting My Channel 📺
Through Leaving A Thumbs Up, Comment & Follow 💬
Happy Trading!😊💕💖
``````````````````````````````````````````````
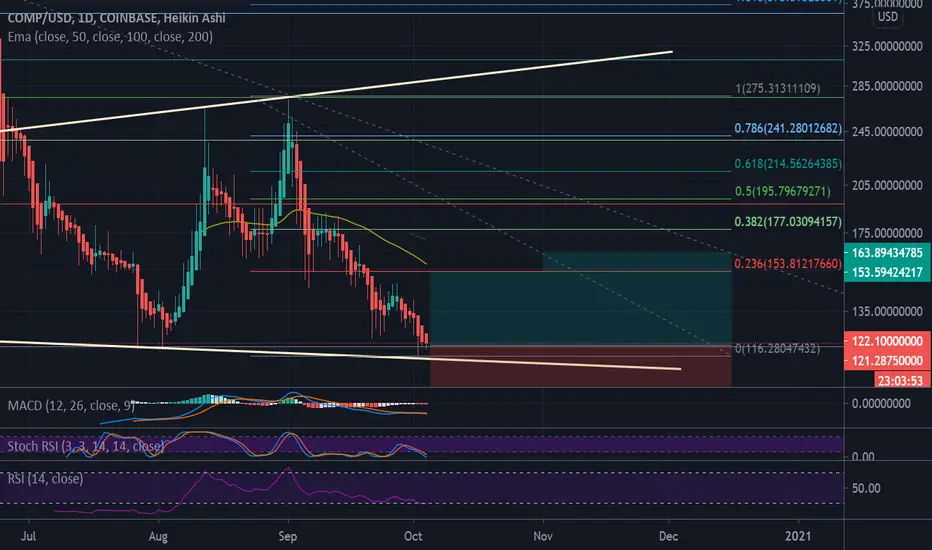
Looking for THESE confirmations of a reversal*DISCLAIMER: These are purely my speculations and not financial advice. You should always do your own due diligence before trading or investing.
*Follow me for the latest cryptocurrency analyses on my watchlist
*Thank you to those who donated, I very much appreciate it.
*Let me know in the comment section if you agree or disagree, would love to hear your ideas too.


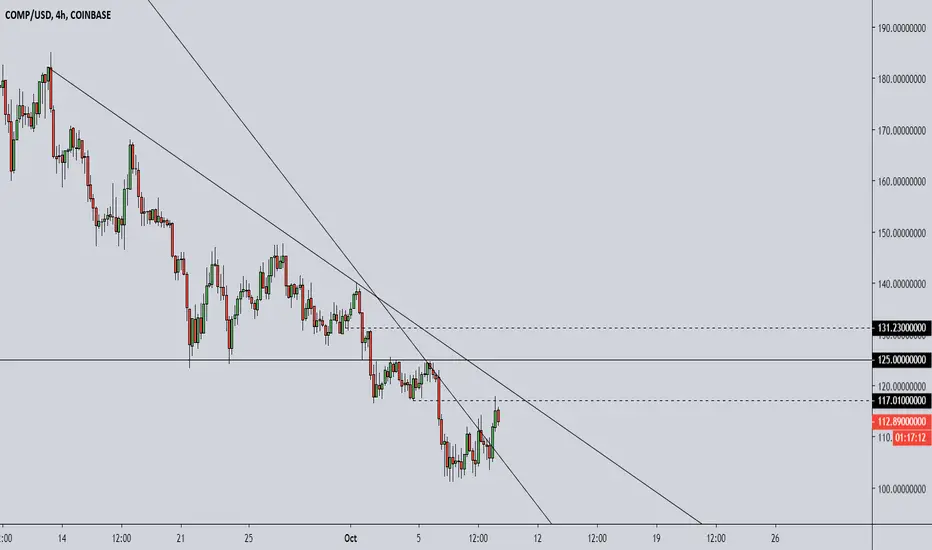
Bullish signals invalidated - expecting more downsideThe current situation:
1. Price action previously formed a double bottom on the 4HR chart, but once it got to the neckline at about 124 USD, it was rejected and apparently does not have the strength to break out. Currently, it looks more like a double top with a measured move of 110 USD from the neckline at about 117 USD.
2. There was bullish divergence on the 4HR chart, but that did not seem to have played out strong enough to get above the double-bottom neckline.
The bullish case: price action retries and breaks the double-bottom neckline towards and goes towards the measured target of about 132 USD
The bearish case: price action breaks below the double-top neckline and goes toward the measured target of 110 USD
*Thank you to those who donated, I very much appreciate it.
*Let me know in the comment section if you agree or disagree, would love to hear your ideas too.
*These are purely my speculations and not financial advice. You should always do your own due diligence before trading or investing.

COMPUSD Longfirst target for compusd... macd and rsi on the daily look prime to atleast make a rebound with a potenial confirmed double bottom.

Long COMPUSDlooking to take profit on at the very least a relief bounce... A risk/reward 3-1 target here looks very nice.

COMP vs USDT ---LONG--- 01.10.20#COMPUSDT
Buy at: 135 - 136
Amount: 3% from deposit
Target:
1) 146
2) 155
3) 165
SL: below 127

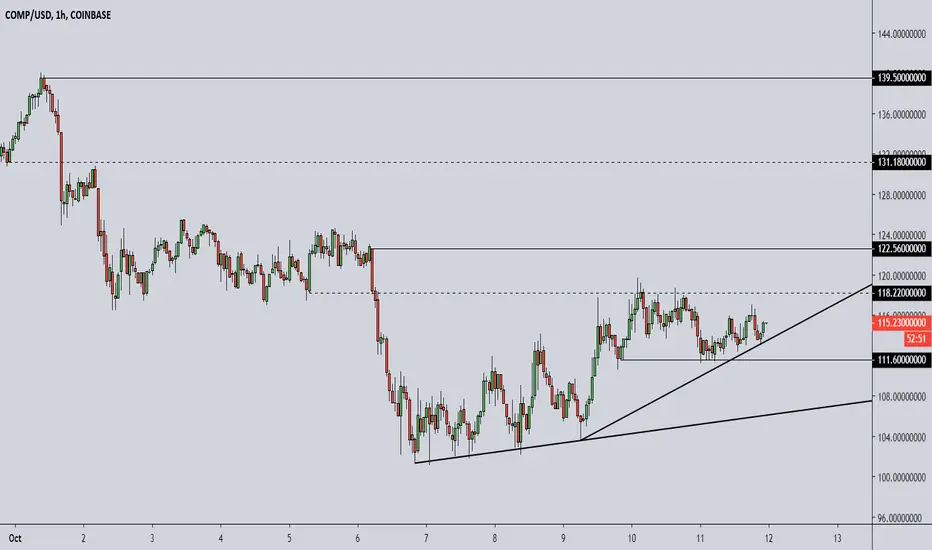
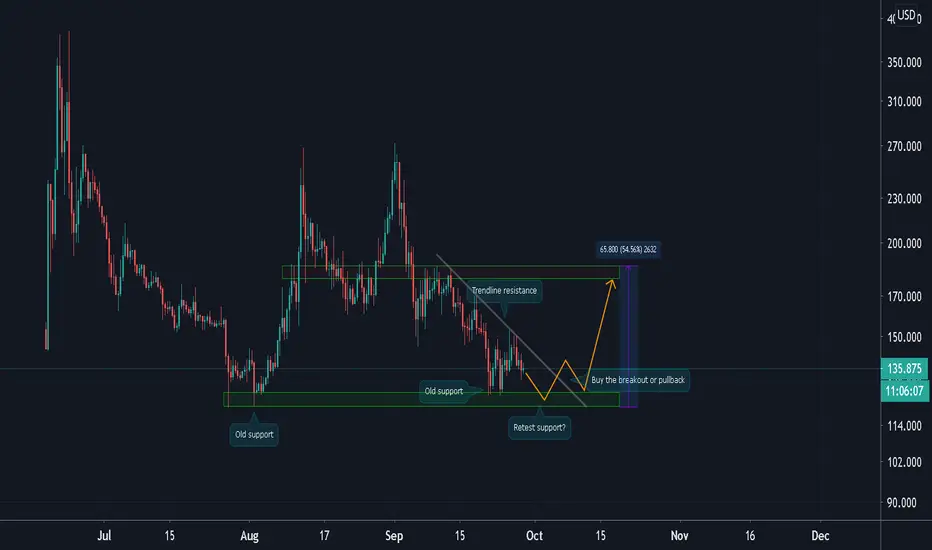
COMP/USD (Retest Key Area of Support?)💎Technical Analysis Summary💎
FTX: COMPUSD
-Compound Token is unable to break the trendline resistance
-It is facing rejection and might retest key level of support at 120s area
-My advice is to wait for the proper upside breakout before planing your entry
-You may look to enter with momentum breakout or wait for a pullback
-The upside potential is up to 180s area of higher
``````````````````````````````````````````````
Trading Involves High Risk
Not Financial Advice
Please Exercise Risk Management
``````````````````````````````````````````````
If You Like My Daily Published Ideas
A little Help By Supporting My Channel
Through Leaving A Thumbs Up, Comment & Follow
Happy Trading! --> Thank You! :)
``````````````````````````````````````````````
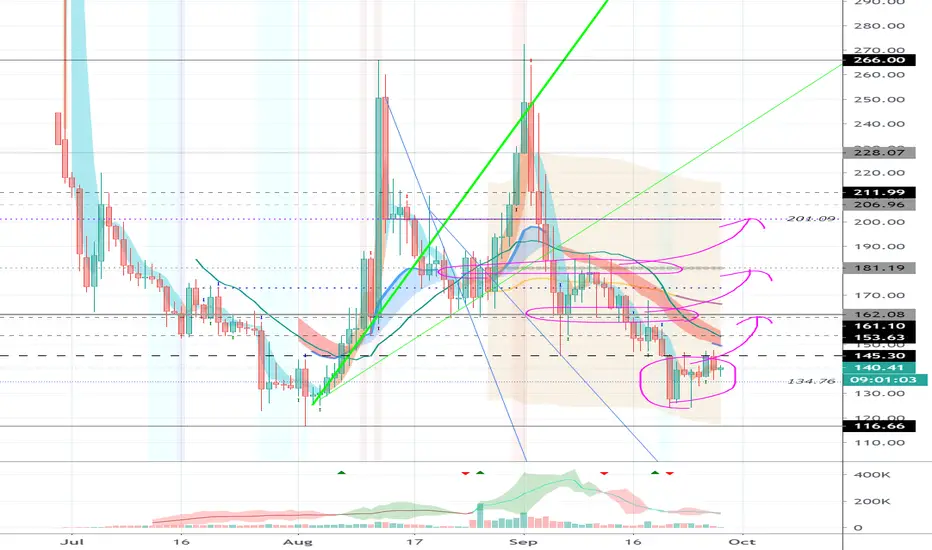
Compound (COMP) - September 28Hello?
Dear traders, nice to meet you.
"Like" is a huge force for me.
By "following" you can always get new information quickly.
Thank you for always supporting me.
-------------------------------------------------- -----
It remains to be seen if it can rise above the 145.30 point to form a double bottom.
We should also see if we get support at 145.30 and climb, allowing for a cascading climb as shown in the chart.
The important point in our current location is at 162.08.
If you climb above the 162.08 point and get support, I think it is possible that the bottom section has been formed.
-------------------------------------------------- -------------------------------------------
I think it is a period of volatility from September 21st to October 1st.
Therefore, I think careful trading is necessary.
About October 28, when maximum volatility is expected to occur, is about a month left.
The most important thing is to generate revenue, so I think it's time to trade to earn money.
** Check support, resistance, and abbreviation points.
** Support or resistance is based on the closing price of the 1D chart.
** All explanations are for reference only and do not guarantee profit or loss on investment.
Explanation of abbreviations displayed on the chart
R: A point or section of resistance that requires a response to preserve profits
S-L: Stop-Loss point or section
S: A point or segment that can be bought for profit generation as a support point or segment
(Short-term Stop Loss can be said to be a point where profits and losses can be preserved or additionally entered through installment trading. You should trade from a short-term investment perspective.)

comp/usdt compound double bottom #long #bullishcomp/usdt dumped hard recently from 270$ to 125$
now its trading around 143-144
double bottom is clear in chart
we will buy the break of resistance around 148$
entery now at 144 is higher risk
targets :
152.5
159
165
175
after you buy stop should be 4H candle close below 137.98
good luck
if you like my ideas hit like button and follow
show your opinion in comment section below

COMP/USD towers above major cryptos like Bitcoin eying $260
Compound begins the new month in style, breaking above $250.
Compound must rise above $260 to sustain the bullish case and avoid a potential double-top pattern breakdown.
Compound, one of the major decentralized finance (DeFi) tokens is a consistent upward roll following the key support embraced at $160. The support came in handy after the token spiraled from highs above $260 (a high formed on August 12). The decline was also consistent with various tentative support areas at $220 and $200 and $180 failing to rise to the occasion.
Compound is among the leading cryptocurrencies in the DeFi ecosystem. It is an Ethereum based token mainly used for lending. According to DeFi Pulse, an aggregator platform, COMP is currently the seventh-largest DeFi token. About $766 million of funds are currently locked in in Compound, trailing protocols like Yearn.finance and Synthetix. Aave continues to dominate the DeFi space with $1.52 billion in total locked value followed by Maker at $1.48 billion.
Compound technical Picture
At the time of writing, COMP is hovering at $250. All eyes are locked on breaking past the next key hurdle at $260. With the Relative Strength Index (RSI) moving higher above 70, there is a high probability that the token would in the near term climb above $260. The same bullish scenario is supported by the Moving Average Convergence Divergence (MACD). Besides, extending the action higher within the positive region, a bullish divergence above the MACD signals that buyers have the upper hand.
On the downside, if the resistance at $260 is not broken, an early spotted double-top pattern could pull Compound downwards, retesting possible support areas at $220, and $200. Meanwhile, seeking support above $250 or even $240 should be key among the bulls as it would give them an opportunity to stage a formidable attack on $260 and $280 respectively.
Compound Intraday Levels
Spot rate: $248
Relative change: 5.10
Percentage change: 2.27%
Trend: Bullish bias
Volatility: High

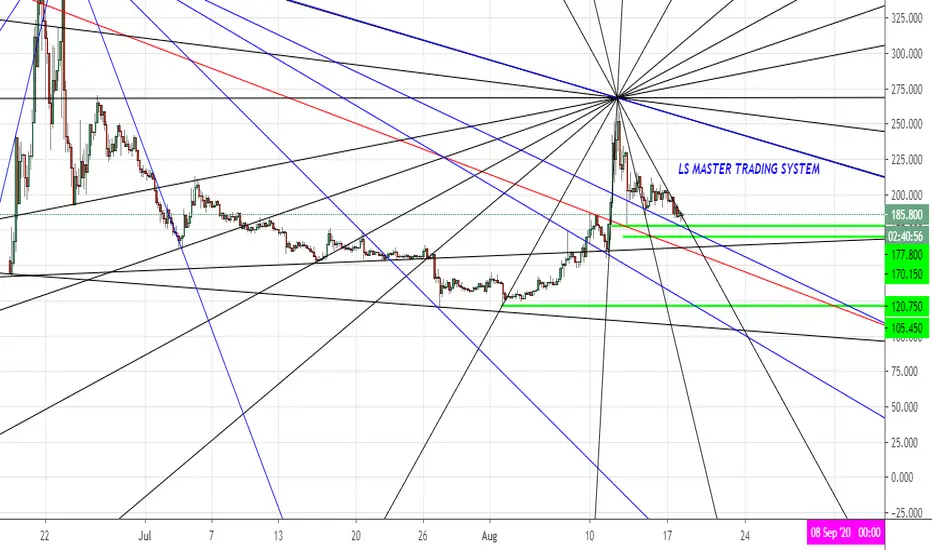
Crazy COMPOUND potential !COMP show interesting signs after retrace Wave 1 to 0.618 FIB. Same for COMPBTC pair.
Potential looks crazy even considering first Wave 3 target at 1.618 (based on Elliot waves analysis). DeFi hype could help.
We do not have a lot of datas for the moment so we have to follow. Let's see
See u

Comp... will it dump ?If expecting further downside but thinking it will find support at the previous level of support

COMP-USDT ( ATTENTION ) Compound breaked down from the trendline after that made an fake jump to the uptrend and rejected. COMP is still in downtrend guys. Buy zone is only and only after breakout. For people which is holding this coin i prefer to use stop loss at the shared area.
If you like my analyse and if you want to get more analyses from me, please don't forget to push like to this post.