COMP/USDT — Final Accumulation Zone Before the Next Macro Move?
“History doesn’t repeat, but it often rhymes — COMP returns to the same accumulation box that launched previous rallies.”
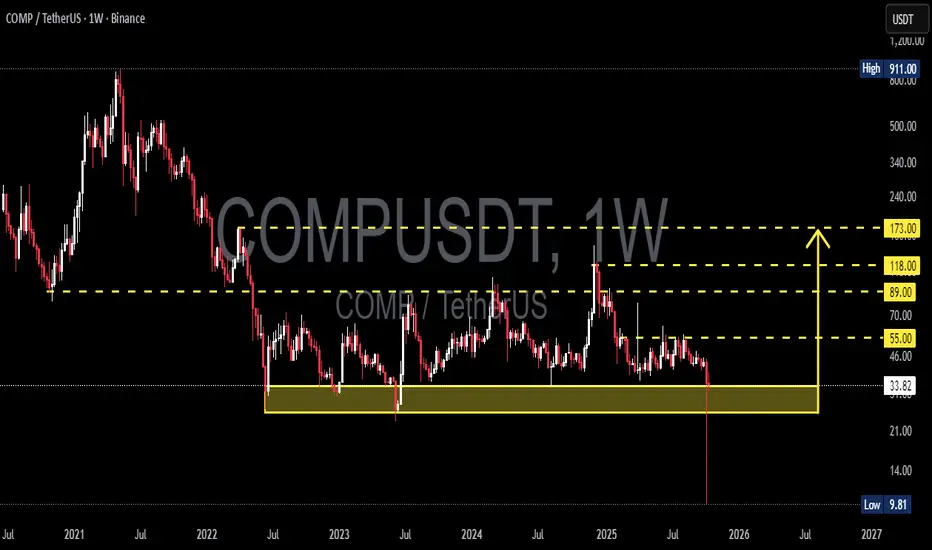
For more than two years, COMP has been trading inside a wide multi-year range, and price has once again reached the major accumulation zone at 33.5 – 25.5 USDT (yellow block).
This area has acted as a strong demand base since 2022 — every touch within this zone has historically triggered sharp rebounds.
Now, COMP is back at the exact same level — and the market is asking one critical question:
Is this the beginning of a new macro cycle, or the last breakdown before capitulation?
---
📊 Technical Structure & Pattern
Demand Zone (33.5 – 25.5 USDT): Long-term support where buyers have consistently stepped in.
Multi-Year Range: Extended consolidation suggests major supply exhaustion and possible accumulation by strong hands.
Deep Wick (~9.8 USDT): Indicates a historical liquidity sweep — often a signal of final bottom testing.
Layered Resistances: 55 → 89 → 118 → 173 USDT — potential upside targets once momentum shifts.
---
📈 Bullish Scenario — “The Rebirth Setup”
If COMP manages to hold above 25.5 USDT and forms a strong rejection candle, the stage could be set for a major macro reversal.
Initial confirmation: Weekly bounce or bullish engulfing within 33.5–25.5 USDT.
Trigger for continuation: Weekly close above 55 USDT.
Target zones: 55 → 89 → 118 → 173 USDT.
This structure represents a potential transition from accumulation to markup phase,
where renewed attention could return to DeFi blue-chip projects like COMP.
> “If this box holds, COMP could mark the start of a new macro cycle — a quiet base before the next major wave.”
---
📉 Bearish Scenario — “The Last Line of Defense”
Failure to hold this yellow zone could be critical.
If COMP closes a weekly candle below 25.5 USDT, it would signal a breakdown of the long-term structure,
potentially opening the door toward the psychological 10 USDT area.
Such a breakdown would confirm the failure of the multi-year accumulation,
possibly leading to a final capitulation event before any long-term recovery can begin.
---
📍 Conclusion
COMP is now standing at a decisive turning point.
Holding above 25.5 → potential macro reversal.
Breaking below 25.5 → deeper downside risk toward single digits.
> “The market is testing conviction — this 33.5–25.5 USDT zone will decide who’s positioned for the next major move.”
---
#COMP #Compound #Crypto #DeFi #AccumulationZone #MacroCycle #TechnicalAnalysis #ReversalSetup #SwingTrading #CryptoMarket
Compusdtsignal
COMP/USDT — Accumulation Zone That Will Define the Next Big MoveCOMP/USDT is currently at a critical crossroads.
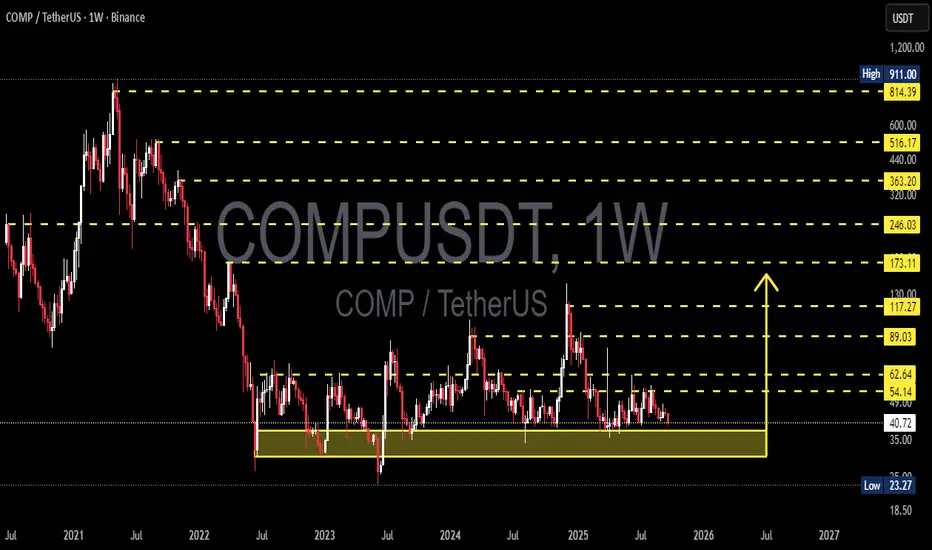
For months, price has been consolidating inside the long-term accumulation range between 23.27 – 40.88 (yellow box). This area has acted as a historical demand zone since 2022, and multiple retests have reinforced its importance.
Such prolonged sideways movement often signals an accumulation phase, where the market builds up energy before a significant breakout or breakdown. The direction of this move could define COMP’s trend for the coming months or even years.
---
🔹 Structure & Market Dynamics
Main trend: COMP has been in a macro downtrend since its 2021 peak, but now forming a potential accumulation base.
Strong range: 23.27 – 40.88 is a multi-tested support box that holds the key to the next move.
Key resistance: 54.14 – 62.64 is the crucial breakout zone. A close above this will shift mid-term momentum to the bulls.
Potential move: Long consolidations like this usually lead to explosive breakouts once the range is broken.
---
🔺 Bullish Scenario
1. Trigger: Weekly close above 62.64 with strong volume → signals bulls regaining control.
2. Targets:
Measured move projection: ~58.5 (first step).
If momentum follows: 89.03 → 117.27 → 173.11.
3. Reversal confirmation: Formation of higher highs & higher lows on the weekly timeframe could mark the start of a new bullish cycle.
---
🔻 Bearish Scenario
1. Trigger: Weekly close below 23.27 → confirms demand exhaustion.
2. Impact: Breakdown from this long-term support may trigger a capitulation sell-off, driving prices much lower.
3. Confirmation: Repeated rejection from resistance + rising sell volume would validate continuation of the bearish trend.
---
🎯 Key Takeaways
The longer the consolidation, the bigger the potential breakout.
23.27 (support) and 62.64 (resistance) are the two most important levels to watch.
Traders can use this area for measured accumulation with tight risk controls, or simply wait for confirmation of breakout/breakdown before positioning with the trend.
---
📌 Conclusion
COMP is at a critical inflection point. A breakout above 62.64 could open the door for a multi-layered bullish rally toward 173+. On the flip side, a breakdown below 23.27 would likely extend the bearish cycle and push COMP into new lows.
This 23–40 zone is where the ultimate battle between buyers and sellers is taking place — and the outcome will decide COMP’s long-term trajectory.
---
#COMP #COMPUSDT #Compound #Crypto #Altcoins #DeFi #TechnicalAnalysis #PriceAction #WeeklyChart #CryptoTrading
COMPUSDT in a Strong Demand Zone! Reversal Potential / Breakdown🔍 In-Depth Analysis (Timeframe: Weekly / 1W)
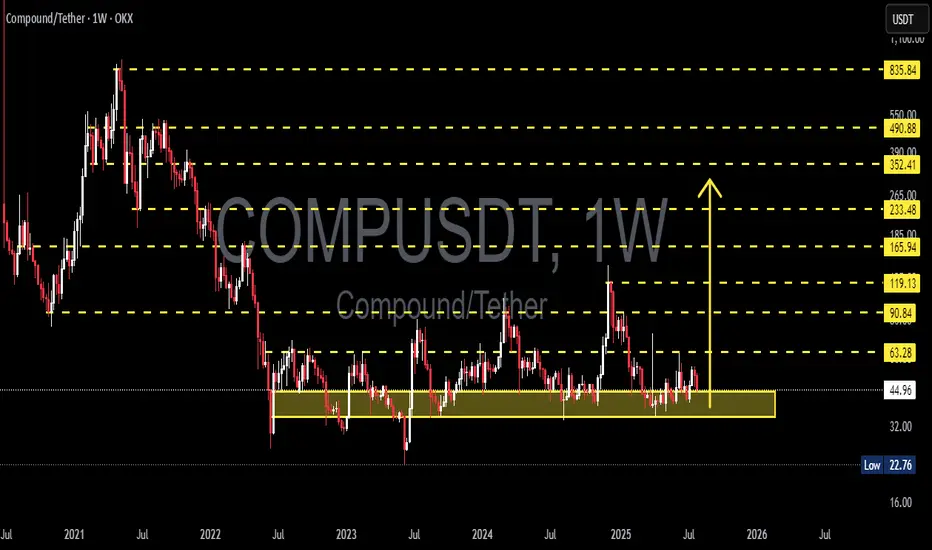
The COMP/USDT pair is currently hovering above a long-term demand zone that has held strong since mid-2022. Price is sitting around $44.90, just above the key support area of $32 – $45 (highlighted in yellow), which has acted as a major accumulation zone for over 2 years.
🧱 Critical Zone: Smart Money Accumulation or Exhaustion?
The $32–$45 demand zone has been tested multiple times, indicating smart money interest and hidden buying pressure.
Price action in this range forms a clear base structure or horizontal accumulation pattern, a classic setup before a large directional move.
However, the prolonged sideways consolidation hints at an imminent breakout or breakdown — momentum is building.
---
📊 Key Technical Pattern:
🟨 Rectangle Range (Accumulation Structure)
Price has been ranging between $32 and $63.28 with no clear breakout.
Strong rejections every time price dips below $35 indicate consistent buyer defense.
🔃 Mean Reversion Behavior
Repeated moves back to the mid-range reflect an indecisive market (equilibrium phase), often seen before expansion.
---
📈 Bullish Scenario (Potential Reversal):
If price breaks above major resistance at $63.28:
1. Upside Targets:
🎯 $90.84 (key resistance zone)
🎯 $119.13 (prior distribution zone)
🎯 $165.94 (macro target if sentiment turns highly bullish)
2. Confirmation needed via weekly close above $63 with strong volume.
3. A bullish breakout may form a new Higher Low and Higher High structure on both daily and weekly timeframes.
🟢 Bullish confirmation: Weekly bullish engulfing + volume breakout above $63.
---
📉 Bearish Scenario (Potential Breakdown):
If price closes below the $32 support:
1. Possible downside targets:
⚠️ $22.76 (next logical support)
🚨 $16 (last consolidation base pre-2021 rally)
2. A break below this long-term support could trigger a final capitulation flush before a potential macro reversal.
🔴 Bearish confirmation: Weekly close below $32 with increased volume and sustained selling.
---
⚖️ Strategic Takeaway:
COMP/USDT is currently at a pivotal decision zone — a crossroads between massive upside potential and deeper downside risk.
This is not just another support area, it’s a macro-level demand zone that will likely dictate trend direction in the coming months.
⏳ A major move is brewing — whether breakout or breakdown, be ready.
#COMPUSDT #CryptoOutlook #TechnicalAnalysis #AltcoinSeason #DeFi #CryptoTrading #AccumulationZone #BreakoutSetup #BearishScenario #BullishSetup #CryptoAnalysis
COMPUSDT Accumulation Ending? Massive Bullish Reversal Ahead!
🧠 Weekly Analysis
After peaking near $911 in 2021, COMPUSDT experienced a prolonged downtrend, followed by a wide sideways accumulation phase around the $33–$41 range.
📉 This consolidation has formed a classic Wyckoff Accumulation structure, often seen before strong bullish reversals.
🟨 Key Support & Demand Zone:
🔻 Accumulation Zone: $33–$41
This range has acted as a strong floor since mid-2022.
Multiple rejections from this zone hint at smart money accumulation.
Recent long wicks and bullish rejections from this zone signal a potential reversal brewing.
🔮 Bullish Scenario:
If the price holds above the accumulation zone and breaks key resistance, the bullish case unfolds as follows:
📈 Bullish Price Targets:
1. ✅ $62.64 — First breakout confirmation.
2. ✅ $89.03 — Minor resistance and psychological level.
3. ✅ $117.27 — Major historical resistance.
4. ✅ $173.11 — Medium-term target.
5. ✅ $246.03 — Potential full target from pattern projection.
6. 🚀 Extension Targets: $363–$516 in case of a strong altcoin rally.
🔥 Breakout Confirmation: Weekly candle close above $62.64 with volume surge.
🧨 Bearish Scenario:
If the $33 support zone breaks and closes below:
⚠️ Possible downside:
Drop toward $23.27 (2022 low)
Extreme scenario: retest of $17 zone
This invalidates the current bullish structure and resumes macro downtrend
📊 Patterns Observed:
🔹 Extended Accumulation Range
🔹 Potential Inverse Head & Shoulders (in development)
🔹 Double Bottom Structure (awaiting neckline breakout)
These patterns suggest a market gearing up for a major shift — but volume and breakout confirmation remain crucial.
📅 Summary & Strategy:
🟢 Entry Zone: $35–$42 (low-risk accumulation)
🟡 Breakout Zone: Above $62.64
🔴 Stop Loss: Weekly close below $33
➡️ Favorable risk-to-reward setup for mid- to long-term swing traders and investors.
💡 Watch for breakout volume and BTC’s direction for confluence.
#COMPUSDT #CryptoBreakout #AltcoinSeason #WyckoffAccumulation #SwingTrading #CryptoTechnicalAnalysis #COMP #BreakoutSetup #CryptoAnalysis #BullishStructure

COMPUSDT 1D AnalysisCOMP ~ 1D Analysis
#COMP Buy gradually from here if you still have a Conviction on this coin with a short -term target of at least 10%+ from here.

COMPUSDT 1WCOMP ~ 1W Analysis
#COMP Buy back from here with a short -term target of at least 20%+. This is a very good support for now.

COMPUSDT 1WCOMP ~ 1W Analysis
#COMP Buy gradually from here if you still have a Conviction on this coin with a short -term target of at least 20%+.

COMPUSDT 1WCOMP ~ 1W Analysis
#COMP Buy gradually from here if you still have a Conviction on this Coin with a minimum target of 20%+.

COMPUSDT 1WCOMP ~ 1W
#COMP So far it continues to maintain its Bullish structure. Buy in stages from here. This decline confirms this is wave 2 for the Eliot Wave pattern
COMPUSDT: Volume Spike & Buyer ZonesCOMPUSDT is showing a serious volume spike, signaling strong market interest and potential accumulation. These green boxes highlight key buyer opportunity zones, where demand could push the price higher.
Why These Zones Matter:
Volume Confirmation: The recent surge in volume suggests active participation, often a precursor to significant price movement.
Historical Support Levels: The green boxes align with areas where buyers previously stepped in, providing strong support.
What to Watch For:
A bounce from these zones could signal the start of a bullish move.
Monitor volume closely; continued strength may confirm buyer dominance.
Patience is key if COMP holds these levels, it might set the stage for a promising rally.
I keep my charts clean and simple because I believe clarity leads to better decisions.
My approach is built on years of experience and a solid track record. I don’t claim to know it all, but I’m confident in my ability to spot high-probability setups.
My Previous Analysis
🐶 DOGEUSDT.P: Next Move
🎨 RENDERUSDT.P: Opportunity of the Month
💎 ETHUSDT.P: Where to Retrace
🟢 BNBUSDT.P: Potential Surge
📊 BTC Dominance: Reaction Zone
🌊 WAVESUSDT.P: Demand Zone Potential
🟣 UNIUSDT.P: Long-Term Trade
🔵 XRPUSDT.P: Entry Zones
🔗 LINKUSDT.P: Follow The River
📈 BTCUSDT.P: Two Key Demand Zones
🟩 POLUSDT: Bullish Momentum
🌟 PENDLEUSDT: Where Opportunity Meets Precision
🔥 BTCUSDT.P: Liquidation of Highly Leveraged Longs
🌊 SOLUSDT.P: SOL's Dip - Your Opportunity
🐸 1000PEPEUSDT.P: Prime Bounce Zone Unlocked
🚀 ETHUSDT.P: Set to Explode - Don't Miss This Game Changer
🤖 IQUSDT: Smart Plan

COMPUSDT 1WCOMP ~ 1W
#COMP There are two buying scenarios that you can do in conditions like this.
Wait for this red resistance line to be successfully broken through with strong volume then buy afterwards or you can buy during the retest of this support block. Minimum target 20%+
COMPUSD 1WCOMP ~ 1W
#COMP This Support Block has so far been able to hold the price of $Comp. Make purchases gradually from here, target at least 20%+

COMPUSDTThere has been a test of resistance already followed by a push downward. The current position is just a little retracement that gave us our entry. Expecting it to continue moving downward.

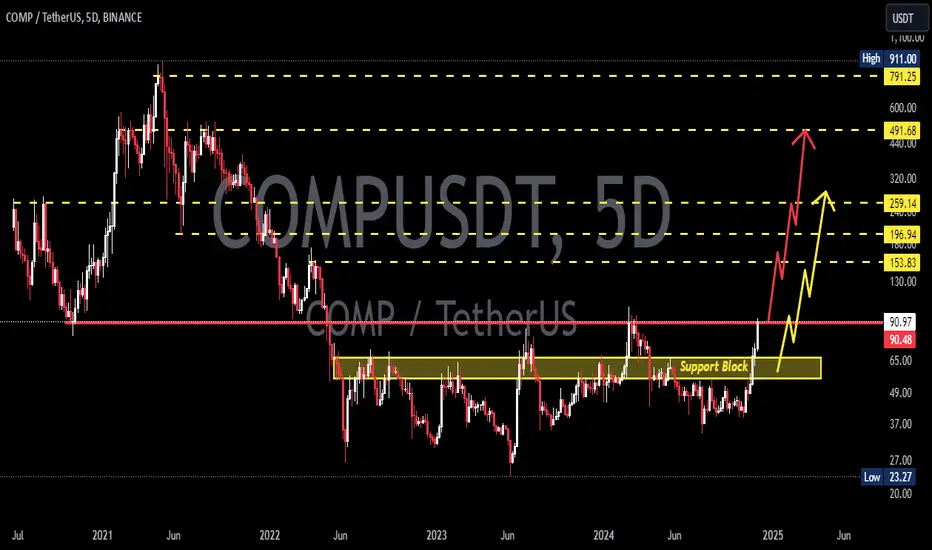
📊#COMP Huge upside potential, worth paying attention to👀➡️From the technical analysis point of view. 👀
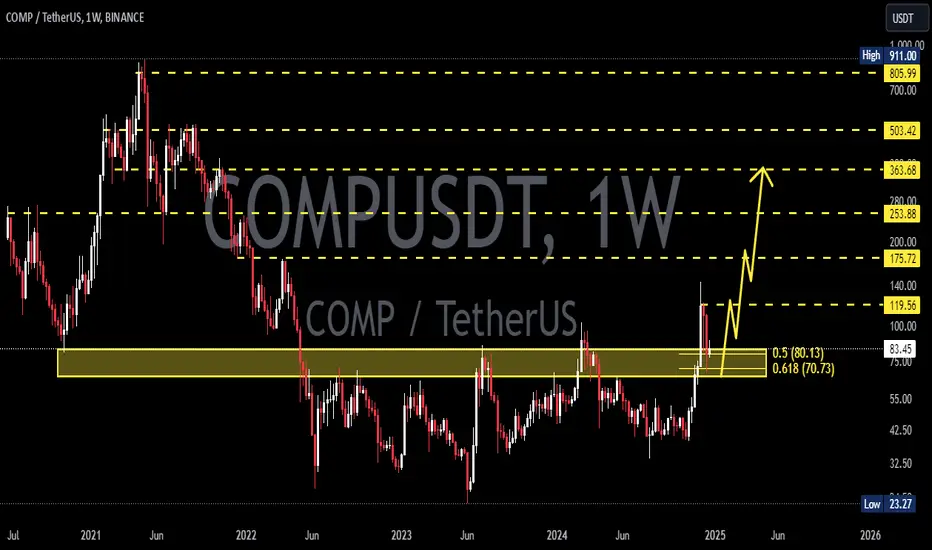
🧠After a long period of decline, we hit a record low in June this year, and the rebound effect was also very strong. Then we can use this to judge the validity of this low as a new historical low. We gradually built a line of defense in the subsequent adjustments, and formed a small double bottom structure and started to move higher, but we can easily find from the chart that our increase was not too large, compared with other coins.
➡️Assumptions:
🧠If we can break through the key point 55, then we may break through the H point above. If the H point is successfully broken through, then we will challenge the short defense point above. If the short defense point is broken through, it means If the short structure is destroyed and there is no short structure as an obstacle, then the previous high will most likely be broken through. If the previous high is broken through, then the smiley face bullish structure will be established. If this bullish structure is established, then the mid-term TP zone will be It may be possible, and even higher target areas can be expected. ✔️
➡️Let’s look at it from fundamental analysis👀
You should know that COMP is an algorithm-based automatic interest rate system built on the Ethereum blockchain. If we refer to the increase in ETH, the possibility of subsequent compensatory increases in COMP is very high. Therefore, we can also use this to horizontally refer to ETH to find future goals. 🎯
👆To sum up, if my prediction comes true, then we will have the best entry opportunity near the buying zone, because once we miss this buying zone, you will find that when you want to buy again , its purchase cost will only deter you. So we can use DCA to make purchases near the buying area.
⚠️Note that if our bullish defense level is broken, this bullish idea will be invalidated. ❌
💰🍻I have helped everyone make money, so I hope you can also help me. Please remember to like❤️share my analysis posts . 📤

COMP/USDT Bounce with strong green candle, Potential back to UP!💎 COMP has recently experienced notable market dynamics, particularly with a bounce from a support area.
💎 A strong green candle suggests potential upward movement, with a key resistance level at $80.7 needing to be breached for further bullish momentum toward our target strong resistance area.
💎 However, failure to break this resistance could lead to a retest of the support area, potentially creating a new momentum for a breakout.
💎 Should COMP fail to bounce from the support, the next stop would be the demand area around $55.8. COMP must bounce from this area and reclaim the price above the support to sustain the upward movement.
On the contrary, a breakdown below the demand area and the support trendline would confirm a bearish sentiment, likely resulting in further downward movement.

COMP/USDT Breakout the pattern, Ready to continue upward ??💎COMP has undoubtedly attracted significant attention in the market. Currently, it has broken out of the resistance trendline, signaling a bullish momentum.
💎 However, there is potential for a retesting phase before the price continues its upward movement. In such a scenario, COMP probability may return to the strong resistance area, especially considering the overall trend appears to be massively bullish.
💎 On the flip side, if COMP fails to bounce when undergoing the retesting phase at the trendline or even breaks down the bullish trend support, this could be concerning. A broken bullish trend would indicate a shift to a downward movement, and the next target would be the Bullish OB area.
💎 When COMP reaches the Bullish OB area, it is crucial for it to bounce from this level. To sustain the upward movement, COMP would need to reclaim the area above the bullish trend support. Failure to do so may result in the demand area breaking down, leading to further downward movement in the price.

COMPUSDT Elliott Waves Analysis (Investment Idea)Hello friends.
Please support my work by clicking the LIKE button👍(If you liked). Also i will appreciate for ur activity. Thank you!
Everything on the chart.
Main(investment) target zone: 850 - 1000$
Targets: 200 - 400 - 900
Cancellation of setup - consolidation under ~25
RR: 1 to ~30
risk is justified
Good luck everyone!
Follow me on TRADINGView, if you don't want to miss my next analysis or signals.
It's not financial advice.
Dont Forget, always make your own research before to trade my ideas!
Open to any questions and suggestions

COMP/USDT Could COMP break the key area or rejected ??💎 COMP has been a major point of interest in the market, especially as it approaches a strong supply area. Historically, COMP has struggled to break through this formidable resistance. A successful breach of the supply area could lead to a significant upward trend, potentially taking COMP towards our target in the Bearish OB area.
💎 However, if COMP finds itself unable to break out of the supply area and instead consolidates at the resistance level over the next few days, there's a chance it might face rejection again. This could lead to a retracement back towards the support trendline of the bullish, or ascending, channel.
💎 In the support trendline area, COMP needs to demonstrate a robust recovery to attempt another breakout of the supply area. Failure to maintain the support trendline, leading to a breakdown of the pattern, would be a concerning signal. Such a scenario could result in a significant downward movement for COMP, potentially heading towards the demand area.
💎 The demand zone becomes vital for COMP to show a strong rebound and attempt to reclaim support, thereby facilitating a continued upward movement to challenge the resistance area. If COMP fails to respond positively in the demand area and breaks down further, it could signal a shift back to a bearish trend, possibly leading to a descent towards the strong support area.

COMPUSDT Elliott Waves AnalysisHello friends.
Please support my work by clicking the LIKE button👍(If you liked). Also i will appreciate for ur activity. Thank you!
Everything on the chart.
Entry: market and lower
Targets: 84 - 90 - 95
after first target reached move ur stop to breakeven
Stop: ~59 (depending of ur risk). ALWAYS follow ur RM .
RR: 1 to 4
risk is justified
Good luck everyone!
Follow me on TRADINGView, if you don't want to miss my next analysis or signals.
It's not financial advice.
Dont Forget, always make your own research before to trade my ideas!
Open to any questions and suggestions

COMPUSDT - if break goes plummet
preconditions for well break a trendline.
1. Beautiful a trendline
2. Historical level the daily chart
3. Nead confirmation a sell zone
I have two scenarios, and I want to make some money.
if you like the idea, please "Like" it. This is the best "Thanks!" for the author 😊 P.S. Always do your own analysis before a trade. Put a stop loss. Fix profits in installments. Withdraw profits in fiat and please yourself and your friends.

COMPUSDMy bias for COMPUSD still remains bearish as the previous low is already broken. I was taken out from my first initial trade due to a tight stop loss. A re-entry is taken with my target still my previous target.

COMP getting support and aiming 52!1D time frame
-
COMP just got support from uptrend.
This is a good buying opportunity.
Do not miss it!
Target: 52~54
SL: 29.6

COMPUSDT Elliott Waves AnalysisHello friends.
Please support my work by clicking the LIKE button👍(If you liked). Also i will appreciate for ur activity. Thank you!
Everything on the chart.
Entry: market and lower
Targets: 65 - 80 - ~95
after first target reached move ur stop to breakeven
Stop: ~36 (depending of ur risk). ALWAYS follow ur RM .
RR: 1 to 8
risk is justified
Good luck everyone!
Follow me on TRADINGView, if you don't want to miss my next analysis or signals.
It's not financial advice.
Dont Forget, always make your own research before to trade my ideas!
Open to any questions and suggestions
