EURUSD Timeframe Conflict: Which direction is in play?Hi Traders!
EURUSD is trading at a higher-timeframe resistance near 1.18000. While monthly structure remains bullish, and may resemble a bullish flag, continuation has not yet been confirmed.
On the weekly timeframe, price seems to be in a range beneath resistance. Momentum has clearly slowed which puts price in consolidation rather than immediate continuation.
However, as I move down to the daily timeframe, the story may be different. With price failing to swing higher than 1.18000, a new bearish daily CHOCH has formed with a new higher low. If the daily bearish CHOCH is true, I'm looking for price to reach around that area for a retest, and possibly continuing a deeper pullback before any higher-timeframe attempt.
In addition, with DXY taken into consideration, it looks to me that price is attempting to make a double bottom on the weekly without a clear close below 97.500. This to me can seem like price may take another attempt at 100.000. Therefore, if the daily bullish CHOCH that was created is true, I am looking for a retest around 98.850 with signs of continuation.
A swing trade on EURUSD could be in play if my confirmations align. But for now, alerts are set near the bearish daily CHOCH, and DXY's bullish CHOCH.
If you've read this far, thank you! Leave a comment on what you think is possible!
*DISCLAIMER: I am not a financial advisor. The ideas and trades I take on my page are for educational and entertainment purposes only. I'm just showing you guys how I trade. Remember, trading of any kind involves risk. Your investments are solely your responsibility and not mine.*
Confirmation

EURAUD - Shorts Played, Now Watching the Other SidePreviously, this one was pretty straightforward.☀️
📉As EURAUD approached the upper bound of the falling channel, the bias was clear, we were looking for shorts, and price reacted perfectly from that area.
Fast forward to now, and context has changed.
Price has pushed all the way down into a strong confluence:
• The lower bound of the falling channel
• The previous weekly low (also demand zone)
At the moment, we’re seeing rejection from the lower channel, suggesting selling pressure may be slowing down.
⚔️As long as this area continues to hold, my focus shifts from selling rallies to looking for longs, targeting a rotation back toward higher levels inside the range.
This doesn’t mean blind buying... it means waiting for confirmation on lower timeframes and letting the market prove that bulls are stepping in.
⚠️ Disclaimer: This is not financial advice. Always do your own research and manage risk properly.
📚 Stick to your trading plan regarding entries, risk, and management.
Good luck! 🍀
All Strategies Are Good; If Managed Properly!
~Richard Nasr

The Sun May Be Setting On EJ's Break of HighsOANDA:EURJPY has made an impressive Bullish Rally after breaking out of the Resistance that was holding price down around 183 - 183.1, but currently seems to be showing a great deal of exhaustion with a strong Bearish Reversal pattern forming, the Evening Doji Star!
The Evening Doji Star consists of 3 candlesticks:
1) Large Bullish Candle
2) Doji Candle
3) Large Bearish Candle
If Bears are able to Close this candle strong down at the Lows of the large Bullish Candle that started the pattern, this will be great Confirmation of the pattern and we can expect that price will continue to push down!
The next level of structure expected to be visited will be the Previous Resistance at the 183 - 183.1 level.

BTC (last 2 days)Yesterday was a liquidation-style selloff: multiple oversized 5m candles and wicks, no clean pullbacks, and consecutive inefficiencies printed (stacked 5m/15m FVGs). Any “normal” retest logic got distorted by volatility spikes, so execution quality depended on waiting for acceptance/reclaim rather than trying to catch the first touch.
Today shifted into repair mode: price started building bases out of prior displacement (what looked like a 15m FVG effectively behaved like a higher-TF supply/base zone, then evolved into an actionable RBD/RDB structure). We got a push into the 5m FVG and a reaction, but the retest failed and price slipped back into the 1h RBD, invalidating the long continuation attempt. One partial TP was possible, but the runner got taken out on the reversal—classic “paid for information” trade: initial confirmation, then rejection/rotation back into the higher-TF base.
Key takeaway: in this volatility regime, treat FVGs as reaction areas, not guaranteed entries—confirmation (hold/reclaim + retest) matters more than precision. Execution priority was: reclaim/acceptance first, then entry; otherwise fade/short only after loss of base and failed reclaim.

Building Rock-Solid Confidence: The Trader’s Unshakable EdgeConfidence is the foundation of every great trader — not because it guarantees wins, but because it guarantees consistency. In this session, we break down the psychology of self-belief and how to build confidence that doesn’t crumble when the market tests you.
Learn why confidence isn’t built from profits but from disciplined execution. We’ll cover how to stop second-guessing your trades, rebuild trust in your system, and detach your self-worth from your results. This episode shows you how professional traders use repetition, reflection, and recovery to stay calm, clear, and confident — even in drawdowns.
You’ll learn:
The difference between ego and true confidence
How to rebuild trust in your trading plan
Why the market manipulates your confidence and how to protect it
The 3-step framework for building self-trust in trading
If you’ve ever felt anxious before pressing “Buy” or “Sell,” or you constantly question your setups, this discussion will help you develop the rock-solid mindset needed to execute with precision and confidence.
Tags: trading psychology, trading confidence, self-belief for traders, trading mindset, forex psychology, discipline in trading, consistency in trading, emotional control, trader development, performance mindset

Universal Trading Psychology: The Patience Paradox PlaybookUniversal Trading Psychology: The Patience Paradox Playbook
A general discipline lesson you can apply to any liquid market and any timeframe
Most trading pain is not caused by a bad system. It is caused by impatience. The edge appears when you plan inactivity, watch with intent, wait for confirmation, and only act when setup quality is high. Cash is a position.
1. Why patience beats impulse in every market
Impatience sneaks in as early entries, overtrading, revenge trading, and random scaling. These habits feel productive because you are clicking and chasing motion. In reality they transfer capital from your future self to the present urge. Patience does the opposite. It gives your method time to read structure, it allows volatility and volume to normalize, and it keeps your energy for the right moment. The effect is universal. It does not matter if you trade indices, commodities, crypto, stocks, or forex. It does not matter if you trade on the one minute, the fifteen minute, or the daily. The core link is simple. Better timing raises the probability of an idea and lowers drawdown. Fewer attempts with higher quality improve expectancy and improve return divided by drawdown. That is the language that every account understands.
2. The Patience Paradox in plain language
The paradox says you can win more by doing less. You plan windows where you watch the market without touching the buy or sell buttons. You promise to yourself that you will let a timer run and you will only act after a confirmation event. Inactive minutes feel like a cost at first. In practice they are an investment. They reduce noise, they teach you the current regime, and they keep you calm enough to apply your edge. The paradox holds across sessions. The first minutes after a session begins often have high noise and emotional bait. The middle of the session can go quiet and trick you into forcing trades. The last minutes can be erratic. A patient trader respects this rhythm and keeps a written plan of when to observe and when to allow action.
3. Observation windows that fit any market
Observation windows are simple. Pick a time block. Start a timer. During the block you do not place orders. You watch the tape, the order of bars, the response to levels, and the size of swings. You collect awareness. You write one or two sentences about regime and structure. Then the timer ends. Only then do you look for a trade.
Observation windows you can adopt today
Pre session scan for fifteen minutes. You prepare levels and watch the first hints of tempo. Inactive only.
Session open observation for fifteen minutes. You let the first box form. No orders until a bar closes beyond this box and the next bar respects that information.
Mid session read for thirty minutes. You classify regime as active or quiet using simple filters and you decide trend, range, or inactivity.
Pre secondary session observation for fifteen minutes. If your market has two major sessions, you repeat the open observation idea.
Post trade cooldown for ten to twenty minutes. You break the dopamine loop, you write a short review, and you reset your attention.
How to make it practical
Place a small physical timer on your desk. A phone timer also works. Print a one page card with your windows and durations. When the window starts, say out loud that you are in observation and you will sit on hands until the timer ends. This small ritual builds identity. It tells your brain that watching is part of trading and not a waste of time.
4. Confirmation that cuts false signals
Impatience usually shows up as early entry without confirmation. The most portable rule is also the simplest. Wait for the close. A signal bar that looks perfect in the middle of its life can close with a wick, a rejection, or a full flip. If you still want earlier entry mechanics, use delay one bar. You let a signal print. You enter on the next bar only if price remains valid. Both rules reduce false positives and reduce the total number of attempts. That is a feature, not a bug. The quality of attempts goes up. The mood in your head calms down. Your journal becomes cleaner to read and your expectancy calculation becomes more stable.
A universal confirmation checklist
The setup is valid by your written plan.
Close confirms beyond structure or a retest holds and closes in your direction.
Regime filters are supportive. You see participation that matches the idea.
Risk and position size are defined. The exit is clear before you click.
5. Regime filters that travel well
Regime is the background condition that decides if your strategy is likely to read the market correctly. You can estimate regime with two simple filters. One measures volatility. One measures participation. These two are available on any platform.
Volatility filter
Use average true range with a long enough length to be stable. A common choice is length fifty. Express ATR as a percent of price so you can compare across timeframes and symbols. Compare the current reading to a baseline such as the daily median over the last few weeks. Above the baseline means active regime. Below means quiet regime.
Participation filter
Use a session volume baseline. A simple moving average of session volume works. When current volume is below the baseline, you demand more patience or you switch to range tactics. When current volume is above the baseline, you keep confirmation strict and you avoid random scalps.
Session filter
Every market has time of day effects. The first minutes can be noisy. Lunchtime or the middle band can be flat. The last minutes can snap. You plan a response. Observe at the open. Reduce attempts in the lull. Keep the end of session simple.
6. Cooldown, loss streak lockout, and daily loss limit
Cooldown is the fastest lever you can pull to stop impulsive streaks. After any loss you start a ten to twenty minute cooldown. You leave the chart zoom alone. You write a short paragraph with what the market did and what you did. This break cuts the urge circuit and lets you reset. A lockout is a stronger version. Two losses in a row at full risk trigger a lockout until the next session. Three small losses also trigger a lockout. A win does not cancel a lockout if you broke plan discipline during the win. A daily loss limit protects the account from a bad day. Pick a fraction of your weekly drawdown budget. When you hit it, you stop for the day. These three guardrails build survivorship and keep your mind from spiraling.
7. Expectancy and return divided by drawdown
Expectancy is the average outcome per trade. Write it as average win multiplied by win probability minus average loss multiplied by loss probability. It is a small number in units of R. That is fine. The power of expectancy is repetition. The second metric to watch is return divided by drawdown. This tells you how efficiently you compound given the cost of the worst pullback. Patience improves both. Cutting early attempts raises win probability and often raises average win because you pick cleaner structure. Removing impulsive losses reduces drawdown. Together they stabilize equity and make your process less emotional.
A quick way to measure
Log ten to twenty trades under the patience protocol. Record average win in R, average loss in R, win rate, and worst drawdown in R. Compute expectancy and return divided by drawdown. Then compare to your prior logs where you did not respect observation or confirmation. The difference shows you why patience pays.
8. A portable pre market checklist
Checklists prevent decision fatigue. Use one page. Keep the language simple.
Trade plan
Plan is visible. Strategy is defined.
Entry, exit, and position size rules are clear and written.
Journal template is open.
Market regime
ATR as percent of price labeled active or quiet.
Session volume labeled below baseline or above baseline.
Prior session open, high, low, close marked.
Observation windows for the first minutes drawn on the chart.
Session timing
Pre session observation timer set.
Open observation window scheduled.
Lunchtime lull noted.
Post session review time booked.
Watchlist and setup quality
Three to five names maximum.
One sentence setup description for each name.
Score the idea from one to five on quality.
Act only on four or five.
Confirmation and patience
Delay one bar or close based confirmation selected.
Inside bar means wait. No exceptions.
If FOMO appears, start a five minute micro timer and breathe.
Say out loud that doing nothing is a valid decision.
Risk and position control
Risk per trade set as a fixed percent of equity.
Stop never widened after entry.
No adds unless the plan explicitly allows scaling.
Daily loss limit and lockout rules visible.
Exit plan
Exit condition defined before entry.
Partial exits use confirmation if the system supports it.
If a volatility spike hits, reduce risk or exit per plan.
Journal the reason for the exit.
9. A simple setup quality score
A score makes permission to trade objective. Use five factors. Each is zero to two.
Factors
Regime. Market aligned with the strategy using the filters.
Structure. Setup is clean with room to target.
Timing. Observation respected and confirmation present.
Risk. Position size correct and stop placed where logic breaks.
Mindset. Patient attention present and FOMO absent.
Eight or more means permission. Seven or less means wait. This one rule saves careers.
10. A day in the life under the Patience Paradox
You begin fifteen minutes before your active session with an observation. You mark levels and write a short line about tempo. No orders. When the session begins you let the first box print. A breakout looks tempting inside the window, but you stay inactive. The next bar fails to close beyond the box. You extend the delay. Later participation rises above the baseline and volatility reaches the active zone. Your strategy calls for a trend pullback entry. You wait for a bar to close back in the direction of trend. Then you take a single position with one percent risk. The trade reaches target. You record the result and start a short cooldown. Near the second session open you repeat the observation idea. A clean setup appears but your score is only six. You pass and write one sentence to honor the decision. You end the day with a review and update your metrics. Equity is stable. Attention is calm. The process feels repeatable.
11. Overtrading prevention that actually works
Limit attempts per session. Use micro breaks whenever fatigue appears. If the journal shows a loss streak, apply the lockout. If volatility is too low, accept inactivity. If noise is heavy near the open, extend the observation. If you break any rule, record the event and reduce size on the next attempt. Prevention is cheaper than recovery. You will never regret a trade you did not take. You will often regret the one you forced.
12. Mindfulness and urge surf for traders
Mindfulness is not about long meditation. It is about a one minute reset. Watch the breath for one minute. Name the urge silently. Start a two minute timer and surf the wave. When it passes, you return to the plan. This tiny protocol moves you from reaction to response. Over time it raises your discipline score and lowers your cost of error.
13. Frequently asked behavior questions
What if the first clean setup appears during the first minutes of the day
You still respect the observation. The first confirmation bar after the window often gives better probability and a calmer entry.
What if volume stays below average all day
Reduce attempts. Focus on one name or stay inactive. Quality beats quantity. You are paid for selectivity, not activity.
What if I miss a win after a long wait
Missing is normal. Write it in the journal and keep the schedule. The market never runs out of opportunities. Your attention does.
How do I measure improvement
Track three numbers. Expectancy. Return divided by drawdown. Discipline score. If the first two rise and the third stays above four, the process is working.
14. Install the Paradox in one week
Day one. Print the checklist and the windows. Place a timer on the desk. Commit to half the usual number of attempts.
Day two. Run all observation windows. Log only confirmed ideas.
Day three. Add the cooldown after any loss. Review your writing at the end of the day.
Day four. Apply the loss streak lockout if needed. Protect the account.
Day five. Score every idea with the five factor grid. Only trade eight or more.
Day six. Compute expectancy and return divided by drawdown from the week.
Day seven. Read your notes. Keep the parts that made you calm and effective. Remove what was noise.
15. Comparator versus a passive baseline
You want to see that patience improves efficiency. Pick a baseline that matches your market. If there is a natural session, use buy at session open and exit at session close. If there is no natural session, use an always in market baseline. Then run the Patience Paradox protocol next to it.
How to compare in three steps
Compute baseline results across your window. Record attempts, average result per session, and worst drawdown in R.
Compute Paradox results with observation windows, confirmation, and guardrails. Record attempts, expectancy, and worst drawdown in R.
Compute return divided by drawdown for both. When the protocol is respected, this ratio usually improves even if total trades drop. Your account and your sleep benefit from that.
16. A journal template you can use today
Before entry
Setup name and one sentence description.
Regime notes on volatility and participation.
Quality score and reason for each point.
Risk in R and exit plan.
After exit
Result in R and whether the logic held.
What you felt and how you responded.
What you would repeat and what you would remove.
One sentence lesson for the board.
17. Advanced patience drills for professionals
The inside bar extension
When a bar prints inside the prior range you extend the observation by one more bar. This drill stops you from guessing breakouts and creates a natural delay.
The half size probation
After a loss you allow the next confirmed idea at half size. You return to full size only after a clean win that followed plan. This keeps you from trying to win it back.
The one pass rule
You allow yourself one pass on a marginal idea each week. You write the reason and the outcome. This rule prevents a cascade of rationalizations.
18. Closing perspective
Patience is not passive. It is active observation guided by rules. A professional monitors regime, respects timers, demands confirmation, and protects the account with cooldowns and lockouts. The paradox is simple. Inactivity at the right time raises probability, keeps drawdown shallow, and makes expectancy stable. Traders who internalize this find that the market stops feeling like a battle and starts feeling like a process. You do less. You see more. You let the best ideas come to you.
Education and analytics only. Not investment advice.
Thank you all for reading this article.
If you have any type of requests, drop a comment below.

USDJPY – Liquidity Sweep & CHoCH → Short SetupUSDJPY shows a clean liquidity play under MY Liquidity MM Trading System:
Price swept liquidity above Friday’s High, triggering buy-side stops.
CHoCH confirmed a bearish shift in orderflow.
Retest into the Supply Zone (OB + Highest Volume Area) offers a short entry.
Targeting liquidity resting at Previous Day’s Low (PDL).
Execution Plan:
Entry: Supply zone retest
Stop: Above Friday’s High for
R:R: 1:2
For tighter stops: Refine entry at top of OB wick + add buffer of 2–3 pips
TP: PDL liquidity pool
R:R ≈ 1:4

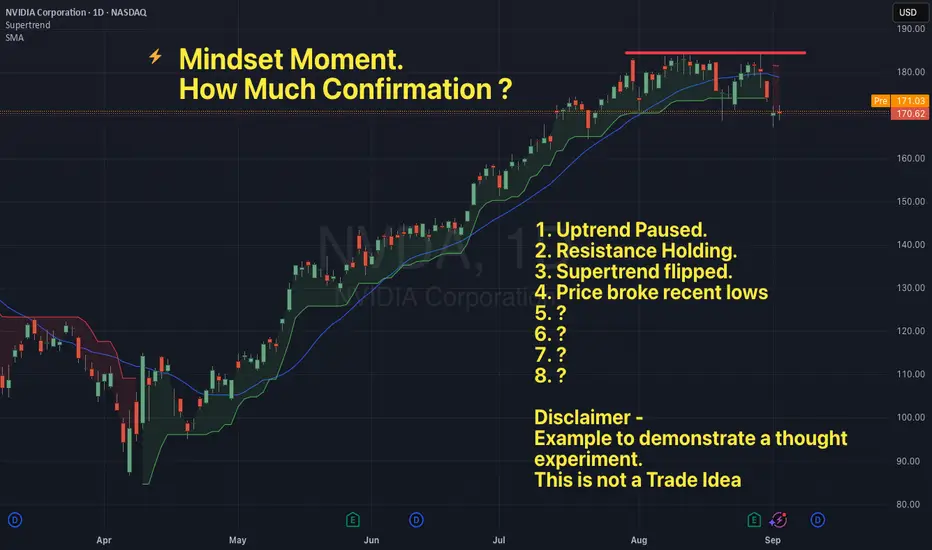
Certainly Uncertain - How Much Confirmation Do You Need?So ... you have what looks like a set up.
"Just one more bar"
"Just wait for the close"
"Wait for this indicator to align"
"Watch for the next to align"
"Ensure this filter shows ‘green lights go’"
But by the time everything lines up
The move has gone.
The horse has bolted
You fumble to enter - all fingers and thumbs
You ‘feel’ like you’re chasing
Perhaps the moment has passed.
Flummoxed - you wonder - what the heck happened here?
Feel familiar?
The search for absolute certainty shows up in subtle ways:
Emotions:
Anxiety builds. A conflict between wanting to act and restraining the impulse. Applying self control with will … but the body and mind unsettled.
Thoughts:
Endless “what if” scenarios.
What if I miss it.
What if it goes without me
What if I just try and get ahead of this at a better price
Physical Cues:
Tension rises in the body showing up as a hand hovering over the mouse, heart rate climbing - eyes fixated on the screens, backside glued to the seat (for fear of missing it).
If you’ve ever experienced this, you may recognise it as feeling cautious or disciplined.
In the pursuit of being disciplined and true to your rules you feel out of alignment and hesitant.
Markets are uncertain by nature.
If we choose to engage with uncertainty, then surely the job is to create a sense of certainty within ourselves.
The question is how do you do this currently?
A coping mechanism that might help:
Breathe.
Centering your breath is one of the most under rated and effective ways to calm ones nervous system.
Reframe your entry as a probability, not a verdict.
Before you click, remind yourself: This trade doesn’t have to be certain, it just has to meet my criteria. Then execute and let the outcome be data - not proof of your worth. Adopt the mantra… ‘ This is one trade in a 1000’
Cultivate the state of certainty in uncertain environments one trade at a time.
confirmed rejection on GJ In reference to our previous discussion, it is worth noting that the price has recently encountered strong resistance at an extreme 15-minute Area of Interest (AOI). Following this, on the hourly chart, we observed that the price closed within our designated 2-hour G-spot.
To gain further insights, I recommend examining the 5-minute or 3-minute charts, where you will notice a clear shift in trend, along with a 3-minute Order Block (OB) formation.
This presents a solid opportunity for a confirmed entry point. I encourage you to review your charts for a detailed analysis. Happy trading!

CHFJPY - The Bulls Are Exhausted!Hello TradingView Family / Fellow Traders. This is Richard, also known as theSignalyst.
📈CHFJPY has been overall bullish trading within the rising channel marked in blue and it is currently retesting the upper bound of it.
Moreover, the green zone is a strong supply.
🏹 Thus, the highlighted red circle is a strong area to look for sell setups as it is the intersection of the upper blue trendline and green supply.
📚 As per my trading style:
As #CHFJPY is hovering around the red circle zone, I will be looking for bearish reversal setups (like a double top pattern, trendline break , and so on...)
📚 Always follow your trading plan regarding entry, risk management, and trade management.
Good luck!
All Strategies Are Good; If Managed Properly!
~Richard Nasr
Disclosure: I am part of Trade Nation's Influencer program and receive a monthly fee for using their TradingView charts in my analysis.

AUDJPY Ready To "Drop A Shoulder"? Multi-Timeframe May Help!OANDA:AUDJPY is beginning to form a very convincingly strong Reversal Pattern, the Head & Shoulders!
Starting with the Daily Chart we can see that Price is Forming a Doji Candle just after trying to Breakout of a Major Resistance Zone created from the Highs of March 18th and if Price is unable to close above this level, this strengthens the Bearish and Reversal Bias.
Now the 4 Hr Chart shows both the "First Shoulder" or Previous Higher High that was surpassed by the "Head" which is the New Higher High, has formed quite quickly with a slightly Ascending "Neckline" or Support Line where Bulls were able to make their Last Stand.
With a Reversal Pattern, you want to see a Change in Trend, in this case, would be a Lower High then that of the Higher High or "Head" @ 96.204.
*If Bulls are able to Push Price above the "Left Shoulder" or Previous Higher High @ 95.952, this will Invalidate the Head & Shoulders Set-up!
**If Bulls are unable to Break Above 95.952 and Price is pushed back down to the Confirmation or "Neckline" for a 3rd time, this Confirms the Head & Shoulders Set-up!!
Based on the Distance between the Head and Neckline, we can project a potential drop down to the next Support Level as a Price Target @ 95.00 once:
1) Pattern is Confirmed
2) Breakout is Validated

Adjustments for Better ReadingsMany traders rely on technical indicators to identify opportunities for profit—that's the whole point of this game. Whether it’s scalping, day trading, swing trading, or shorting the market, most trading decisions are based on indicator readings—be it a single indicator or a combination of several.
But here’s the truth: not all traders truly understand what an indicator is. They don’t grasp its nature—let alone the fact that this nature can be adjusted.
Those who don’t understand how or why an indicator works often find themselves in stressful and uncomfortable situations. It’s no coincidence that we often hear the common phrase: “Only 1% of all traders succeed, while 80% blow their accounts, and the remaining 19% barely break even.”
Why? Because the elite traders understand something most don’t:
Whether an indicator is leading or lagging, it can be customized to behave differently across different timeframes.
These adjustments can be found in the settings section of every indicator.
Let’s take the Relative Strength Index (RSI), which I’ve mentioned in previous ideas. Some of you may have noticed that my RSI plot looks different from yours. That’s because I don’t use the default 14-period RSI, which averages out the last 14 candles.
RSI is naturally lagging by default—but that doesn’t mean it can’t be trusted. In fact, with the right adjustments, that lagging nature can become leading. Learn how to do this. Push yourself. Educate your mind. Master this, and you might just find yourself among the top 1%.
Markets react to signals—signals that are often hidden in plain sight, created by the big players who always leave behind footprints. This is the trader’s true skill: seeing the whole picture.
A good friend once told me: Be a detective.
Now let’s go to the chart.
We clearly see a bearish strength unfolding.
Not only is the 9-period RSI plot trending below the yellow 28-period Weighted Moving Average (WMA), but we also observe a healthy continuation of the downtrend, confirmed by the WMA itself.
Using a 9-period RSI gives faster signals, while the 28 WMA offers smoother confirmations. This combo is applied on the daily timeframe—but every timeframe has its own ideal settings.
Now, when the RSI plot trends above the WMA, this can act as a potential reversal signal or even a confirmation of a trend change, depending on the broader market structure and volume context. It's not just about the crossover—it’s about what follows next. That’s where the detective work begins.
What do we see today?
Looking solely at the daily timeframe, the downtrend seems far from over. But to analyze it professionally, we must wait for the candle of Friday, June 6th, 2025 to close.
Switching to the lower timeframes, we see something interesting—a sort of bullish dominance unfolding during this incomplete trading day. But the real question is: Is it actual dominance?
Let’s break it down:
We have a clearly formed Head & Shoulders pattern.
The bearish Marubozu candle from June 5th made a new lower low (LL).
But—it did not close below the key swing low at 100.718.
Therefore, the Head & Shoulders pattern is not confirmed—it hasn’t broken and closed below that swing level.
So what’s happening in the lower timeframes?
In the 4-hour timeframe, we’re seeing a real-time crossover above the WMA (though the session isn’t closed yet).
In the 1-hour timeframe, the crossover has already occurred.
Now, such a crossover—where the RSI plot moves above the WMA—can often act as an early signal for a reversal, or at the very least, indicate a strong pullback. But don’t take it at face value—context is king. This is why we pair it with other signals like divergence, price action, and volume behavior for confirmation.
Across the 4H, 3H, and 1H timeframes, we’re observing this bullish pullback, yet it’s accompanied by an RSI Hidden Bearish Divergence (see: Macro Noise vs Micro Truth: The Art of Hidden Divergences).
Is this pullback a true reversal?
According to Volume Spread Analysis (VSA) (read: VSA vs BTC: Into a Bearish Scenario or Not?), a new narrative is emerging—but not without contradiction.
Price is climbing, yes.
But bullish volume spikes are declining, supporting our RSI hidden divergence. This volume-price disagreement is a clue.
What will reveal the truth?
Today's closing candle.
If price action (PA) creates a higher high (HH) but RSI creates a lower high (LH) → Bearish Divergence
If RSI makes a HH but PA creates a LH → Hidden Bearish Divergence
And for those of you who truly understand market structure:
The 100.718 level was a buy opportunity to secure profits.
If you caught that—congratulations. You’ve done your homework.
Now, you can sit back, relaxed, and wait for the next signal.
The market is a breathing organism. If you’re in sync with it—you’ll feel it.
And for those who believe there’s more to learn—but are struggling to find answers—there’s no shame in asking questions.
Till next time, take care—and trade wisely.
P.S. RSI plot, WMA, candlestick patterns, and Volume Spread Analysis (VSA)—when combined and used properly—can become a powerful toolset. For those willing to go deeper, they’re more than enough.

What is a Bearish Breakaway and How To Spot One!This Educational Idea consists of:
- What a Bearish Breakaway Candlestick Pattern is
- How its Formed
- Added Confirmations
The example comes to us from EURGBP over the evening hours!
Since I was late to turn it into a Trade Idea, perfect opportunity for a Learning Curve!
Hope you enjoy and find value!

EURCHF (Order Flow + BOS + Demand + OTE)Hello traders!
As you can see our previous OB was mitigated and now we have BOS 1 H - we see good reaction, but at least 1-5min confirmation and we have green light.
Target new HH.
Have a profitable day and don't forget to subscribe for updates!

EURUSD (CONFIRMATION + DEMAND + OTE)Hello traders!
Price mitigated demand and after we have confirmation on 1H TF. As you noticed our demand unmitigated. I expecting reversal on LTF after closing IMB.
Have a profitable day and don't forget to subscribe for updates!

XAUUSD (CONFIRMATION + OB + OTE)Hello traders!
From our previous analysis we expected reversal in 705 zone, now we have confirmation already and our target to close imbalance. Last open zone for interest is OB and mitigation(possible pullback with LG)
Have a profitable day and don't forget to subscribe for updates!

XRP/USDT — Structure-Driven Strategy (1H Chart)Just price, structure, and volume — tracked in real time.
🧠 Chart Breakdown:
✅ Reversal Buy — Price flushed, then snapped back into the range with follow-through. That became the base structure for everything that followed.
⛔ Top Exhaustion / Rejection — Clean reversal after a strong rally. Volume dropped off, candles showed hesitation, and sellers stepped in.
⚠️ Small Rejection Mid-Range — Structure failed to push higher. This area marked a trap — no volume confirmation, no continuation.
🚨 Major Breakdown & Recovery Setup — Price dropped hard but reclaimed key levels quickly. The recovery candle and volume spike were the first clues buyers were stepping in again.
👀 Current Watch Point — Price is now pressing back into that same resistance zone. The structure here is everything — a clean reclaim could mean trend continuation. But hesitation again? Fade it.
Always happy to be helpful.

XAUUSD WILL IT MAKE NEW ATH OR DUMP?🚨 Attention Traders! 🚨
🟡 Gold is in a no-trade zone! 🛑 Stay patient as we monitor key levels.
📊 Critical Zone: 2947 - 2954 (Support & Resistance)
🔻 Bearish Breakout? If the price drops below 2947, we’ll target:
🎯 TP1 = 2936
🔺 Bullish Breakout? A move above 2954 signals upward momentum:
🎯 TP1 = 2964
🔥 Stay sharp & trade wisely! 💰📈

XAUUSD CONFIRM 100 PIPS MOVE IS HERE🚨 Attention Traders! 🚨
🟡 Gold is in a no-trade zone! 🛑 Stay patient as we monitor key levels.
📊 Critical Zone: 2919 - 2945 (Support & Resistance)
🔻 Bearish Breakout? If the price drops below 2919, we’ll target:
🎯 TP1 = 2909
🔺 Bullish Breakout? A move above 2945 signals upward momentum:
🎯 TP1 = 2955
🔥 Stay sharp & trade wisely! 💰📈

#TRBUSDT remains bullish📈 LONG BYBIT:TRBUSDT.P from $38.35
🛡 Stop Loss: $38.00
⏱ 1H Timeframe
✅ Overview:
➡️ BYBIT:TRBUSDT.P is in a strong uptrend, breaking the key $38.35 resistance level.
➡️ POC (Point of Control) at $34.47 indicates the highest liquidity zone far below the current price, confirming strong buyer support.
➡️ The price has broken through the $38.30 area and is consolidating above, opening potential upside toward $39.30.
➡️ If the price holds above $38.35, bulls may continue pushing towards target levels.
⚡ Plan:
➡️ Enter long after confirmation above $38.35, signaling a bullish continuation.
➡️ Risk management via Stop-Loss at $38.00, placed below the support zone.
➡️ Primary upside targets:
🎯 TP Targets:
💎 TP1: $38.90
🔥 TP2: $39.30
🚀 BYBIT:TRBUSDT.P remains bullish—expecting further upside!
📢 BYBIT:TRBUSDT.P shows strong buying momentum, breaking key resistance levels.
📢 If $38.35 holds as support, the probability of reaching $39.30 increases.
📢 However, if the price drops below $38.00, a pullback to lower levels may occur.

AUD/USD Bullish Trade Set Up! A lot of Confirmation! Tap In Now!We are seeing AUD/USD rebound from a 4-day bearish push to .61300 to new highs around the .62000 level. The .62000 level has been holding strong as a resistance level; four separate times it has held the market below it.
It has now broken back above previous lows and is now retesting to the support line and is looking to move around the .61800 level.
We are also hovering between the 50 and 200 EMA levels, with the EMAs starting to converge.
Another sign we see is an inverse shoulder head shoulder on the 1 hour. The low of the right shoulder is the black box at .61700, and we don't want to see the market break below that point. If it breaks below the black low box, it is an indication of bearish strength.
Move Summary: We want to see it make a move to break through the .62000 level to break into more buy territory and create new highs. A break above the 200 EMA would be another signal for bullish confirmation. Our target will be the MONEY box for a 3:1 trade.
Like, Comment, and Follow if you agree with this Idea! Let's Connect!

AES Corporation - Short term view with strong supportSo first of all both price and indicators are confirming the downtrend.
Today NYSE:AES opened with a gap succeeding yesterday's equilibrium in price with doji candles.
The price is still in the middle of the regression line and in the next few days the price don't seems to be close to upper 2 SD.
In the print above the yellow line shows the support at $11.43. The image's time horizon starts at the end of 2006.
Furthermore looking at short ratio available online the value is about 2,7 from mid October as well as more than 22M short interest

Gold - Wave 5, plus CCI and RSI confirmationAt the trough we had the RSI close to oversold, and we can say that CCI showed an oversold condition.
The CCI that measures the deviaton its smoothed with an 14-ma and adding the RSI above we have the market confirmation.
The candles formed three white soldiers that seems very strong.
We are in the beginning of wave 5 with the objective to go to a new high above wave 3.
