Confirmation


The Rise And Rise Of Bitcoin : Still Showing The Lion's Heart.#Bitcoin_Update
Bitcoin is currently on a critical price level whether to decide to be in a bullish trend as it was or to see a correctional move. Currently the formation of the neutral triangle in the daily chart is a very critical one and even it makes harder to predict the following trend behavior unless we are done and see where the current candlestick close. The depicted area in red circle on this chart at around 11800$ is the main resistance line and would give us a good indication on our next outcome in the trade.
- Indications on the various indicators of the trade are showing still a bullish sign for a further upward movement even though we need some correction whether it be a single Doji Candle stick or short term bearish candle sticks.
- Volume is in a continuously growing mode which makes the trade still in bullish sentiment. MACD showing a bullish sign for further leg ups and RSI is also in a good bullish trend at around 65 which is showing that there is still a space for a growth.
Conclusion
My conclusion on this trend can't be confirmed until we close the current daily candle stick but I will try to put the scenario's that can occur with the short term on Bitcoin's trade.
Scenario 1 : As I stated in my earlier ideas Bitcoin has been in an expanded flat correction and will start its reversal uptrend and it did surely did go up as I said it. On my first implication on the time where the correction ends Bitcoin just touched the 11K area of my 2 targets at that moment. After the failed impulsive wave Bitcoin once again reached my 11.6K target after a comparatively huge correction within a week. So I am still thinking Bitcoin would go further go upwards at this point and even though we still are not in a confirmed point I am thinking the most possible scenario to happen is that Bitcoin will further go towards my stated resistance levels on my previous call.
- Scenario 2 : This is the second possible scenario to happen if my prediction didn't go as it is stated, which is a possible correctional move towards the 11k area first and if that test could further go down we might see the 10.6k area. But I am thinking this scenario's possibility to happen is very low seeing the trend at the current pattern formation.
- Note that we are still in need for a confirmed breakout on the candle stick formation and we need some time for a confirmed move towards the trade. Expecting my Scenario 1 to happen in a high probability looking alert on the 2nd scenario too is a wise move.
With Regards.
@TogetherWeAccumulate
Drop your LIKES if you agree with this idea. Drop your comments if you have any suggestions or argument on the idea.
Besides help the community to grow by following the page.
Thank You for your time.
Stay Tuned and follow TogetherWeAccumulate on major social media platforms at TogetherWeAccumulate.


Moving averages as great tool when used on shorter timeframes!Since MA's are usually a bit slow in showing the best entry and exit points its good to use them on shorter timeframes and see what story are they saying.
In this example, it is quite clear how shorter MA's cross down longer MA's and confirms the bear trend and how shorter MA's then cross longer MA's on the upside and confirm the bull trend!
MA's used here are:
- 20
- 50
- 100
- 200
Hope you will use them wise and well!
Do you see the confirmation for the upside that is most probably coming now since the 3rd breakout try is usually the successful one? We already had 2! ;-)

Still Need for ConfirmationAlthough we have broken the resistance at 9650 I am still waiting for a valid confirmation. I am still not convinced that there is a reversal upwards. Volume is not enough to provide enough thrust to take off besides there is a divergence at 1 hour chart RSI which can still cause a stall in price which afterwards lead a devastating crash. Signals are still mixed.
Disclaimer: This only reflects my self opinion therefore this is not a investment advice. You are responsible for your own actions.

#FET : Up to 350% Profits In The Mid Term.#Accumulatio_Recommendation
Pair : #FET / #BTC
Trading Platform : #Binance
RSI : 43
TA Notes :
- MACD : Looking bullish on the daily chart.
- RSI : Looking bullish too for the short the short term being in a neutral position form but going to move towards the overbought area in the mean time.
EMA : On the way to go below the price and if it can manage to be below the price it will be a good indication.
- Volume : Already boosted by the past 4 hours showing a good momentum currently.
- Candle Stick formation also looks bullish and will be a confirmation if it closes above the falling wedge as it is trading currently and currently forming a bullish engulfing candle stick.
#Accumulation_Zone : 405 sats - 435 sats
Distribution_Zone: 950 sats - 1020 sats
Target 1 : 1350 sats
Target 2 : 1689 sats
Target 3 : 1876 sats
Target 4 : 2195 sats
Target 5 : 2411 sats
Mid Term Targets
Target 6 : 2600 sats
Target 7 : 3008 sats
Target 8 : 3588 sats+
STOPLOSS : Close below 875 sats
Risk : High
Capital Accumulation : 3%
@TogetherWeAccumulate

WKHS Ascending Triangle Confirmed, Swing Trade I've been watching the ascending triangle formation and entered a position on the initial fake out then was stopped out. I rentered upon the second real
confirmation and took profits around $4, but am now in a new position entered into the bull flag with a stop loss of 3.56 and a price target of 5.24
I thought I had published this idea earlier, but it appears to be private.

LTCUSD - Reached exactly my target! Next steps ahead?!_______________________________________________________________________________________________________________________________________
Hello traders investors and community. This is an update analysis on my recent SHORT analysis about LTCUSD.
As you can see in the chart it reached exactly my SHORT target at 97.602, there is also a second target at 83.270 which we will reach the next time!
However i think we will have a reversal to the upside from that point, first confirming the EMAs (50 and 100) and then go ahead.
_______________________________________________________________________________________________________________________________________
Everybody who watched my SHORT analysis on LTCUSD should be happy now.
I will cut off my SHORT and take profit at the second target (83.270), also i will open up a LONG position at that level.
Target will be the blue trend-line you see in my chart.
_______________________________________________________________________________________________________________________________________
Also we have an great signal confirming in the RSI, it is oversold and forming an bullish divergence!
Great to see also this factor playing into the successful analysis and for an good LONG entry.
_______________________________________________________________________________________________________________________________________
Okay hopefully you enjoyed this analysis, give some support and i will probably upload an LONG term analysis on LTCUSD! So see you soon!
This is only educational and should not used to take action in markets!
May all happiness and luck come to you friends!
_______________________________________________________________________________________________________________________________________

#LEND : Up to 100% Profits In The Mid Term.#Accumulatio_Recommendation
Pair : #LEND / #BTC
RSI : 40
TA Notes :
- MACD : Looking bullish on the daily chart.
- RSI : Looking bullish too for the short the short term being in a neutral postion form but going to move towards the overbought area in the mean time.
20] : Looking to go downwards but needs to get energy and become below the price level.
- Volume : Looking fairly good by the past 2 days but needs some more energy to see a breakout for the short term.
- Candle Stick formation also looks bullish and will be a confirmation if it closes above the falling wedge as it is trading currently.
#Accumulation_Zone : 65 sats - 72 sats
Distribution_Zone:
Target 1 : 77 sats
Target 2 : 83 sats
Target 3 : 89 sats
Target 4 : 95 sats
Target 5 : 99 sats
Mid Term Targets
Target 6 : 109 sats
Target 7 : 122 sats
Target 8 : 140 sats+
STOPLOSS : Close below 57 sats
Risk : High
Capital Accumulation : 3%
@TogetherWeAccumulate

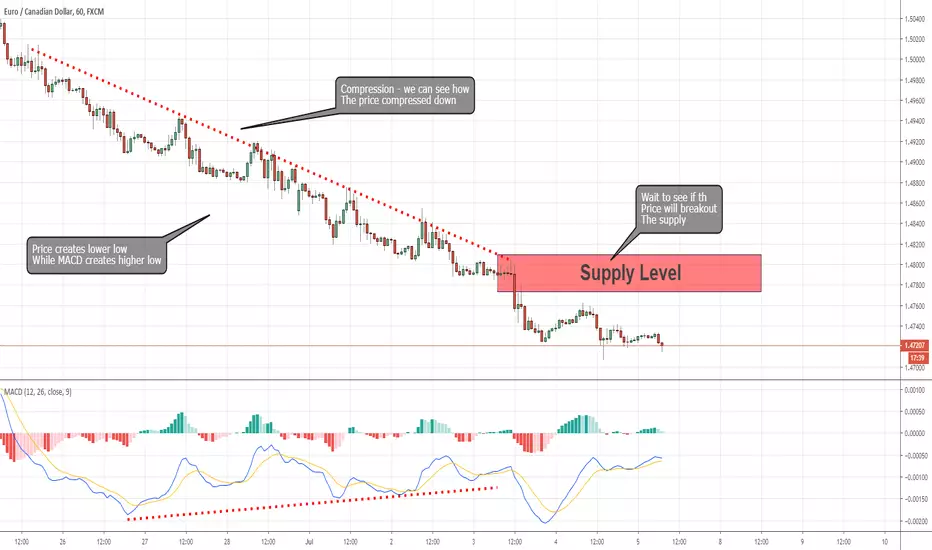
The Reason Why it’s Safer to Trade against CompressionToo Risky to Sell EUR/CAD with this Supply Above?
At any time frame, the EUR/CAD seems to be in bearish momentum.
In the H1 chart, the price is in a downtrend of almost 300 pips. While yesterday a fresh supply was created by the price above.
Most of this downtrend was a compression which meant that the price compressed down while picking up all the sell orders along the way.
Compression indicates a powerless movement in the price. In other words, it seems the last downtrend of the price was powerless and it’s safer to look for a reversal signal and trade against the compression.
Usually, a supply level is a great level for a sell position, but this supply is created after the price had already decreased about 250 pips and divergence has occurred between the MACD indicator and the price.
So, instead, I will use this supply as a confirmation zone and not as a level of sell position to sell this supply as is too risky now.
If the price will break out the supply, it will be a signal for reversal opportunity and we should look for a price action setup for a buy position.
Breaking out the supply above will change the momentum in the H1 chart from bearish to bullish.
#Bitcoin_Update : The Rise And Rise Of Bitcoin. [Critical.]#Bitcoin_Update
As we predict on our previous Bitcoin Technical Analysis idea the candle with the green circle was the one which gives a very good insight on our trade and once again it breaks out after the stated candle stick closes above the major resistance area at around 10650 USD area. For now we are looking on a bullish sign on Bitcoin trading breaking out from the falling wedge formation which was created after the correctional ABC move. We need some more indications to be fully confident on this prediction but it looks like very bullish for the short term to test once again the next levels of resistance at around 11750 USD, 12257 USD, 12965 USD and 13868 USD price ranges. But we can't say we are already on a bull run unless other wise we passed and closed above the 61.8% fib level at around 12200 USD - 12450 USD area.
- Even though the falling wedge breakout is a bullish indication we need to consider that we still needs a correction for a properly developing market. Besides the resistance levels are also might take some energy to break out by the bulls for the short run unless we got some more volume inputs in the market.
- The circles are for denoting the strongest area's which will be giving us the next direction were Bitcoin is heading.
- MACD and RSI looking good for the short run on favor of the bulls.
- EMA looking to stay on the bulls side but needs some more energy.
- Volume is not that much satisfactory though which might not make the trade to gain that much power.
Note that this is not a confirmed prediction on the outcome of Bitcoin and we need some more time to conclude and make a confirmed call on this trade.
-The tweet about the manipulation of Dollar by President Donald Trump seems a bullish maker though. But it still can't be considered as a very well manipulative news. Let's see the next 1 or 2 candles and additional indications and we will be at a point to confirm our positions.
@TogetherWeAccumulate

EURNZD for sellThe Price has broken the support and it was confirmed with RSI level below 30 so we are expeting the Price to seek the next support.
The trendline was also broken
Comment your opinions!

#BTT : Upto 100% Profits In The Mid Term.#Accumulatio_Recommendation
Pair : #BTT / #BTC
RSI : 46
TA Notes :
- MACD : Crossing over for a bullish indication which is in favor of the bulls and making the trade to get a good momentum.
- RSI : Is in a good position showing a bullish behavior too at a neutral position for a leg upward move for now.
- EMA : Looking to go below the candle stick formed and seems to be going to be below the price in the short run for a bull indication in the short term.
- Volume : Needs a good spike to see a good pump on #BTT but fairly in good shape by the past 2 days.
Fundamentally Justin Sun is giving an announcement within 2 days which will likely boost BTTs positions in the short term.
- Candle Stick formation also looks very bullish and if the current candle could manage to close above the resistance line in RED it will be a confirmed reversal bull trend for the short term.
#Accumulation_Zone : 9 sats - 11 sats
Distribution_Zone:
Target 1 : 14 sats
Target 2 : 16 sats
Target 3 : 17 sats
Target 4 : 19 sats
Target 5 : 22 sats+
STOPLOSS : Close below 8 sats
Risk : High
Capital Accumulation : 5%
@TogetherWeAccumulate

#POWR : Up to 120% Profits Opportunity in The Mid Term.#Accumulatio_Recommendation
Pair : #POWR / #BTC
RSI : 30
TA Notes :
- MACD : Still trying to cross to be in a bullish side.
- RSI : Trying to wake towards the bull sign in a neutral level for now.
- EMA : Looking to go downwards but needs to get energy and become below the price level.
- Volume : Looking good on the past 2 days and if it continues its current momentum will surely push the price upwards.
- Candle Stick formation also looks bullish closing above the last low point for now. Needs to close higher than the red resistance line for a confirmed bull reversal run.
#Accumulation_Zone : 900 sats - 1000 sats
Distribution_Zone:
Target 1 : 1063 sats
Target 2 : 1104 sats
Target 3 : 1195 sats
Target 4 : 1245 sats
Target 5 : 1302 sats
Mid Term Targets
Target 6 : 1409 sats
Target 7 : 1561 sats
Target 8 : 1755 sats+
STOPLOSS : Close below 840 sats
Risk : High
Capital Accumulation : 5%
@TogetherWeAccumulate

RIPPLE - HOW TO: Analyse this market!Hello dear traders and community! HOW TO: analyse this bullish market! With the example XRPUSD. In my analysis i detected several bullish factors for XRPUSD to skyrocket soon. In my analysis you see this long black parallel channel. XRPUSD kept in the channel for almost 462 days till it broke out on 14th may 2019 with a big green shooting star candle. You can see this breakout clearly on the chart. There are several other excelent factors which make it clear that XRPUSD is definitely a possible trade on the LONG side. In my chart provided you can see this big green descending wedge formed before the breakout of the black parallel channel. It almost perfectly broke out and confirmed together. After the breakout XRPUSD formed another symmetrical triangle, which you can see in black on my chart. This triangle is about to confirm now.
The target zone of the big green triangle is at 0.57 - 0.58 USD but there are several other factors which make it highly possible for XRPUSD to rise higher, at least to 0.9 USD (target of the parallel channel with price projection). From there we can get a pullback to the 0.735 - 0.74 USD range which you see in my chart. There are two ways after this pull-back, XRP can fall down and reverse the bullish trend or it will continue the uptrend to the 61.8 % retracement (you see it in blue on my chart). A LONG position can be opened in the 0.46 - 0.47 range with aggressive entry (stop-loss at 0.4 - 0.41), a conservative approach would be to wait until some green bullish candles confirm a further uptrend. Always wait for confirmation to come! Patience is a must-have in the mindset of a good trader!
While other coins are in strong uptrends, XRPUSD has definitely some more potential to rise. You can see it crearly in my chart. There are some other fundamental news which confirming bullish price actions for XRPUSD, normally i dont trade fundamental news. I use my technical indicators to observe further price actions. But this partnership with Moneygram is definitely an interesting story and a factor to look at.
Thanks everybody for watching my chart, i hope everybody enjoyed this analysis i am here to provide you with the best information possible! Of course this is just a evaluation of the current market situation and this evaluation should not be used to buy or sell, only for educational purposes! BIG SHOUTOUT to the crypto community!
Peace and love to everybody! Have a nice day and week, thank you!

NANO : A Quick Profits Opportunity For The Short Term.#Accumulation_Recomendation
Pair : #NANO / #BTC
Platform : #Binance
RSI : 37.8
Volume : A fair amount of volume circulating on the 1D chart.
**Note : Falling wedge triangle pattern formed and already broken out by the past 2 days and trying to form a reversal move by the current candle. We might see some more down ward retrace levels which will be even a good thing to see a stronger reversal trend but need to be above the resistance of the falling wedge which can be taken as a temporary support level. MACD looks to be in favor of the bulls for now and RSI is at a neutral movement but surely will be in a bullish state if volume continues its current momentum. EMA is also on the way to be below the price and for sure will continue to be moving in the current direction if volume made some change and make a boost on the upward movement.
Current Accumulation Area : 1650 sats - 1675 sats
Distribution Targets
Short Term :
Target 1 : 1764 sats
Target 2 : 1841 sats
Target 3 : 1903 sats
Target 4 : 1964 sats
Target 5 : 2052 sats
Target 6 : 2164 sats+
Stop Loss : 1600 sats
Risk : High
Capital Allocation : 5%

MFT : Upto 300% Profits Opportunity In The Mid Term.#Accumulation_Recomendation
Pair : #MFT / #BTC
Exchange : #Binance #Bittrex
RSI : 31
Note : Our last #MFT call did give us a fairly good profits in which our call was around 41 sats and reached 53 sats. By now it seems #MFT is in its lowest positions and ready to take off any time. EMA struggling to come below the price and seems to be on the way soon. RSI and MACD also seems to be on the way to be on favor of the bulls. Candle stick needs 1 or 2 sats to be in a bullish engulfing formation and it is likely to happen on the close of the daily time frame. Volume looking good for now but needs some more spike to confirm a reversal upward trend. Since we are on the very low of point of the price level and very big partnership news coming in the near future it seems a very good and smart move to accumulate #MFT at this point with a good capital accumulation and risk management strategies and a strict stop loss methodology.
Accumulation Area : 35 sats - 37 sats
Distribution Area
Short Term:
Target 1 : 40 sats
Target 2 : 44 sats
Target 3 : 47 sats
Target 4 : 49 sats
Target 5 : 52 sats
Mid Term:
Target 6 : 56 sats
Target 7 : 59 sats
Target 8 : 66 sats
Target 9 : 74 sats
Target 10 : 80 sats
Target 11 : 84 sats
Target 12 : 98 sats
Stop Loss : 31 sats
Risk : High
Capital Accumulation : 4%

USDCAD WAITING CONFIRMATIONSUSDCAD broke our major ascending trendline on daily bias, and in my opinion will stay bearish for a nest days, but I only trade with the information of the market, so right now is bullish on lower timeframes, so if usdcad break this minor ascending trendline I go short, if reject I go long,I will update you if I open any order.

VIB : GOOD OPPORTUNITY FOR HAVING A 100% Profits#Accumulation_Recomendation
Pair : #VIB / #BTC
RSI : 46
Note : Just before the Binance FUD announcement VIB was in a very good bullish trend and was forming a very bullish candle stick pattern. But after the FUD news since most alts did got into a huge volume out scenario we have seen a big bearish candle creation. But this temporary bearish mode doesn't seem to continue after we will see a good account transfers to other exchange accounts and the alts will most probably get there momentum back once again. RSI actually needs to be in the positive side but MACD still in bulls side and EMA still bullish for the short term if volume can get its strength once again. Even though the trade needs a strict trading strategy specially on the stoploss and capital accumulation management areas for sure it will show us a good profit.
Accumulation Area : 565 sats - 580 sats
Distribution Area
Short Term:
Target 1 : 594 sats
Target 2 : 620 sats
Target 3 : 639 sats
Mid Term:
Target 4 : 671 sats
Target 5 : 698 sats
Target 6 : 731 sats
Target 7 : 769 sats
Target 8 : 796 sats
Target 9 : 885 sats
Target 10 : 998 sats+
Stop Loss : 34500 sats
Capital Accumulation : 4%
Risk : High

#BQX : Upto 225% Profits For The Mid Term#Accumulation_Recomendation
Pair : #BQX / #BTC
RSI : 51
Note : #BQS is trying to make a reverse from once again after showing some upward move on Mid May. We might need some time for a confirmation of short term profits but surely will be a very good entry point for a mid term trade. Both MACD and RSI looking bullish on favor of the bulls and EMA also looking bullish. Volume needs some energy though to see a good upward move.
Accumulation Area : 1550 sats - 1750 sats
Distribution Area
Short Term:
Target 1 : 1827 sats
Target 2 : 2034 sats
Target 3 : 2335 sats
Mid Term:
Target 4 : 2920 sats
Target 5 : 3393 sats
Target 6 : 3865 sats
Target 7 : 4538 sats
Target 8 : 5395 sats+
Stop Loss : 1390 sats

MTL UPDATE : Breaking For More Profits.#MTL_Update
#MTL looking very good for our 100% fib level breakout towards 7540 sats breaking our from the current triangle.
We will update more or on it.

#QTUM : More Than a 100% Profits Opportunity For The Mid Term.#Accumulation_Recomendation
Pair : #QTUM / #BTC
RSI : 51
Note : #QTUM is also trying to make a reverse from once again after showing some upward move on Mid May. We might need some time for a confirmation of short term profits but surely will be a very good entry point for a mid term trade. Both MACD and RSI looking bullish on favor of the bulls and EMA also looking bullish. Volume looks good on the daily chart today but still needs some more energy to see a good spike.
Accumulation Area : 39000 sats - 41700 sats
Distribution Area
Short Term:
Target 1 : 45400 sats
Target 2 : 48200 sats
Target 3 : 51400 sats
Mid Term:
Target 4 : 53500 sats
Target 5 : 58800 sats
Target 6 : 66400 sats
Target 7 : 70200 sats
Target 8 : 76000 sats+
Stop Loss : 34500 sats
