Bands Lines Fibs and EMA's to 11800, then 9200BITFINEX:BTCUSD
Bollis on Daily chart are showing that we just bounced from the middle band, and seem to be heading to the upper band, which would match our highest close from January 28th.
This also is the place where 100% extension is located.
This also is the top of the ATH resitance.
C O N F L U E N C E
Last time we neared the top band, we got rejected, as to be expected in a downtrend. I'm feeling the same way about the upcoming touching of the band. We're getting rejected, and headed back to support, roughly at 9200.
Long Guppy EMA's are also turning horizontal, which can only mean we are almost done with this bear trend. The 3 EMA will be overextender by the time we:
1) Get to the top band
2) Reach 100% extension
3) Break the downwards trendline
This further gives higher probability of going down after reaching 11800.
Target is 11800 in less than 48 hours.
Stop loss is 12100.
Bids I'd place would be above 9200.
Confluence

NZDCAD Short: Gartley Confluence, Fade CAD GDP WeaknessHey traders, I like a short here at the completed smaller Gartley pattern. There is confluence on the higher timeframe and the data was not as weak as the market would suggest. Looks more like a brief rally that will be followed by continued weakness. Cheers

NEO/BTC - 2/20/2018NEO/BTC has started an uptrend at the beginning of the year. After this bullish push, it has entered a period of consolidation where it created a pennant. This pennant has been forming for around 3-4 weeks now, this means that the pennant may not be as accurate, although, will still be able to be considered a symmetrical triangle. Shown on the chart is the breakout of the flag rather than the triangle. Due to the chart being in the daily timeframe, I have set it up as a more long-term outlook. That means that even if the magnitude of the breakout isn't caused by the flag, the final target level for the price at this time frame is still around the price of 0.02221 indicated by the 161.8% fib level. The level that the breakout is expected to start is also using the Leading span A of the cloud as support along with the support level of 0.011607, formed during the forming of the triangle. The price reached under this level in the form of long lower wicks, but never closed under this level more than once. The levels that the price is expected to reverse from in the case of a bearish break, are the leading span B, 50% fib retracement and the 0.00875. This confluence leads me to believe that the price will struggle when trying to reach lower lows past these levels.
Important Resistance Levels: 0.01481, 0.01382
Important Support Levels: 0.01161, 0.00875
DISCLAIMER
WITH THIS CONTENT CRYPTOCURRENCY CAPITAL LLC OR ITS AFFILIATES DO NOT PROVIDE INVESTMENT, TAX, LEGAL OR ACCOUNTING ADVICE. THIS MATERIAL HAS BEEN PREPARED FOR INFORMATIONAL PURPOSES ONLY AND IS NOT INTENDED TO PROVIDE, AND SHOULD NOT BE RELIED ON FOR, TAX, LEGAL, ACCOUNTING OR INVESTMENT ADVICE. YOU SHOULD CONSULT YOUR OWN INVESTMENT, TAX, LEGAL AND ACCOUNTING ADVISORS BEFORE ENGAGING IN ANY TRANSACTION AT YOUR OWN RISK.
CONFLICTS OF INTEREST
GIVEN THE NATURE OF THE FUND’S BUSINESS MODEL, IT IS NOT POSSIBLE TO FORESEE AND PREVENT ALL POSSIBLE CONFLICTS OF INTEREST THAT MIGHT ARISE OVER THE LIFESPAN OF THE COMPANY. AT THE TIME MATERIAL WAS PUBLISHED, CRYPTOCURRENCY CAPITAL LLC, ITS AFFILIATES, OR ITS PRINCIPALS, MAY HOLD LONG/SHORT POSITIONS IN THIS PARTICULAR COIN.
Written by:
Arham Bheda
Senior Research Analyst

BTCUSD Resistance Level - Fib ConfluenceBITFINEX:BTCUSD
The precision of the confluence between the two fib retracement levels struck me when I was plotting out resistance levels. On that basis I suggest keeping a close eye when price reaches 12,961. A break above would be very bullish but I think it is likely there will be some retracement from near the 12,961 level before the next wave up.

abcd Fibonacci Bear Pattern. Bear Fibonnacci with Tp at 1.27 reciprocal i wont be surprised if it broke down into the second tp which i did mark with a blue line, we can see that we are still in a bullish up trend however we did break our previous low which will put us in a short term bearish trend, i will except gold to fall im waiting for a reversal bear candle, i will finish this analysis when i get the confirmation

GOLD : Buying opportunityWaiting for more accumulation to come and a false break of recent lows , then enter long where first TP will be 1345 zone and ultimate target will be 1400 zone.
*We might get another smaller bullish h&s pattern before the rise.
Best of luck :-)

AUDCAD LONG; 2 FIB LEVELS, TRENDLINE & PRICE ACTIONAUDCAD LONG
- 2 fib levels crossover
- Price wicking from the zone and trendline
JOIN our channel for more :)
t.me

ButtcoinFor now bearish divergence.
Correction wave still active.
Much support, such waves. wow
Very messy and extra, so sorry.
8-9k such confluence of trendlines, previous tops, fib levels and lower end of channels.
Green = buy.
Let the good news come in from mid-february.

USDJPY WeeklyPrice back at strong support, & its weekly uptrend line that has been respected though-out time & I believe will be extremely hard to break though. So from here the bulls may return..

CRUDE OIL - Buying opportunityCRUDE OIL main trend is up and i'm looking to buy the current bearih H&S pattern .
S&R marked on the chart and targets above around the blue lines.
Best of luck :-)

EURAUD buy opportunityA clear rejection on price action s&r with fibonacci confluence might be the low of the next leg to the upside .
So, i'm looking to buy on the break of 1.5330 where the first target will be 1.549 and ultimate target 1.6 zone.
Best of luck :-)

XRPUSD: Long to resistance at Fib and Gann Fan confluenceSo XRP is putting in a decent recovery from the Great Crypto Crash of Jan 2018. Based on having broken out of the downtrend marked by the channel, as well as seeing the drop since the ATH as a three wave correction with wave C completing at the 0.786 extension level (see linked idea, in comments) - we can have a level of confidence that we have exited the corrective phase and are in the early phases of a new bullish impulsive wave.
Our target for this trade is not to Hodl or shoot for the moon, I am hoping that enough people learnt the risks of that in this recent corrective phase. We are simply targeting a very precise looking Fibonacci confluence level which is also strengthened where it meets the Gann fan. I think there is a fairly strong case for this Gann fan overlay, looking at the price history.
Best of luck!

GBPJPY short opportunity at resistance level 153.250Look at all the fib confluence at the resistance level. We can look to enter short within this point in the market. Market just broke and closed above previous structure resistance which indicates a further move to the upside. Next level to look for is within that red zone at which we can look for a short entry. Stops would be placed above 153.400 even handle and we could shoot for targets back down into 152.800s

AJ Possibility for a short moveDownside movement possible if respection of the TL occurs. Confluence with 61.8, flat div. on LTF
Trend continuation.
May be a possibility to buy after if the price action completes the harmonic pattern.

GBP/CHF : Quick Trade & High R/R Here is a nice entry on GBP/CHF .
Accumulation of :
- Bullish Structure
- Fib Confluance
- Trendline retest
- Standard deviation
- Oversold
- Support zone
-ABCD pattern
2018 Will be a great year for me and my followers , don't miss the train !
Put your stop in profit when the first target is hit
Good luck ! :)

BTCUSD - FUD and Panic!BITSTAMP:BTCUSD
Time frame - 1D
CALM YO TITS GUYS! IT IS NOT YET THE END! :-)
First things first, it ALWAYS respects the 50 period moving average (yellow circles), so you can add that indicator to your charts.
The price bounced off the strong confluence of fibonacci levels .382 and .236. FIBONACCI WORKS GUYS! Especially when they have confluence like this.
Re-test of the .236 and .5 fib levels. If the price breaks through above that level, I'd say sky is the limit!
BUT if it fails to do so, we might see it go down 12k-11k level before bouncing back again.
The way I see it, the bears always lose the tug-of-war so we might see the rainbow again soon.
GOOD LUCK TRADERS! ;-)

USDJPY 4h Long- Trendline Bounce + Pivot Point Support + Low RSILooking at USDJPY on the 4h timeframe we can see a clear trendline bounce with 2 confirmation candles. Low RSI shows a clear oversold making the trendline hard to break. Adding to the support there is the pivot point just on the trendline. Targets towards the top trendline but being cautious of the MA zone that is on the P pivot point acting as resistance.

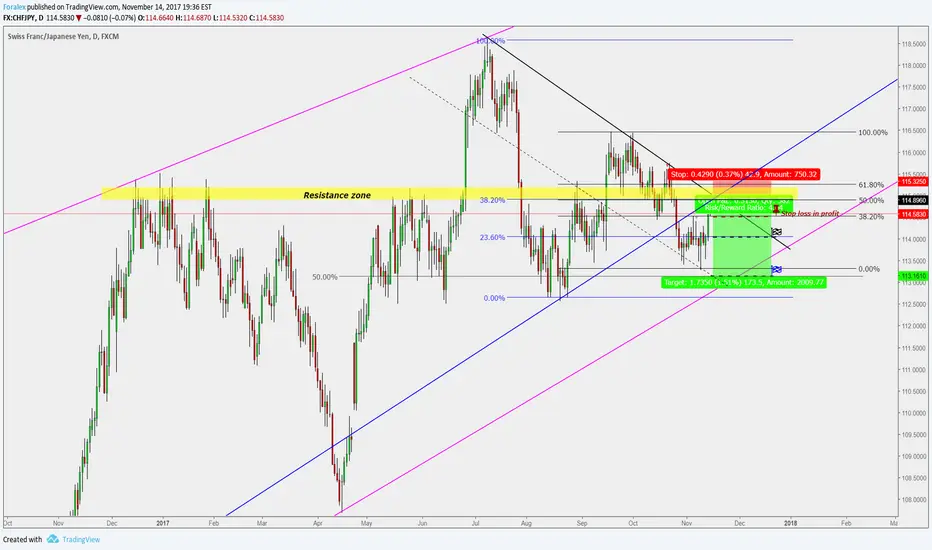
CHF/JPY : Daily Short entry #2 ( Another 200 Pips ?? )Hey guys
Here is an update of my previous short setup of CHFJPY
Accumulation of :
- Retest of strong blue trendline
- Bearish structure
- Need to tap the pink trendline
- Fib confluance
- Resistance zone
Good luck !
/
AUD/CAD : Short Entry (H4)Hey guys !
Here is a nice potential entry on audcad
Accumulation of :
- Downtrend
-Resistance zone
-Fib confluance
-Standard deviation
Good luck & Follow me for more :) !


USDCAD BRILLIANT SHORT OPPORTUNITY!! USDCAD is definitely still on its way down still despite the news events of the interest rates. Brilliant sell opportunity . Its shot up due to that purely and had retraced right into the Holy grail of the .618 fib. This doesn't mean that it can't still reach the .786 fib but, in conjunction with the downward CTL, and the monthly resistance, of 1.28000 lining up perfectly with the .618, this pair is going to continue to melt!
**************************************************************************************************************************************************************************************************************************************************

EURUSD - Looking to buy in support zoneEU main trend is up and made h&s pattern that failed - many entered short but price moved up against them .
Yellow zones of confluence marked on the chart , there i'll try to buy the lows with falsebreaks/reversal patterns.
Everything is on the chart...
Best of luck :-)

USOIL - intraday buying spotWas out from the last position after a sharp move down and now looking to buy inside the day using fibs + support + waiting for the false break .
Keep looking for the low risk high reward trades.
Best of luck :-)
