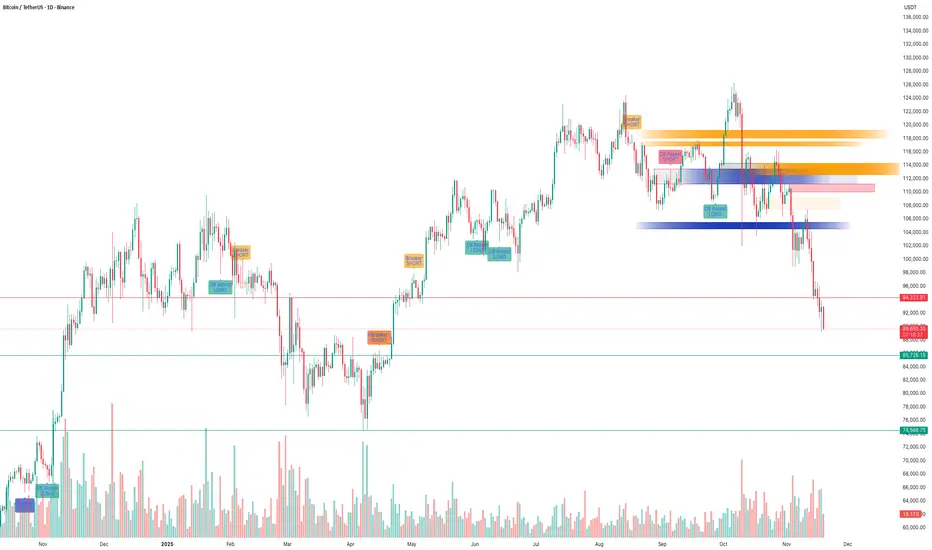
BTC – SMC Suite Follow-Up: Liquidity Grab at 116K and the Drop!!BTC – SMC Suite Follow-Up: Liquidity Grab at 116K and the Drop That Followed
This is a follow-up to my earlier idea “ BTC – Liquidity Grab at $116K Before Deep Correction? ” where I highlighted the danger of price trading into stacked SMC levels on the 1D chart.
1️⃣ Quick recap of the original idea
In the previous post, price was trading around the $112K–$116K zone.
Using the SMC Suite on the 1D chart, I highlighted:
• A high-timeframe supply / OB cluster around 116K.
• A liquidity grab above prior highs – price spiked into fresh liquidity sitting above the range.
• A confluence of Breaker + OB Re-test + FVG acting as a “danger zone” for fresh longs.
• The idea that this move could be a distribution / liquidity grab before a deeper correction.
The key message was: this is not a safe place to be aggressive long; watch for rejection and potential downside.
2️⃣ How price reacted afterwards
Since that post:
• Price respected the 116K zone as supply – every attempt to hold above it failed.
• The highlighted OB + Breaker block acted as a ceiling; price consolidated there and then rolled over.
• After losing the mid-range structure, BTC started a trend of lower highs and lower lows , confirming distribution.
• We have now traded all the way down into the d emand / support zones below 92K and then lower , which were also plotted in advance by the same SMC levels.
In simple terms, the area we marked as a “ danger zone for longs ” turned out to be the top of the move before this large downside leg.
3️⃣ What the SMC levels showed well
This move is a nice case study of how the SMC concepts aligned:
• Liquidity Sweep : Price ran above previous highs into fresh liquidity, then failed to hold.
• Breaker + OB Re-test : Former demand became supply; retest of this breaker block rejected price.
• FVG + Imbalance Zones : Upside imbalances got filled and then flipped into resistance.
• Structure Shift : After the rejection, market structure shifted bearish with clean breaks of prior swing lows.
None of this is about “perfect prediction”, but about reading where smart money might be offloading risk and where retail is most vulnerable.
4️⃣ Takeaways & what I’m watching next
• HTF SMC levels matter. When multiple concepts cluster (Breaker, OB, FVG, previous highs), treat that zone with respect.
• Liquidity grabs at highs are great warning signals – especially when followed by a clear structure shift.
• For now, I’m watching how price behaves around the current demand zones and whether we see:
• Strong rejection + reclaim of broken levels (potential swing-long areas), or
• Continuation of lower highs pointing to further downside.
This post is for educational purposes only, not financial advice.
Consolidation-breakout
CAD/JPY: Multiple Time Frame Analysis & PlanFollowing a breakthrough of a significant daily structural resistance yesterday.
📈CADJPY is currently consolidating within a horizontal range on an hourly timeframe.
For those seeking an intraday buying opportunity, a bullish breach of the range's resistance, specifically an hourly candle closing above 110.65, would provide a strong bullish confirmation.
A subsequent bullish continuation would then be anticipated, at least to the 111.00 level.

CHF/JPY: Local Bearish Reversal?!We are observing a notable bearish reaction on a significant daily/intraday horizontal resistance level on CHFJPY.
Following a test of the highlighted blue area, the price started to consolidate, forming a horizontal range on a 4-hour timeframe.
The violation of this range's support level is an important signal of increased selling pressure.
Consequently, we anticipate a continued bearish trend, with a projected target of at least 189.66.

USDJPY BreakoutPrice has been consolidating since early August and has formed a clear 4-hour horizontal channel.
This week's news may cause a USDJPY breakout:
Tuesday, 16th September, US Retail Sales
Wednesday, 17th September, 🚨 FOMC, Fed Interest Rate Decision, Fed Press Conference 🚨
Friday, 19th September, Inflation for Japan, BOJ Interest Rate Decision

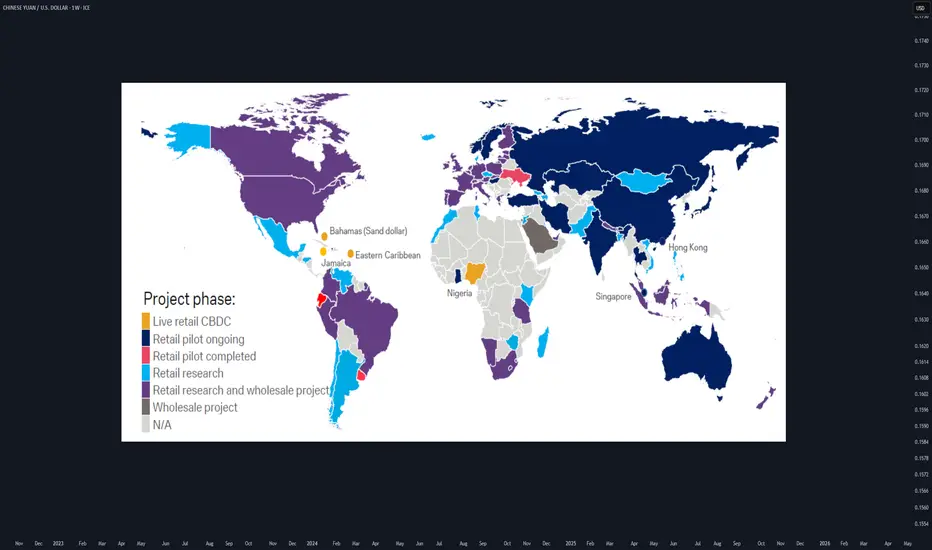
CBDCs for FXTraders :Your 2025 Guide to Digital Currency MarketsWhat if the U.S. dollar or Chinese yuan you’re trading today becomes digital tomorrow?
As of 2025, 132 countries are piloting Central Bank Digital Currencies (CBDCs) , with China’s digital yuan already in 260 million wallets. This isn’t sci-fi—it’s happening now, and it’s about to shake up forex markets.
hey I’m Skeptic :) At Skeptic Lab , we don’t chase hype—we dissect it. CBDCs are the next frontier, and I’m here to show you how to trade this shift without getting burned. In this guide, you’ll learn what CBDCs are, how they’ll mess with pairs like CNY/USD , and a beginner-friendly strategy to profit from the chaos. Let’s get ahead of the curve.
What Are CBDCs? A No-BS Breakdown
Central Bank Digital Currencies are digital versions of fiat money, backed by central banks. Think digital yuan or digital USD—same value, but on a blockchain or centralized ledger.
132 countries , including China (260M digital yuan wallets), India (digital rupee pilots), and the EU (digital euro trials), are testing CBDCs in 2025. Why? Control, speed, and lower transaction costs.
Unlike crypto, CBDCs are tied to fiat, so they’ll directly impact pairs like CNY/USD, INR/USD, or EUR/USD. Expect new volatility patterns and liquidity shifts.
I’m not sold on CBDCs being a trader’s paradise yet—central banks love control, and that could mean less freedom ( I hate XRP too, but I trade it when it gives my fuking trigger... ). But the opportunity is real if you know how to play it.
How CBDCs Will Shake Up Forex Markets
CBDCs could make cross-border transactions faster, boosting liquidity for pairs like CNY/USD. China’s digital yuan is already used in global trade pilots.
As countries roll out CBDCs, expect short-term price swings. For example, CNY/USD could spike if digital yuan adoption outpaces expectations.
Central banks might tighten forex controls with CBDCs, impacting leverage or spreads. Stay sharp—regulations are coming. Focus on CNY/USD (China’s digital yuan is live), INR/USD (India’s pilot is scaling), and EUR/USD (digital euro trials are accelerating). The hype says CBDCs will streamline forex, but I’m skeptical—centralized digital money could mean more manipulation. Still, volatility is a trader’s friend if you’re prepared.
Trading Strategy—Range Trading CNY/USD
Why CNY/USD? “China’s digital yuan is the most advanced CBDC, with 260M wallets and growing global use. CNY/USD is volatile but often range-bound, perfect for beginners.
Step-by-Step Strategy:
Identify the Range: “On TradingView, use daily charts to spot CNY/USD’s Range boxes ( Consolidation phases ). Look for consolidation after CBDC news. ”
Enter the Trade: “Buy after resistance breakout (breakout above consolidation box); sell after support breakout (breakout below our consolidation box). Set a stop-loss bellow the breakout candle or previous low in lower time frames(4h. ) or below previous support (4h) or above resistance and high (if you go for short).”
Take Profits: “clone the consolidation box and put it above or below the previous box. take partial profit (35% at rrr of 2 then 40% at rrr of 5 then 20% at rrr of 10 and close the rest when we formed lower highs and lower lows (based on dav theory)”
Risk Management: “ Risk only 1-2% of your account per trade. CBDC news can be fakout so have your other confirmations (such as RSI and PIVOT POINTS etc.)
Range trading isn’t sexy, but it’s steady. CNY/USD’s CBDC-driven swings make it a solid pick for 2025—just don’t get greedy.
Risks and What to Watch in 2025
CBDCs could tighten central bank control, reducing forex flexibility. Sudden policy shifts (e.g., China banning crypto trades again) could tank CNY/USD . Plus, tech glitches in CBDC rollouts might cause market freezes. Track CBDC adoption news on X—look for updates on China’s digital yuan, India’s rupee, or EU trials. Follow central bank announcements and IMF reports for clues.
I’m all in on spotting trends early, but CBDCs aren’t a free lunch. Stay skeptical , trade small, and always have an exit plan.
What’s your take on CBDCs in forex? Drop your thoughts bellow , and let’s debate!
Boost for more Skeptic takes :) 📈
Disclaimer: This article was written for educational purposes only and should not be taken as investment advice.
Conslidation Box
Closed at 9.14 (23-05-2025)
Trying to break the long consolidation box.
Important Support Zone is around 8 - 8.70
Channel bottom is around 5.30 which seems
unlikely as of now because of Bullish Divergence
on weekly tf.
Upside targets can be around 11 & then around 14

Sol breakout/breakdownSOL is consolidating in a broad range between roughly $160 and $218.
The strategy is to buy on a decisive breakout above $218 with strong volume confirmation, aiming for continuation toward higher targets. Failure to break out could trigger a retest of lower support levels in the $160 region.

XRP Consolidation pattern breakout imminentLooks to me like XRP is breaking out of a rectangle or consolidation pattern as we speak.
Pattern formed since NOvember 2024 and since then XRP has been trading in this range.
Our current weekly candle is clearly in the process of attempting a breakout above the upper band or resistance trendline of the consolidation pattern.
We still have a day for candle close of this week.
Look to see if a potential engulfing candle print occurs or not.
Also note, this is by no means confirmation of the pattern break. We would need a concise bullish candle pattern for the next week to print for COnfirmation.
If we do confirm breakout. XRP will be back in price discovery mode like BTC. And i personally wouldn't sleep on it.
Its one of the better performers in crypto and seems like to me with every passing day a major player like BTC. (Opinion based on TA)
I would also monitor the MACD indicator. Observe for increasing histogram bars and deep green color as well as bullish cross.
On Macro timeframes, being above the 0 line on MACD is always bullish until we cross below.

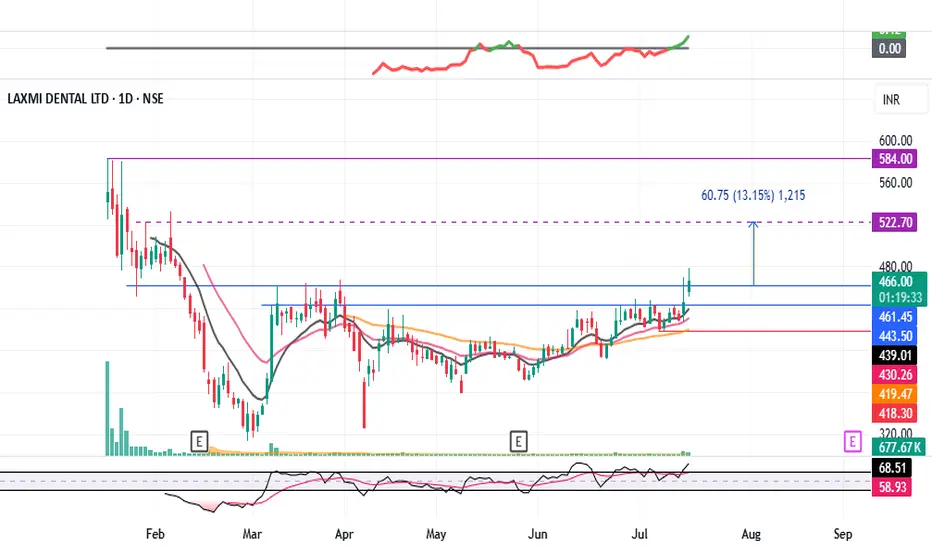
LAXMIDENTL : Consolidation Breakout#LAXMIDENTL #breakout #breakouttrading #ipostock
LAXMIDENTL : Swing Trade
>> Consolidation Breakout
>> Volumes Building up
>> Stock in Momentum
>> Good Strength in stock
>> Trending setup
Swing Traders can lock profit at 10% and keep trailing
Pls Boost, Comment & Follow for more analysis
Disc : Charts shared are for Learning purpose not a Trade Recommendation, Take postions only after consulting your Financial Advisor or a SEBI Registered Advisor.
Hero MotoCorp — Daily Chart Breakout Trade SetupHero MotoCorp — Daily Chart Breakout Trade Setup
Range Bound: The stock has been consolidating between ₹4,170–₹4,400 for the past several weeks.
Structure: This is a classic rectangle consolidation, often a continuation pattern.
Volume: Watch for volume expansion on the breakout; prior breakouts lacked follow-through due to low volumes.
Higher Timeframe (Weekly/Monthly) charts show a bullish continuation since mid-May, with high-volume candles across weekly and monthly charts
Key resistance zones: Weekly resistance lies between ₹4,930–₹5,000.
Strong fundamental macro tailwinds: March sales show robust performance in both domestic ICE and EV segments (Vida)
🔍 Key Confirmation Signals for a Potential Trade
✅ Strong daily candle close above ₹4,420
✅ Above-average volume on breakout
✅ RSI crossing 60 on breakout adds momentum confirmation
⚠️ Risk Management Notes
Avoid early entry within the range (false breakouts possible)
Wait for EOD close above resistance for confirmation
Consider a trailing SL once the stock crosses ₹4,500

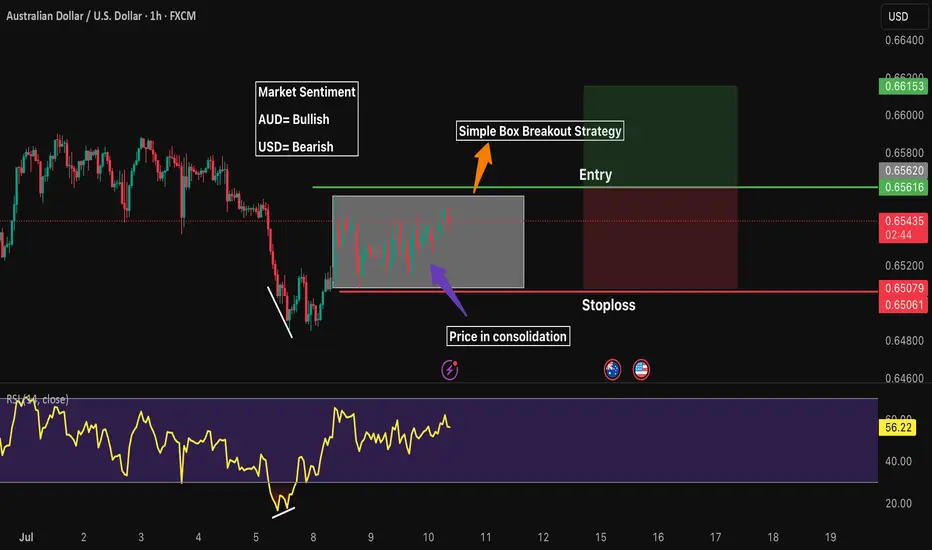
AUDUSD 1H LongMarket Sentiment
AUD= Bullish
USD= Bearish
Waiting for price to breakout from its consolidation box
RR 1:1
EUR/USD breakout awaiting EUR/USD has not provided a clear structure over the past week or two. The pair appears to be in consolidation, building liquidity on both sides of the current range. At the moment, I’m waiting for a decisive breakout, ideally followed by distribution within the monthly supply zone, although that zone is still some distance away.
This week, my focus will be on whether a new supply zone forms, closer to current price. If price sweeps the nearby equal highs and then shows signs of reversal, this could give us a fresh supply area to work from. Alternatively, if price moves lower, I’ll be looking at the 8-hour demand zone around 1.16000 for a possible long setup.
Confluences for EUR/USD:
- Although price has been slightly bullish, the current consolidation phase suggests a potential reversal could be on the horizon.
- Liquidity is building on both sides of the range, making a reaction from the monthly supply zone increasingly probable.
- There’s significant downside liquidity still untapped, such as Asia session lows, which could serve as short-term targets.
- For clearer confirmation, we still need a decisive break in market structure to the downside.
P.S. If price sweeps the lower liquidity and moves into the 8-hour demand zone near 1.16000, I will be watching for accumulation to form and signs of bullish intent from there.

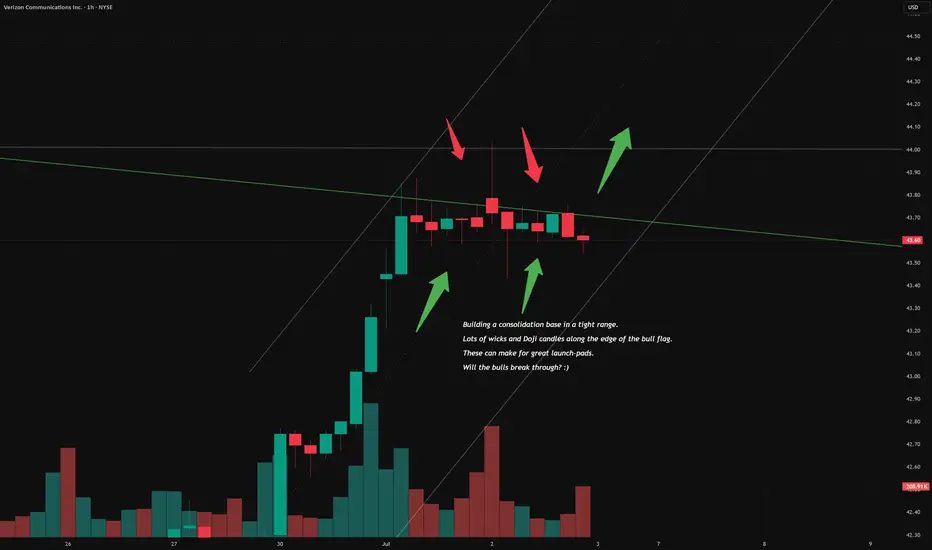
The battle has begun for VZ glory.Just taking a look at the hourly chart and it looks like the bulls broke through resistance, but the bears were able to push them back, for now at least. Every time the bears push the price down, the bulls push it right back up to the edge.
This is bullish IMO. It gives bears less liquidity to slow down the move upwards when the range is so tight. It will be interesting to see how things unfold.
Watch for high volume at the end of the session.
"The clock is ticking bears. Join us! JOIN THE LIGHT! DO IT FOR GLORY!" 🤣
HAL: fake breakdown and a possible bullish move.Stock: Hindustan Aeronautics Ltd NSE:HAL
• Timeframe: 1-day candles (each candle represents one day of trading)
1. Consolidation Zone: A grey rectangular box highlights an area of "consolidation" starting from around May 14th. This means the stock price has been trading sideways within a relatively narrow range, not showing a clear uptrend or downtrend.
2. Fake Breakdown: An arrow points to a price dip below the lower boundary of the consolidation zone. The annotation calls this a "fake breakdown." This implies that the price temporarily moved below the support level, but then quickly bounced back up.
3. Potential Trade Setup: The chart suggests a potential long (buy) trade based on the fake breakdown and the subsequent recovery.
• Entry Point: Around 4,897.55 (labeled "ENTRY" on the chart) which is the price at which the stock could be bought.
• Stop Loss: Around 4,733.75 (likely intended to be the "4733.60")
This is the level below which the trader would exit the position to limit potential losses if the price moves against them.
• Targets: The chart identifies three potential profit targets:
* Target 1: 5,087.85
* Target 2: 5,305.15
* Target 3: 5,497.80

EUR/JPY Analysis – Flag Breakout Signals Further UpsideHello Traders,
It's been a while. I trust you are good.
Kindly find below my analysis of EURJPY currency pair.
Overview:
EUR/JPY has been consolidating within a bullish flag pattern, characterized by lower highs and lower lows over the past few trading sessions. Price action has now broken above the flag’s resistance, indicating a possible continuation of the broader bullish trend.
Idea:
The breakout above the bullish flag suggests that bulls are regaining control. Price is currently hovering around 169.370, having just cleared the wedge’s resistance line.
Key levels to monitor:
1. Support Zone: Around 169.200–169.300
2. Resistance Level: 169.699
Trade setup:
Entry: On a successful breakout or break and retest of 169.200–169.300.
Stop Loss: Below 168.816 (beneath the flag's support and recent swing low).
Targets: TP1: 169.699, TP2: 170.000–170.200
Conclusion:
EUR/JPY has broken out of a bullish flag pattern, signaling momentum shift in favor of buyers. If price sustains above the breakout zone or clears 169.699 resistance, we may see an extended rally toward the 170.000 mark. Trade with caution.
Cheers and happy trading.

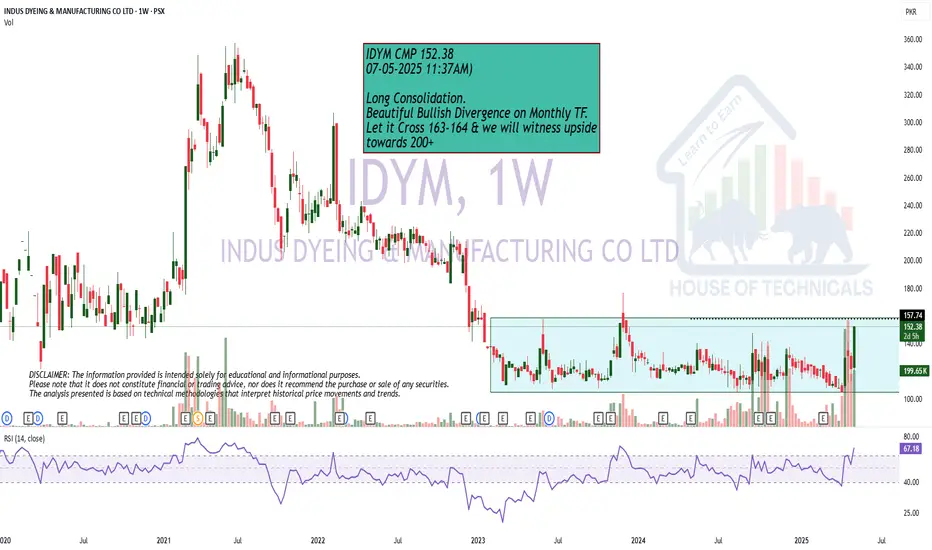
Long ConsolidationBNWM Analysis
Closed at 63.48 (18-06-2025)
Long Consolidation of 9 - 10 years almost.
Now either wait for Breakout above 69; or
Wait for a Good Support around 35 - 43.
Once 69 is Crossed & Sustained with Good
Volumes, we may witness 100+

this was depend on consolidation area which people are confuse this idea for only education purpose take action on your own risk and that this was going in uptrend this idea on price action study of candle sticks after one hour uptrand was going to starts be ready for your own risk

Momentum Trade in Likhitha Infra1. Positive Divergence on RSI
2. Good Volume
3. Consolidation Breakout
4. RSI near 70
5. MACD signal turning green
NEAR’s Pullback Zone Found — Is $4 Next?NEAR just pulled off a +50% rally from the 0.618 Fibonacci retracement at $2.224 — a strong show of force from the bulls. After that explosive move, price is now cooling off in a consolidation phase, preparing for the next leg higher.
🟢 Long Setup — Dip Before Lift?
The next high-probability long zone lies between:
$3.026 – $2.94
Possible but less likely of a deeper dip to $2.78 (0.5 Fib of the recent move)
Long entries can be laddered between $3.00 and $2.90 (even $2.80 if volatility kicks in).
Stop-Loss: Below the daily 21 EMA ($2.7344) and 21 SMA ($2.6739)
Target: $4.00
R:R: ~4:1 — clean and structured
This setup aligns with standard continuation behaviour after strong impulses — consolidation, retrace, and resume.
🔴 Short Setup (on Rejection at $4.00)
Entry: ~$4.00
Stop-Loss: Above $4.25
Target: Yearly open (~$3.65)
R:R: ~1.5:1 — not ideal, but valid on confirmation
🎯 Summary
NEAR is consolidating after a strong move — either ready to continue higher or retest deeper into Fib support
Long zone: $3.00–$2.90 (poss. $2.80)
Short zone: $4.00 (on rejection only)
Simple structure, clean risk, and nothing forced — exactly how it should be.
Sometimes, less is more. Let price show the next move. Stay ready. 📈
___________________________________
If you found this helpful, leave a like and comment below! Got requests for the next technical analysis? Let me know.

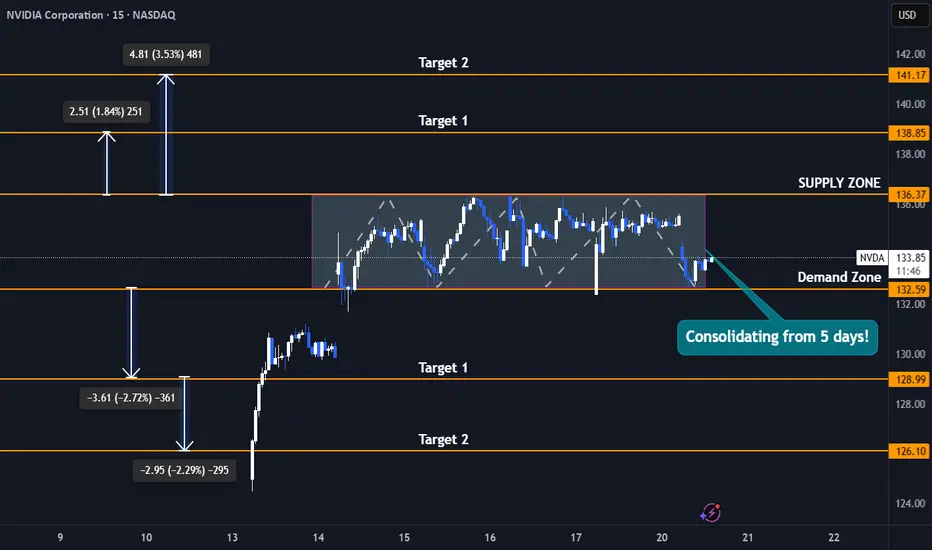
Nvidia Stock 5-Day Consolidation Breakout - Uptrend or Pullback?Trade Duration: Intraday
Trade Type: Breakout
- Nvidia is currently consolidating tightly between $132 and $136, forming a narrow range that reflects a balance between buyers and sellers unwilling to relinquish control. This range-bound action signals indecision, but it won’t last indefinitely.
- Typically, the longer the consolidation, the more significant the subsequent move. As new participants enter the market, a breakout—whether upward or downward—can trigger a powerful surge.
- This move is often amplified by breakout buyers joining in and stop-loss orders of trapped traders being triggered, creating an ideal setup for an intraday breakout trade.
- I plan to initiate either a buy or sell position depending on the breakout direction, capitalizing on the momentum generated by this tight consolidation phase.
Upside Targets : 138$ and 141$
Downside Targets : 128$ and 126$
Monthly Closing above 7.50 - 7.60 will be very healthy!
Monthly Closing above 7.50 - 7.60
would be a very healthy sign.
We may then easily witness upside
towards 8.70 - 9.10 & then 10.50 - 11
Remember it is in a long consolidation
with Slowly moving in an Upward Channel.

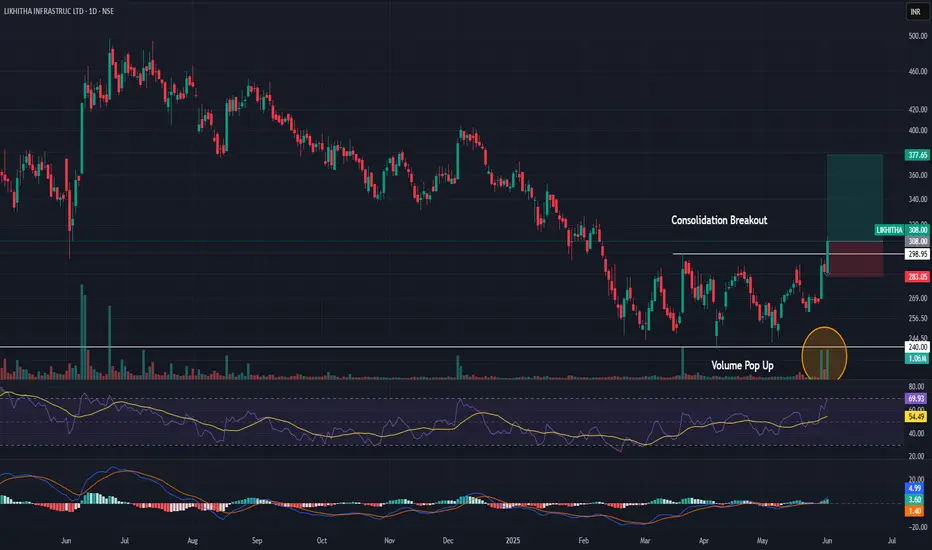
Near BreakoutLong Consolidation.
Beautiful Bullish Divergence on Monthly TF.
Let it Cross 163-164 & we will witness upside
towards 200+
EURUSD - Analysis and Potential Setups (Intraday- 22.04.25)Overall Trend & Context:
This pair is in an overall uptrend and has broken above last weeks highs.
Technical Findings:
Price is trading above 25, 50,100 and 200 EMA's on the daily and 4H charts.
Overall Bullish price action is evident.
Price has been consolidating through London session thus far, we can expect a tap into the demand below the liquidity (relative equal lows) before continuation of bullish cycles.
Notes:
Price is currently at a weekly supply level, we may bounce in and out of it a few times, so manage your risk and take this setup based on your own analysis as well.
