Exceeding expectationsA chain reaction of the momentum in the market burst beyond expectation.
Excellent form from the mtops-ai
Contains image

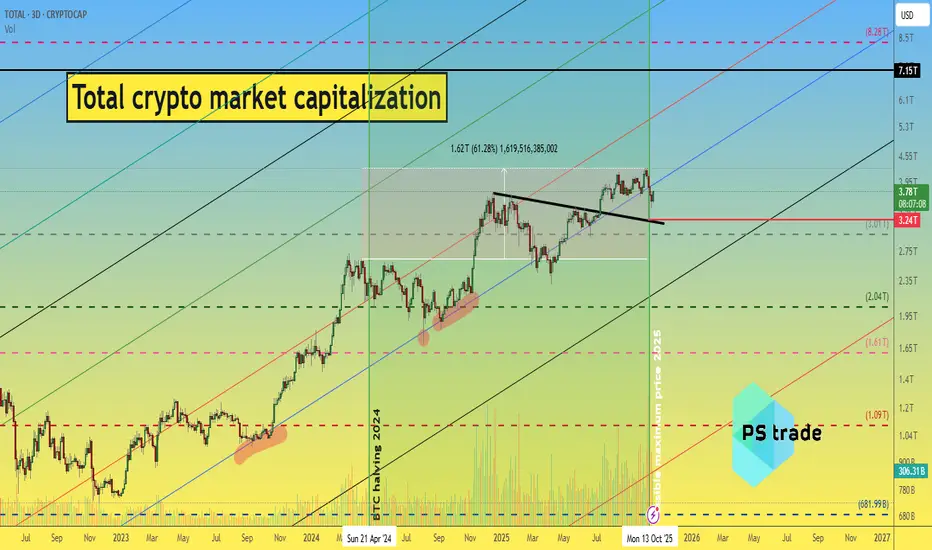
Total Crypto Market Cap – End of Cycle or Extended Phase?📊 Today let’s talk about the total crypto market capitalization.
Scrolling through the charts today, we were both surprised — and a bit shocked 😅 — to see that the current market drop perfectly aligns with the end of the cycle we calculated three years ago!
👉 Back in November 2022, we released a series of ideas —
for CRYPTOCAP:BTC price ($15–16K)
and for total crypto market cap ($750–800B),
stating that it was the bottom before the next major growth phase.
And yes, in 2024 we continued these reflections (thankfully, the internet remembers everything 😉).
Unfortunately, the current post-halving cycle turned out much calmer than the previous ones.
📉 Only +60% or roughly x2 from lows to highs...
Pretty modest compared to 2017 or 2020–21 🤷♂️
Big players have entered the game — and now they’re teaching crypto traders to be happy with smaller profits.
Still, we believe this growth cycle isn’t over yet — it’s just entered extra time ⚡
🔹 The October 11th drop on the global market cap chart was barely noticeable — heavyweights held surprisingly strong.
🔹 A clean retest took place, which is technically a positive sign.
🔹 When compared to the USDT.D chart, a ray of hope for 2026 appears 🌅
🔹 And if we ever get that “lucky x2” rise in total market cap — hopefully it’ll come mostly from alts, not just the Top 5–10 giants!
🤔 What do you think — are we just in the calm before the next big wave,
or is crypto’s best chapter already behind us?
______________
◆ Follow us ❤️ for daily crypto insights & updates!
🚀 Don’t miss out on important market moves
🧠 DYOR | This is not financial advice, just thinking out loud
GOLD SLOWS MOMENTUM DUE TO 'NO TOMAHAWKS' FOR YELLOW-BLUES. BUT.Gold tumbled more than 5% to around $4,130 per ounce on Tuesday, poised for their biggest daily drop since August 2020, after touching a record high near $4,380 ahead of Trump talks on Friday 17, 2025 about Tomahawk missiles for the yellow-blue doggone regime.
The decline comes as profit-taking accelerated and the US dollar strengthened, while safe-haven demand eased amid improving global sentiment.
Moreover pptimism grew over easing US–China trade tensions, with Presidents Donald Trump and Xi Jinping scheduled to meet next week to address tariff disputes and avoid further escalation.
The end of the seasonal gold-buying spree in India also weighed on physical demand.
Meanwhile, there were expectations also that the US government shutdown could be resolved this week and anticipation of Friday’s delayed US inflation data.
However markets continue to price in a 25-basis-point Fed rate cut next week, with another reduction likely in December.
Also, despite the pullback, gold remains up near 60% year-to-date, supported by expectations of further Fed easing and further lingering demand for safe-haven assets.
The main technical chart says Gold still is on the upside path.
--
Best wishes,
@PandorraResearch Team

$STBL (4-HOUR): LONG set-up TRIGGERED, entry from $0.125...Ok so this AQUISUK:STBL LONG set-up has now been triggered at 12.5c.
STOP loss and TPs in the quoted post, no changes.
Bullish RSI hidden divergence so this reversal is getting more realistic. Nice volumes recently and these are needed to support the pivot.
Targets between 17.5c and 21c, highly unlikely to not correct harder from this approximate zone.
Game on, remember that CRYPTOCAP:BTC could only be doing a DEAD CAT move and fizzle out around $116k and $117k.
💙👽

#BTC retests support📊 #BTC retests support✔️
🧠From a structural perspective, we broke out of the divergence zone and retested support near 107,400. While we experienced a pullback as expected, we canceled our short position due to our aggressive short position yesterday.
➡️However, we entered a new long position at support near 107,400. The upward trend is currently positive, and we are attacking the short position. Hopefully, we'll succeed!
Let's see 👀
🤜If you like my analysis, please like 💖 and share 💬
BITGET:BTCUSDT.P

Gold Trend Shift (4hr) Time frameDescription
✅ Trend Shift : Price broke the previous bullish structure — short-term bearish momentum confirmed.
🔹 Breaker Level : Previous swing high now acts as potential resistance on any retrace.
🔹 Demand Zone : Strong buyer interest around 4,000–4,050 — watch for bullish reversal signals.
📈 Potential Move :
1. Price may drop toward the demand zone.
2. Buyers reacting here could push price back to the breaker level.
3. Reclaiming the breaker could signal continuation toward next order block: 4,300–4,350.
⚡ Key Takeaways:
Monitor the demand zone for bullish confirmations.
Breaker retest = high-probability buy setup.
Risk management is essential — structure shows a clear shift from bullish → bearish.
#DYOR

Winter Is ComingCan you feel the chill in the market?
Charts look silent, but deep down, something massive is moving.
Winter is coming and only the prepared will survive.
Hello✌️
Spend 2 minutes ⏰ reading this educational material.
🎯 Analytical Insight on Ripple:
XRP is testing a strong support while moving on the descending channel. A confirmed breakout with solid volume could drive a 20% rally, targeting 2.90$. 📊🚀
Now , let's dive into the educational section,
🌐 Signs of the Coming Winter
Every crypto cycle has its cold season the phase when volumes dry up, fear rises, and confidence slowly fades. Experienced traders spot the signs before the crowd. One of the best ways to detect this shift on TradingView is through the Volume Profile. It reveals where most trading activity has occurred and how liquidity is shifting.
When the market starts losing momentum, volume drops near resistance zones. Combine this with RSI, and the picture gets clearer: if RSI floats between 40 and 60 for too long without breaking higher, buyers are losing strength. That’s usually when the air turns cold.
🧭 TradingView Tools for Surviving the Winter
When markets freeze, precision becomes survival. The combination of the 200-Day Moving Average and the Ichimoku Cloud works like a compass in the storm. If price stays below the MA200 and inside the Ichimoku Cloud, the trend is still in the bearish zone.
Use TradingView’s Alert System to set notifications at major support and resistance levels. This way, you won’t miss key moments and more importantly, your decisions won’t be emotional. Winter rewards discipline, not luck.
💭 The Trader’s Mind in Cold Markets
The real winter starts in the trader’s mind. When fear dominates, many fall into Paralysis by Analysis endless studying, no action.
Keep a Trading Journal, plan your scenarios before they happen, and define your stop-loss tolerance. Having pre-written plans transforms hesitation into confidence. Winter isn’t the time to doubt yourself it’s the time to stay systematic.
🧊 The Role of Whales in Shifting Seasons
Whales always sense the change of season first. When large on-chain transactions increase, something big is brewing.
By monitoring On-Chain Indicators in TradingView, you can see if capital is flowing into or out of wallets.
But remember: this data isn’t an instant buy or sell signal it’s a quiet warning. Whales move in silence, and only those listening closely catch the shift before it’s visible on the charts.
🕯️ After Every Winter, a Dawn Arrives
No bear market lasts forever. After every decline, there’s a point where sellers get exhausted that’s when smart money starts accumulating.
Using Dollar Cost Averaging (DCA) during the cold phase builds powerful long-term positions. Winter is not the time to run; it’s the time to build.
🧩“Winter Is Coming”
defines the psychology of every bear market. It’s the reminder that downturns are natural, that every bullish phase ends with exhaustion, and that the real professionals are those who prepare when others celebrate.
The “winter” of the crypto market symbolizes declining liquidity, fading momentum, and emotional fatigue. Surviving it requires discipline, patience, and smart use of tools like TradingView’s Volume Profile, RSI, and Alerts.
In both markets and life, winter always comes but for those who plan ahead, it’s not the end. It’s the beginning of the next opportunity cycle.
Always analyze indicators before entering a trade – never let emotions dictate your actions.
Set stop-losses and manage risk – protecting capital is more important than short-term gains.
✨ Need a little love!
We pour love into every post your support keeps us inspired! 💛 Don’t be shy, we’d love to hear from you on comments. Big thanks, Mad Whale 🐋
📜Please make sure to do your own research before investing, and review the disclaimer provided at the end of each post

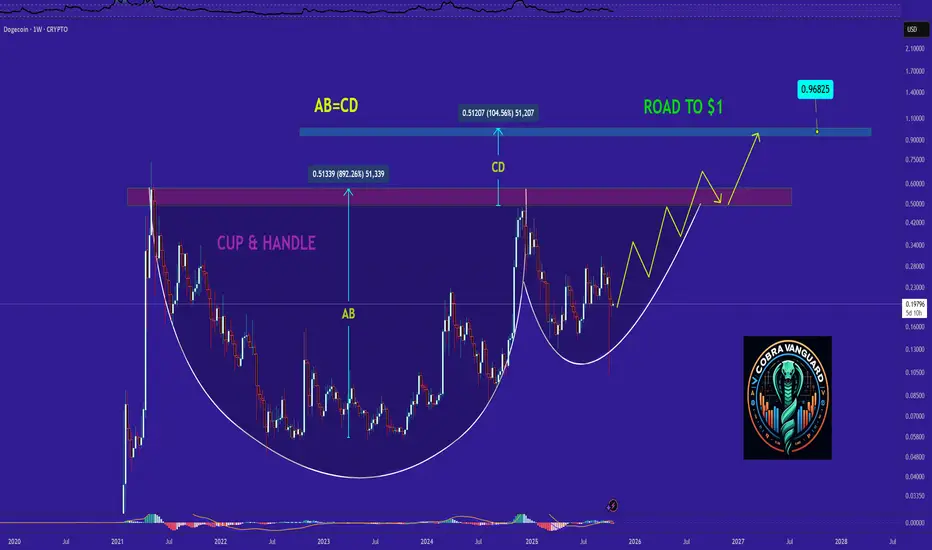
Can we be optimistic that this will come true?No matter how bad Dogecoin looks on lower timeframes, the higher timeframes tell a different story—one of strength and potential. As you can see, the weekly chart has formed a large Cup and Handle pattern. If this pattern breaks out, the price could easily surge above $1. So be patient and stay alert, because you don’t want to miss the next bull run.
Unfortunately, the harsh truth is that 99% of you *will* miss it.
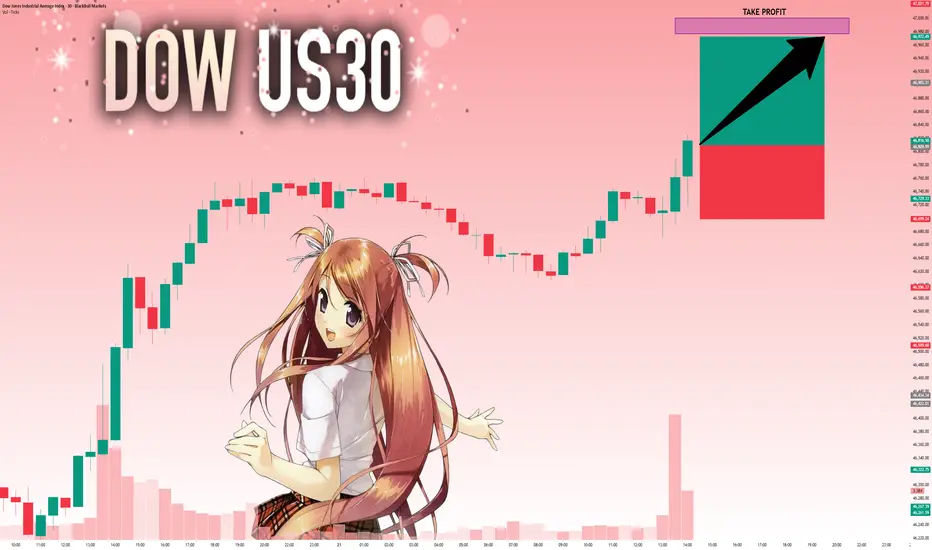
US30: Bulls Are Winning! Long!
My dear friends,
Today we will analyse US30 together☺️
The recent price action suggests a shift in mid-term momentum. A break above the current local range around 46,809.99 will confirm the new direction upwards with the target being the next key level of 46,976.92 and a reconvened placement of a stop-loss beyond the range.
❤️Sending you lots of Love and Hugs❤️
SOLCRYPTOCAP:SOL price action is tightening up with a solid base forming at support, looking strong each time it’s tested. This compression phase usually precedes a breakout. $420 remains the clear target and looks highly achievable within the next 200 days.

EURUSD: Local Bearish Bias! Short!
My dear friends,
Today we will analyse EURUSD together☺️
The in-trend continuation seems likely as the current long-term trend appears to be strong, and price is holding below a key level of 1.16075 So a bearish continuation seems plausible, targeting the next low. We should enter on confirmation, and place a stop-loss beyond the recent swing level.
❤️Sending you lots of Love and Hugs❤️

GOLD: Absolute Price Collapse Ahead! Short!
My dear friends,
Today we will analyse GOLD together☺️
The market is at an inflection zone and price has now reached an area around 4,177.29 where previous reversals or breakouts have occurred.And a price reaction that we are seeing on multiple timeframes here could signal the next move down so we can enter on confirmation, and target the next key level of 4,122.01.Stop-loss is recommended beyond the inflection zone.
❤️Sending you lots of Love and Hugs❤️

Dollar Index (DXY): New Bullish Wave Confirmed?!
Here a quick follow-up for my recent idea for Dollar Index.
The price retested a recently broken major horizontal structure cluster
and even went below that with a bearish trap.
A rising trend line was respected as a strong vertical support
and we see a bullish continuation now.
I think that we can expect a rise at least to 99.3 level now.
❤️Please, support my work with like, thank you!❤️

Part 2 – After the Crash Comes the Silence📉 Part 2 – After the Crash Comes the Silence
How to rebuild yourself when the market breaks you
Losses hurt.
But the real damage isn’t the money –
it’s what they trigger inside you.
When you stare at the screen after a big loss,
question everything, hold the mouse –
and still click even though you know you shouldn’t…
That’s when you finally meet your real opponent: yourself.
🧩 After the Crash Comes the Silence
After major losses, you don’t get angry –
you go quiet.
You start analyzing, justifying, searching for someone to blame.
That’s when you often hear:
“The markets are manipulated.”
And yes – there’s truth in that.
Professionals make money because they understand how manipulation looks and where it begins.
They study liquidity pockets, order flow, and timing –
they don’t react, they anticipate.
Techniques like spoofing – placing fake orders to trick others – are technically illegal,
but nearly impossible to prove in real time.
It’s a grey zone where regulation lags behind speed.
But that’s exactly the point:
you don’t need to prove manipulation –
you need to see it coming.
To build your positioning so you’re not the liquidity that’s being hunted.
The market isn’t a monster.
It’s an ecosystem full of intent, strategy, and psychology.
And in this ecosystem, survival belongs to those who can see before they react.
💭 The Tuition of Trading
Losses are part of the game.
The faster you accept them, the faster you learn to control, process, and transform them.
They’re not failures – they’re tuition fees, the unavoidable price of experience.
Without them, there’s no growth, no structure, and no discipline.
Every professional trader you admire has paid heavily in that same currency.
🔁 Reset – Rebuild – Refine
1️⃣ Reset – Detox your thinking
Turn everything off.
No charts, no groups, no noise.
Just you, a blank page, and silence.
Write down what really happened – and what you felt while it did.
Recognizing emotions isn’t “soft.” It’s elite risk management.
2️⃣ Rebuild – Remove the lies
Most strategies don’t fail because they’re bad –
they fail because they’re built on self-deception.
“I’ll stick to my stop this time.”
“I just need to win back what I lost.”
No. You want validation, not profit.
Only when you stop lying to yourself can you build a system that protects you – not destroys you.
3️⃣ Refine – Become the architect of your risk
Find out who you are as a trader.
Aggressive or conservative?
Impulsive or patient?
Until you know, you’ll always trade against your own nature – and lose every time.
⚙️ The Turning Point
There comes a moment:
You see the perfect setup –
and you don’t take it.
That’s not weakness. That’s enlightenment.
Because you’ve finally learned that doing nothing is sometimes the most profitable move.
From that moment, you start reading markets not to be right –
but to understand.
You realize:
👉 The market isn’t against you.
It’s testing whether you’re truly ready.
💡 The Deepest Realization
The market doesn’t punish you.
It mirrors what you haven’t mastered yet.
Every repeated mistake isn’t bad luck –
it’s proof that mentally, you’re still the same person from your last drawdown.
And that’s the real game:
Not mastering the market – but mastering yourself.
💬 Reflection Questions
When was the last time you didn’t take a trade – and felt proud of it?
Which of your “rules” are actually emotional shields?
How many of your losses come from setups – and how many from emotions?
What would your system look like if you built it around you, not the market?
🔑 Final Thought
Trading isn’t a fight against numbers.
It’s a daily confrontation with your ego, greed, and impatience.
Success begins the moment you realize:
The market was never the problem – you were.
And that’s your opportunity.
Because once you truly understand yourself,
no chart in the world can scare you again.

$FLOKI (DAILY): SHORT position triggered ($0.0000775) post TWEETSEED_DONKEYDAN_MARKET_CAP:FLOKI has triggered my SHORT position, and this is my first short since the collapse on 10/10.
Not looking good, yesterday's DAILY candle had a huge rejection wick after Musk's joke, a lot of people got trapped by this silliness, just looking at the tallest volume candle in 2025, crazy.
And the LIQUIDATIONS HEATMAP, attached, showing clearly how leverage traders joined the action very late and got all luquidated within a couple of hours.
I warned about this twice, and currently in this SHORT. Stop loss set on my chart, two TAKE PROFIT levels: at the falling SUPPORT and around the previous swing low, let some run and see.
The WEEKLY chart versus CRYPTOCAP:BTC is super interesting, FLOKI at long-term support and possibly looking to start an UPTREND or at least a relief-rally.
It's a long-term chart vs BTC though (on X, cannot add more images here) , promising, but not short-term.
Short-term, the continuation of medium-term decline is the most likely.
💙👽
