Fartcoin Faces Breakdown Risk Below $0.93After two failed attempts to reclaim $0.93, Fartcoin has slipped back to key Fibonacci support. The market is at a decisive point where either a bounce occurs or further downside accelerates.
Key Technical Points
- Double Rejection: $0.93 resistance rejected twice.
- 0.618 Fibonacci: Current support under test.
- Breakdown Target: Loss of support opens path to $0.51.
Analysis
Price action highlights clear weakness, with $0.93 acting as a ceiling. Holding the Fibonacci level is critical; a bounce here could rotate price back to retest $0.93. However, if broken, the next logical support lies at $0.51, representing a significant technical breakdown.
Market structure suggests sellers remain in control until price reclaims resistance. Bulls must defend current levels to avoid continuation lower.
What to Expect
Fartcoin sits at a make-or-break level. A rebound keeps $0.93 in play, but a breakdown exposes $0.51 as the next downside target.
Contains IO script

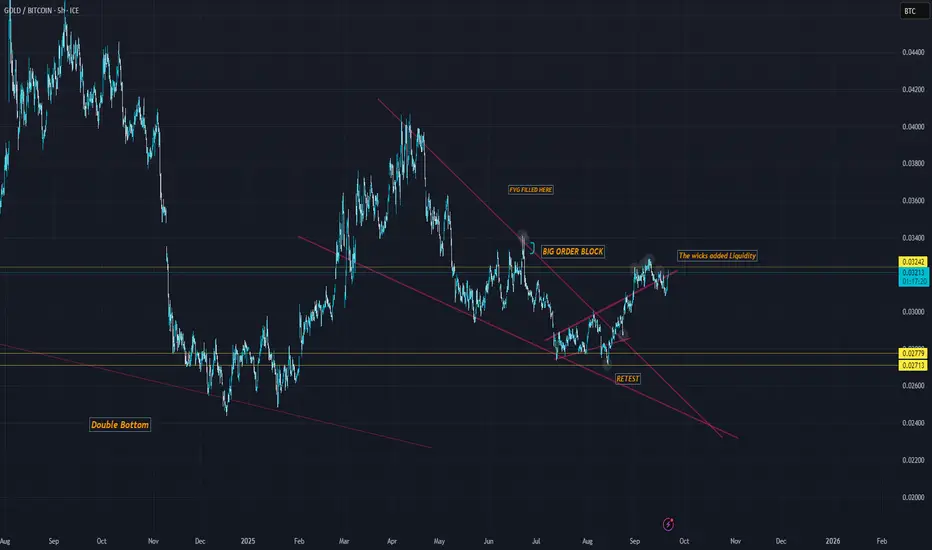
Heading North if you study XAU-BTC (TV) we have also a possible Wickoff reversal with that clean retest of the last double bottom.
When I check the cluster of liquidity on BTC we have fuel to start the Mark down.
Remember that the recent drop at 107k 98k and 74k could have strategically made to have a cost efficiency in the next market correction with those daily liquidation pool from the Long. (sell order)
Supports are 100k; 89k and 79k on BTC.
For Gold. I see liquidaiton daily level up to 4500$, I believe we can go higher.
Remember if BTC down abrutly, the chart XAU-BTC will go up if Gold keep Steady or hold better...
Big Market Correction incoming ?if you study the USDT.D we have a possible retest off the double bottom at 3.98 (possible Wickoff reversal) + we have big huge fair value gap around 7%.
I know it sounds a bit impossible to reach at the moment, be careful still.
if you study XAU-BTC (TV) we have also a possible Wickoff reversal with that clean retest of the last double bottom.
When I check the cluster of liquidity on BTC we have fuel to start the Mark down.
Remember that the recent drop at 107k 98k and 74k could have strategically made to have a cost efficiency in the next market correction with those daily liquidation pool from the Long. (sell order)
Supports are 100k; 89k and 79k on BTC

incoming Mark Down ? if you study the USDT.D we have a possible retest off the double bottom at 3.98 (possible Wickoff reversal) + we have big huge fair value gap around 7%
if you study XAU-BTC (TV) we have also a possible Wickoff reversal with that clean retest of the last double bottom.
When I check the cluster of liquidity on BTC we have fuel to start the Mark down.
Remember that the recent drop at 107k 98k and 74k could have strategically made to have a cost efficiency in the next market correction with those daily liquidation pool from the Long. (sell order)
Supports are 100k; 89k and 79k

Super Bear on NQ for week 22/10 - 03/11 2025This week will show if the bears are gonna step in! A lot of positivity in the markets due to rate cuts but I'm not buying it. Sell the news will be on. Predicting NQ back to 24000 till end of the month. Bearish setup only for the rest of the month.
Always remember, Caution, Patience and Risk!
GL!
If you like the content give me a follow on X!
Check Bio. Cheers!

GBPJPY Bearish for the week commencing 22nd SeptExpecting a bullish move back into some of the internal liquidity left over from the move on friday, with a strong bearish move to counter aiming for TP's at the lower levels of low resistance liquidity.
Could decide to react off the 1H FVG left over but expecting a move to above EQ before another leg down. Will be looking to take a short at the marked areas either of 4H FVG or 1H OB above it.

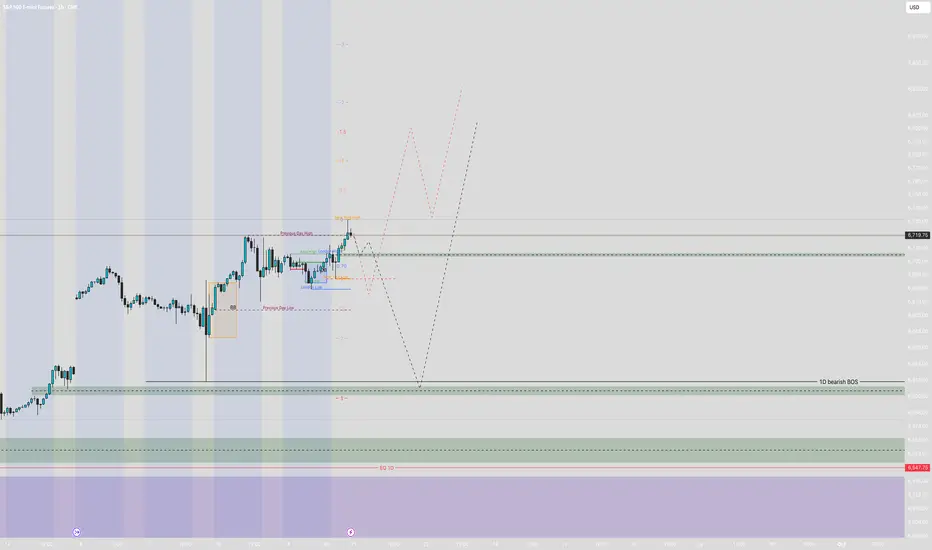
ES! bearish start to the week bullish overall. We took ATH on ES & NQ last week again. Expecting a continuation on the bullish action but I think we will have a retrace into an area of liquidity first, We have this area marked below with the 4H FVG, we could wick into this while still maintaining bullish orderflow.
Could have a smaller retrace into EQ from thursdays price action before we get another leg up but will need to see what happens with price action at these points.
APECOIN (APE) – Technical Outlook & Key Market InsightsDescription :
ApeCoin (APE) is the governance token of the Ape ecosystem, designed to support community-led initiatives within the Bored Ape Yacht Club (BAYC) and related projects. Its utility extends to governance, payments, and ecosystem participation, making it one of the most discussed tokens in the NFT and Web3 sector.
In this analysis, we review the current technical structure of APE with a focus on price action, market sentiment, and possible support/resistance levels. While ApeCoin remains highly volatile, its connection to the NFT space and strong community backing are key fundamentals to watch.
⚠️ Disclaimer: This content is for educational and informational purposes only. It does not constitute financial advice. Always conduct your own research before making trading or investment decisions.
#APE #ApeCoin #Crypto #Altcoins #Web3 #NFT #Trading #TechnicalAnalysis #CryptoCommunity #Blockchain

MNQ ATH overall bullish Overall I am bullish while at ATH but we did take ATH n friday which would indicate a retrace is inevitable before another leg up. Where that retrace comes back to is the big question.
We have a 1H FVG at EQ of the Fridays leg up which could be a decent rejection point, if we wanted to retrace deeper we could be looking at a retrace to the 4H EQ as marked by the red line and lower large FVG.
Either way I am expecting price to go higher but will be watching both these points this week to see the PA reaction.
Potential TP's for the long based on Fib extensions.

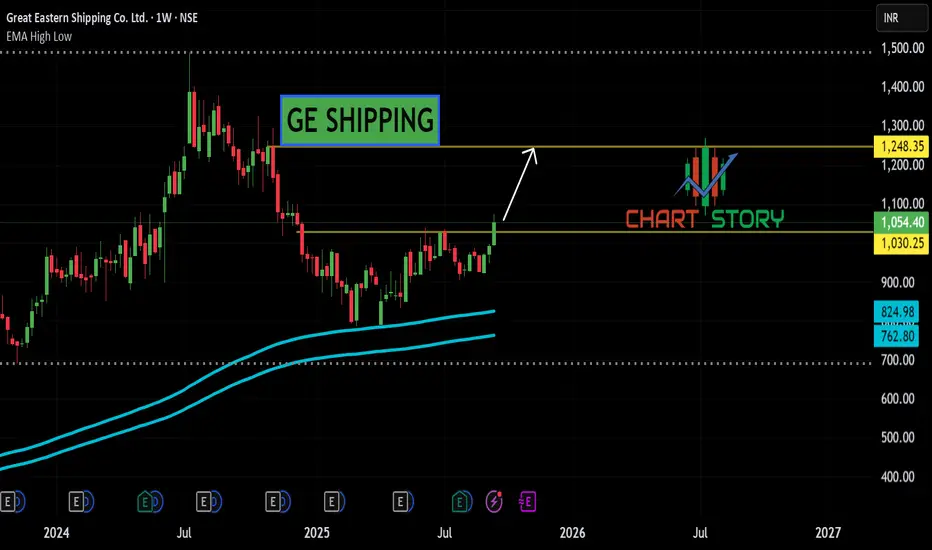
GE SHIPPINGNSE:GESHIP Weekly breakout stock with momentum and buyers active from support zone and location .

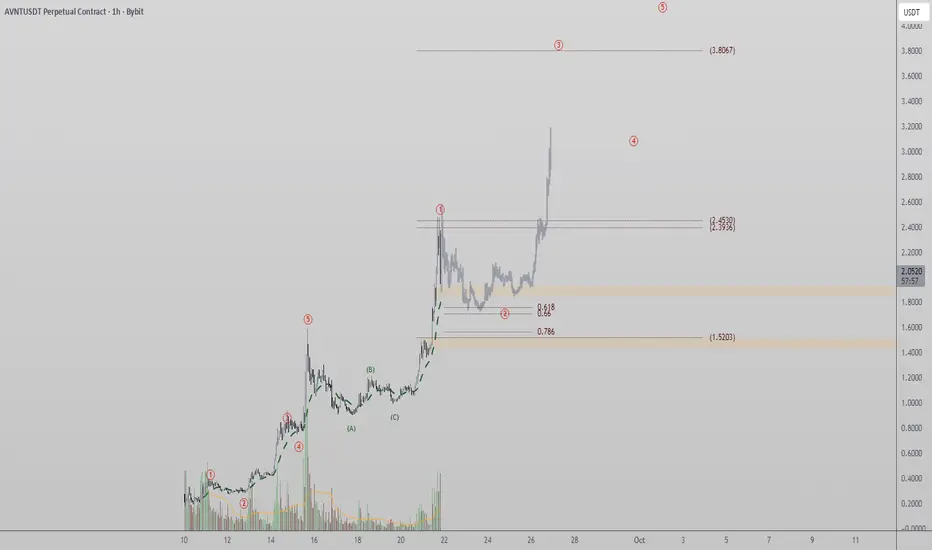
Avantis (AVNT) Sets Wave 3 Target at $3.80Advantis has been following a clear Elliott Wave cycle. After completing a five-wave sequence and an ABC correction, another impulsive move pushed price into the 0.618 Fibonacci extension zone. This level marked the blow-off top of the move, indicating a corrective pullback was due.
Key Technical Points
- Elliott Wave Cycle: Multiple sequences confirmed with impulsive rallies and ABC corrections.
- 0.618 Extension: Marked blow-off top in the last leg.
- Wave 3 Target: $3.80 projected after Wave 2 correction.
Price has now entered what appears to be a Wave 2 corrective move within a larger bullish cycle. A retracement to the 0.618 Fibonacci level could establish the foundation for another rally. If this higher low forms successfully, the next wave up is projected to be a strong Wave 3, with a target of around $3.80.
The importance of the 0.618 retracement cannot be overstated, as it provides the technical alignment for liquidity collection and structure building. Once buyers reclaim momentum, the bullish projection remains dominant.
What to Expect
Advantis is likely preparing for a major continuation wave. If support holds and a bottoming structure forms, Wave 3 expansion toward $3.80 is the logical next target.
STBL Prepares for Reversal After Blow-Off TopAfter a parabolic rally, STBL has entered a corrective phase. Price has rotated down toward the value area low, which aligns with both the 0.618 Fibonacci retracement and a significant swing low. An impulsive bounce has occurred, but the market may revisit this zone to clean liquidity before continuing higher.
Key Technical Points
- Blow-Off Top: Followed by corrective structure.
- Value Area Low: Aligns with 0.618 Fibonacci and swing low.
- Liquidity Resting: Potential for another retest before reversal.
STBL tested its confluence support but did not take out the key swing low. This suggests that liquidity remains uncollected at this level. Markets often return to sweep such zones before confirming a stronger move higher.
An impulsive bounce has already occurred, showing demand exists. However, if price revisits the low, it may provide a more stable foundation for a reversal. Continuation higher from current levels is possible but less likely until liquidity cleanup occurs.
What to Expect
STBL’s most probable path is a retest of the support zone followed by a reversal back toward the highs. The bullish case remains valid while structure holds above the value area low.

Aster Corrects Toward Support, Eyes Continuation HigherAster has maintained a strong uptrend, supported by a series of higher highs and higher lows. Recent price action shows a corrective pullback, which is natural after a strong expansion move. The key question now is where the market establishes its next higher low to confirm continuation of the trend.
Key Technical Points
-Bullish Market Structure: Consecutive higher highs and higher lows remain intact.
- Support Confluence: Value area low, 0.618 Fibonacci, and VWAP create a strong demand zone.
- Reversal Zone: Swing lows provide liquidity for potential higher-low formation.
Price action has yet to fully test the value area low, which sits above strong technical confluence. Below it lies the 0.618 Fibonacci retracement and VWAP support, forming a critical demand zone. Historically, these levels attract liquidity hunts, where swing lows are taken before price reverses upward.
If price establishes a higher low here, it would reaffirm the bullish projection and set the stage for another push higher. The broader structure shows no sign of breakdown, meaning the correction is healthy rather than bearish.
What to Expect
Aster remains technically bullish. If the $0.618 confluence zone holds, a reversal could materialize, driving continuation toward new highs.

GRX Swing Setup Watch $0.595 and $0.875GRX is showing promising signs here, but as a small-cap stock, it demands disciplined risk management and a cautious approach. Price action is currently pulling back into a strong macro zone, aligning with the major 50% retracement level and previous structural highs—an area worth watching closely.
Trade Scenarios
Scenario 1 Optimal Entry:
Ideally, price pulls back to the demand structure around $0.595.
Look for a bullish candle confirmation at this level.
This setup offers the most favorable risk-to-reward ratio.
Scenario 2 – Trend Continuation:
If price holds the swing low at $0.68 and breaks above the local swing high at $0.875, it confirms an uptrend.
Same TP targets apply.
Targets:
Initial target: ATH resistance near $1.305
Potential for further upside by trailing stop-loss along swing highs.
If price starts to break and close below $0.56 expect lower prices and the potential of this being a fakeout
Reminder: This is a speculative setup on a small-cap stock. Always size positions appropriately and manage risk with precision.
Please note, arrows are not based on time analysis just overall market structure.

BWP Setup: Support Holding, Momentum BuildingKeeping it simple here. Price has established a strong base between $3.20 and $3.70, showing clear signs of accumulation. All major trend indicators have just turned up, suggesting momentum is building.
Trade Plan
Entry: Current levels offer a solid technical foundation
Target: Initial TP around $4.20
Risk Management: Respect the All-Time High (ATH) resistance zone
Trailing Strategy: Trail stop losses below each new swing low to stay aligned with the trend

Simple Trade Plan on Small Cap StrengthConfirmed, BU/LPS in Play
Another promising small cap chart showing strong technical alignment. After a healthy pullback, price has now printed a significant Higher Low (HL) right at the confluence of two major 50% retracement levels (macro and local). This zone has historically acted as a magnet for liquidity and trend continuation.
Adding to the bullish case:
We've seen a Jump Across the Creek (JAC), signaling strength
Followed by a clean Back Up / Last Point of Supply (BU/LPS), confirming the retest and potential for markup
Trade Strategy
Simple Execution Plan:
Entry: Current levels offer a solid entry opportunity
Stop Loss: Just below the BU/LPS zone. If price breaks below, reassess as this could signal a failed breakout or fakeout
Take Profit: Initial TP just below the R2 yearly pivot
Trend Management: Potential Trail stop loss beneath each new swing low to stay aligned with trend structure and maximize upside

High-Risk, High-Reward Play with Dual Entry StrategyAs always with nanocap stocks, extreme caution and disciplined risk management are essential. That said, the chart structure for AQD is showing promising signs of continuation, and there are a couple of strategic ways to approach this setup:
Conservative Entry Strategy
Trigger: Entry only if price breaks above the recent high at $0.068
Stop Loss: To be placed at the newly formed structural low once confirmed
Take Profit: Initial target would be the range high; depending on market structure, a more ambitious target could be the supply structure equilibrium zone near $0.315
Staggered Entry Strategy
Price has pulled back into a key area of interest, aligning with:
Range tops
A major 50% Fibonacci retracement from the swing high of $0.65 to the low of $0.005
Low Volume Node region
If the pullback continues:
Watch for price to find support within the Fair Value Gap (FVG), especially around the equilibrium zone
A well-formed doji or bullish hammer candle in this region would offer a fantastic opportunity to scale into the position.
If price doesn't pullback into the FVG then you are already positioned and can add to the winning position when $0.068 top is broken and trail stop loss at the new SL
Until a clear structural low is formed, the provisional stop loss must be placed at $0.007 therefore highlighting the importance of proper risk management.

Fartcoin Holds $0.76 Support as Range FormsFartcoin has been oscillating between critical supports, building a base at $0.76. The longer price holds above this level, the more likely it is to initiate a bullish reversal within the range.
Key Technical Points
- $0.76 Support: High-time-frame zone holding as base.
- Range Formation: Between weekly and daily supports.
- Upside Target: Breakout could drive rotation to $1.22.
The support at $0.76 continues to attract buyers, creating a structural floor for accumulation. While oscillations within the range may persist for some time, the formation of a base is constructive for a bullish reversal.
If buyers maintain control of this level, Fartcoin could rotate higher toward $1.22, where the next major resistance lies. A loss of this support, however, would undermine the bullish scenario and open the door to deeper downside.
What to Expect
Fartcoinis likely to continue ranging before a reversal emerges. Holding $0.76 remains critical for the bullish case, with $1.22 the next target once demand confirms.

Pump Token Correction Likely Wave 2 Before ExpansionPump Token has corrected from its highs, finding support at the daily level. This zone aligns with the golden ratio retracement, suggesting a natural corrective phase within a larger bullish trend.
Key Technical Points
- Daily Support Zone: Aligned with 0.618 Fibonacci retracement.
- Wave Structure: Possible Wave 2 correction before larger Wave 3.
- Higher Low Formation: Current pullback could establish new base.
Analysis
The impulsive rally preceding this correction suggests that Pump Token may be tracing out an Elliott Wave sequence. The current correction is consistent with a Wave 2 retracement, with buyers likely to establish a higher low at support.
This corrective phase is natural and necessary to build a base for the next expansion. Once confirmed, a Wave 3 rally could materialize, often the strongest in Elliott Wave theory. However, more price action is required to solidify a decisive trading plan.
What to Expect
If support holds, Pump Token could soon enter an impulsive Wave 3 rally. Confirmation will require bullish candles and sustained volume inflows.

Using money flow with Price action readerUsing money flow with Price action reader to get the best daytrades
