The Impact of News on Price: Should You React?"
In trading, news has always been a powerful factor capable of moving markets by double digits within hours. A single headline in the financial media or a tweet from a politician can send an asset soaring or crashing, wiping out stop-losses and creating waves of panic. Many traders have faced moments when a sudden “breaking story” ruined carefully built plans: technical analysis showed a steady trend, but a flood of headlines turned the market in the opposite direction. Naturally, the question arises: should we react to news immediately, or is it better to stay calm?
Most traders make their biggest mistakes during such moments. The temptation appears to jump straight into a position or close one in fear. Emotions take over: fear of missing out and greed for quick profits. The problem is, these decisions rarely come from a system. More often, they turn trading into gambling, where outcomes depend on luck instead of analysis.
The truth is, news itself doesn’t always have a straightforward impact on the market. What matters more is how participants react. The same piece of information can trigger a rally or a sell-off depending on how major players interpret it. Blindly following the headlines rarely leads to consistent results.
A more effective approach is to treat news as background, not as a direct call to action. At the core of successful trading lies discipline and an understanding of levels, not headlines. If the price is approaching a pre-marked zone, that zone—not a comment on a news feed—defines the scenario. This way, the trader avoids guessing crowd reactions and focuses on what is objectively visible on the chart.
Consider two scenarios. In the first, a trader sees news that a large fund has purchased crypto and instantly opens a long. In the second, the same trader reads the same news but acts only after confirming the move technically, at pre-defined levels. The difference is striking: the first approach is emotional, the second is structured. And it’s the latter that reduces chaotic mistakes.
To trade this way, it’s not enough to simply recognize levels—you need a system to control them. That’s where structured analysis comes in: viewing price step by step, turning trading into a managed process. With this approach, profit targets, risk zones, and scenarios are mapped out in advance. Strong news flow becomes a side factor, not the core driver of decisions.
Experienced traders know that news will always shake markets. Instead of chasing every headline, it’s more effective to build trades that can withstand volatility. What helps here is having a process that removes emotions and focuses on numbers. Automation of analysis and clear visualization of key levels transform trading from chaotic reactions into a disciplined plan.
So, should you react to news? The answer is: yes, but not directly. React through your system. If the news aligns with the technical picture, it can add conviction. If it contradicts it, the priority remains with structure, not emotion. This is what allows you to operate calmly, without panic or euphoria.
Markets will never stop being unpredictable, and news is just one facet of that uncertainty. But discipline, technical analysis, and structured control can turn even the noisiest events into a manageable process. In the end, it’s not the headlines that matter most, but your ability to stay focused and consistent. And this is exactly where tools that automate the process, reduce chaos, and keep logic at the center become indispensable."
Contains IO script

XAUUSDPrice action trading is a methodology where traders make decisions based on the interpretation of actual price movements on a chart, rather than relying primarily on lagging indicators. It involves observing and analyzing candlestick patterns, trend lines, support and resistance levels, and volume to identify potential trading opportunities and manage risk. The focus is on understanding the story the market is telling through its price behavior.

Long ETHUSDTHello traders!
After a succesful break above resistance, I'm looking for this scalp long.
Don’t forget to like and share your thoughts in the comments! ❤️

IREDAThese charts are shared strictly for educational purposes only.
They should not be considered as trading signals or financial advice.
If you choose to trade, please consult with your financial advisor before making any decisions.
I am not responsible for any profit or loss you may incur.

MY TRADE ENTRY CRITERIA EXPLAINED!!! BUY NZDUSDAll the information you need to find a high probability trade are in front of you on the charts so build your trading decisions on 'the facts' of the chart NOT what you think or what you want to happen or even what you heard will happen. If you have enough facts telling you to trade in a certain direction and therefore enough confluence to take a trade, then this is how you will gain consistency in you trading and build confidence. Check out my trade idea!!
www.tradingview.com

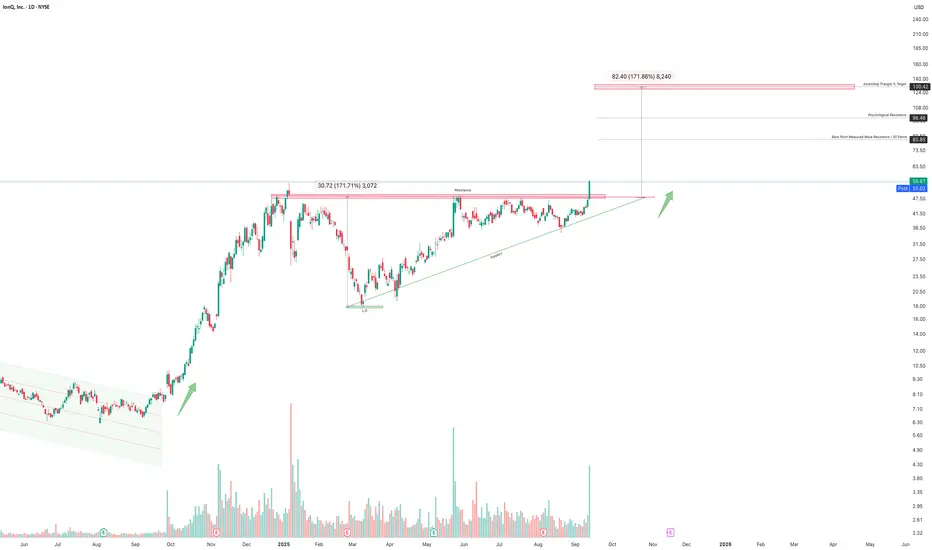
IONQ 's Ascending Triangle Breakout!IONQ has completed a prolonged consolidation phase, forming a textbook ascending triangle with a flat resistance ceiling at $48 and steadily rising higher lows. This structure represents clear accumulation pressure, with buyers consistently stepping in at higher price points.
Breakout Confirmation:
The stock has now broken above the $48 resistance with a surge in volume, validating the bullish breakout. This is a strong technical signal that the next leg higher has begun, rather than a false move.
Target Zones:
Measured move target (triangle projection): $80–82
Intermediate resistance: $98–109 (psychological and technical zones)
Extended target: $130–135 (171% projection, aligning with long-term triangle objective)
Risk Management:
The $48 breakout zone now acts as a critical support level. A sustained close below would negate the bullish breakout and suggest a failed pattern. As long as price remains above $48, momentum favors higher levels.
Volume & Momentum:
The recent volume spike at breakout confirms institutional participation. This is crucial, as breakouts from long consolidations often trigger strong trending moves when backed by volume.
Macro/Sector Context:
IONQ remains a flagship in quantum computing. The sector continues to benefit from rising AI + high-performance computing investments, making IONQ a key proxy for investor sentiment in the space. A breakout here could attract even more capital inflows into quantum plays.
✅ Conclusion:
IONQ’s breakout above $48 confirms the end of its consolidation and the start of a new bullish cycle. With well-defined support and multiple upside targets ( $80 → $100+ → $130), the risk/reward profile remains highly favorable. As long as the breakout level holds, the chart supports a multi-leg rally with significant upside potential.
NIFTY IT - BOTTOM FISHING SECTORNSE:CNXIT Weekly location with bottom fishing strategy and active buyers.

GRANULES- BOTTOM FISHING BUYNSE:GRANULES Weekly bottom fishing location with accumulation with double bottom.


TeslaLevels Ive had for Tesla to hit for the last few months. Seems like we are getting there. Most likely will get there by Feb-March 2026 at the latest before a HUGE DROP.

Long GBPCADRecommend going long GBPCAD:
Yesterday’s US CPI report showed slightly hotter than expected headline inflation (0.4% MoM), while the more closely monitored core rate rose by 0.3% MoM in line with consensus. But for now, markets are receiving validation of Fed dovish bets.
Also, the pound has held up well recently given hawkish BOE stance.
The trade setup is slightly high risk, as the trend looks a little exhausted. So, I recommend risking half of typical amount for this trade.
Don’t forget to like and share your thoughts in the comments! ❤️

Long EURUSDRecommend going long EURUSD:
Yesterday’s US CPI report showed slightly hotter than expected headline inflation (0.4% MoM), while the more closely monitored core rate rose by 0.3% MoM in line with consensus. But for now, markets are receiving validation of Fed dovish bets.
Also, the Euro has held up well recently given hawkish ECB stance.
The trade setup is slightly high risk, as the trend looks a little exhausted. So, I recommend risking half of typical amount for this trade.
Don’t forget to like and share your thoughts in the comments! ❤️

BITCOIN - Blow off top ? Well history doesn't repeat itself but it definitely rhymes.
My target for this cycle is still in the higher part of this longterm ascending channel between 160K - 220K.
Share your opinions
Do you think top is in ?
Or end of the year will be final expansion?
Can FED rates cut fuel this rally?
David Perk

PLTR to 234Big weekly bullish engulfing candle to end the week after a perfect 0.618 rejection 2 week prior. Upside target is just short of 234, stop is 2 fib levels below. If this one doesn't work out, I will be looking for another entry lower.

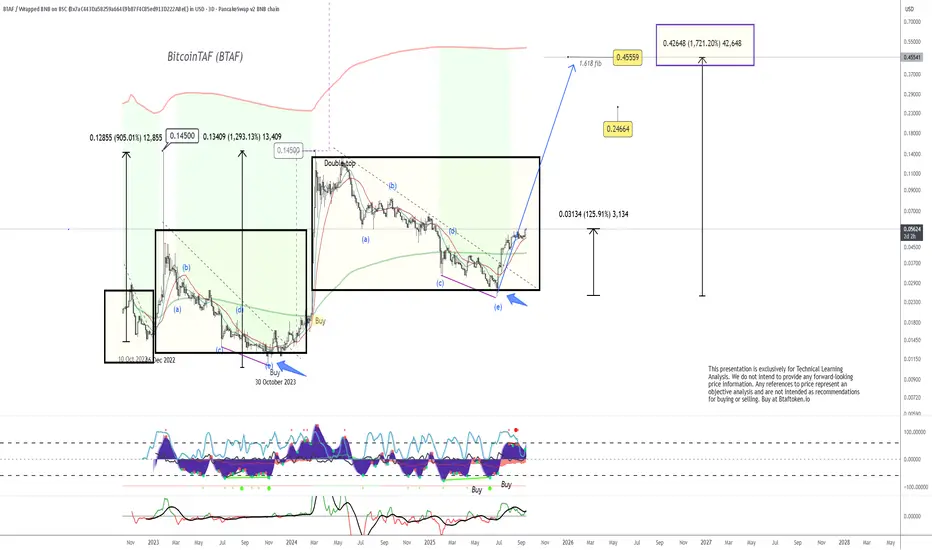
BTAF (BitcoinTAF Token) – Technical AnalysisBTAF (BitcoinTAF Token) – Technical Analysis
The chart highlights BTAF’s long-term cyclical structure, showing clear Elliott Wave patterns and Fibonacci extensions that point to significant potential upside.
Key Observations:
Historical Cycles:
BTAF previously delivered explosive rallies of +905% and +1,293% after consolidation phases.
Each cycle was marked by a corrective wave (ABCDE structure) before the next breakout move.
Current Structure:
The latest corrective phase (labeled wave (e)) appears to have completed.
Indicators are showing multiple Buy signals aligning with historical cycle lows.
The current price is building higher lows, with momentum turning upward.
Fibonacci Targets:
Immediate Fib target: $0.2466
Extension target: $0.4559 (1.618 Fib)
Long-term measured move: $0.4264 (+1,721%) relative to current support.
Momentum Indicators:
Oscillators confirm strength building from the base.
Buy signals have printed, similar to those seen in previous breakout phases.
Outlook:
If BTAF follows its established cycle patterns, the next bullish wave could target the $0.24 – $0.45 range, with potential for even higher levels over time. As always, pullbacks should be expected, but the technical structure remains constructive for long-term growth.
⚠️ Disclaimer: This analysis is for educational and technical learning purposes only. It is not financial advice or a recommendation to buy or sell. Always do your own research and manage risk responsibly.
Enjoy your trade!
BTAF
SQD long ideaSQD is printing a bull flag, the tiniest in the history, let alt season make it worth longing RR 33 from here

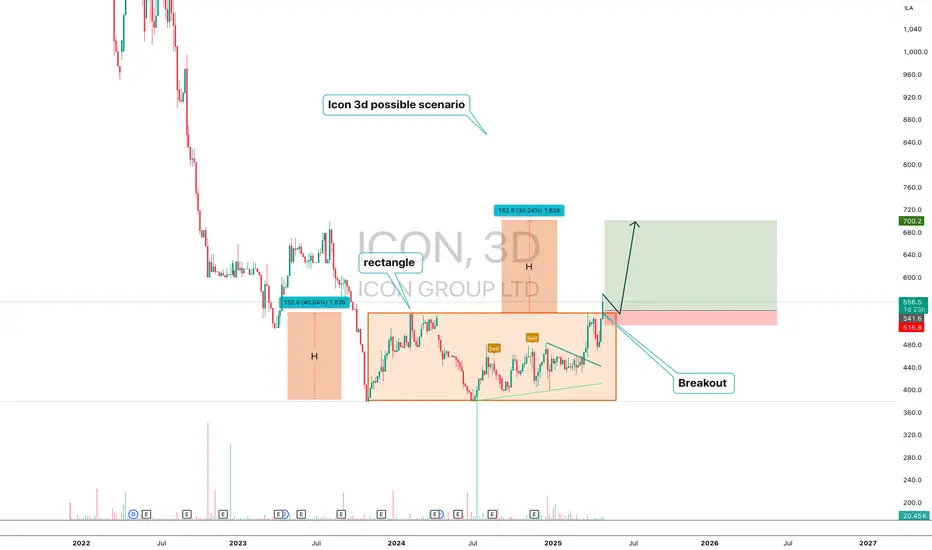
ICON — Breakout from Rectangle with H Projection Targeting $700ICON (3D) — Technical Structure Analysis
ICON has broken out from a prolonged horizontal rectangle pattern ($380–$540). The move activated a measured move structure with two H-sized waves. The first H was completed. The second H projects a move to the $700 area.
Key points:
-Confirmed breakout from range
-First H = 153 pts, completed
-Second H = 162 pts, targeting $700
-Price holding above breakout zone ($515–$541)
ICON has moved out of accumulation and entered trend expansion. As long as the support holds, the scenario remains valid. The technical model targets the $700 area.
LTCUSD 2D chartSleeping LTC working on the breakout. As btc.d is marking a higher low, we have no doubt ltc will make it back into the top 10 of the crypto market by market cap. solid fundamentals support this idea.

Aud bullish head and shouldersAudi’s bullish head and shoulders
Plus oscillators
The AUD/USD pair posts a fresh 10-month high near 0.6670 during the European trading session on Friday. The Aussie pair strengthens as the Australian Dollar outperforms its peers amid cheerful market sentiment. S&P 500 futures are marginally down during the European trading session, but gained 0.85% on Thursday.
