MMP INDUSTRIES - BUYNSE:MMP Weekly rounding bottom and accumulation exactly at location of 4 years. May continue further rally to near term.
Contains IO script

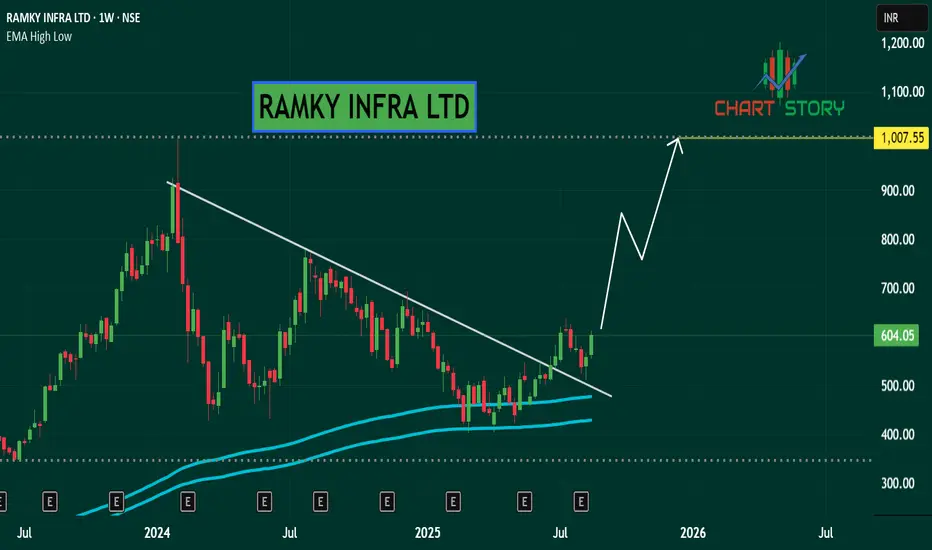
RAMKY INFRA - LONGNSE:RAMKY Weekly location with momentum may continue stock to climb till previous swing high.
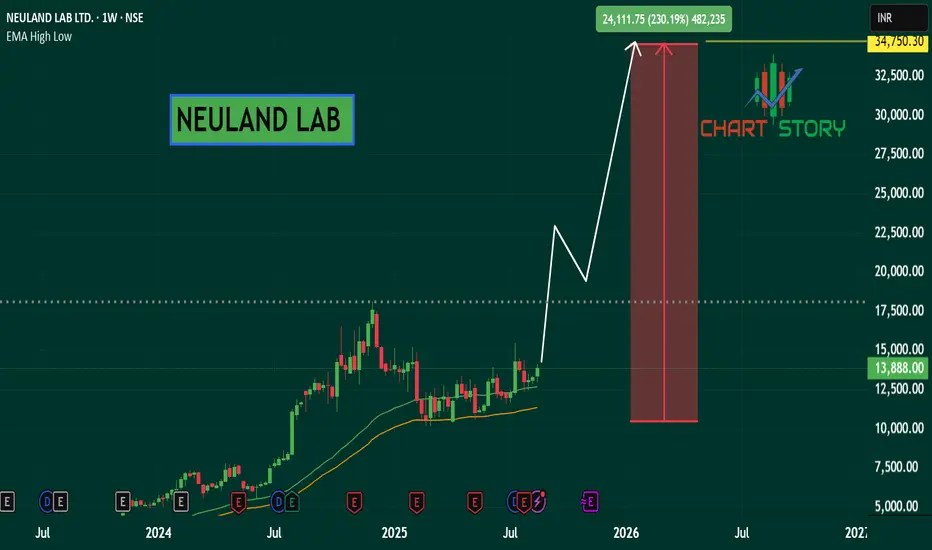
NEULAND LAB - BUYNSE:NEULANDLAB Weekly parabolic formation may continue trend like fast and furious momentum in short to medium term.
CIPLA - LONGNSE:CIPLA Weekly parabolic formation may double stock price from current levels. As stock already in momentum from last 1 year.

Shiba Inu (SHIB) Coils in Bullish Pennant, Breakout ApproachesShiba Inu (SHIB) is consolidating in a bullish accumulation zone around the Point of Control (POC). Price action has formed a pennant with a clear apex, signaling that a breakout is imminent. A surge in bullish volume will be required to confirm an upside move toward the range high.
Shiba Inu is currently in a consolidation phase, with price holding around the Point of Control of its established trading range. A tightening pennant structure has formed, with the apex quickly approaching. This setup suggests that volatility is building, and traders are now watching closely for the decisive breakout that will set the next directional move.
Key Technical Points
- Accumulation Phase: SHIB is consolidating around the Point of Control of its range
- Pennant Structure: Price is coiling toward a well-defined apex in the short term
- Volume Decline: Current falling volume profile indicates pressure is building
SHIB’s price structure reflects bullish accumulation, as it consolidates tightly around the Point of Control. The pennant formation, characterized by converging highs and lows, highlights a period of compression that typically precedes a sharp move. With the apex nearly formed, the timing of a breakout is drawing near.
Currently, the volume profile is in a clear decline, which is characteristic of pennant formations. This decline in activity sets the stage for a high-impact breakout, as any sudden surge in volume will stand out and validate the move. If SHIB breaks to the upside, backed by strong buying participation, price could accelerate quickly toward the range high, confirming continuation of the bullish structure.
What to Expect in the Coming Price Action
As Shiba Inu approaches the pennant apex, traders should prepare for an imminent breakout. A confirmed move backed by strong bullish volume would validate an upside push toward the range high, with potential to extend further if momentum continues. Failure to generate volume, however, could result in prolonged consolidation at current levels.

Link long ideaInsane strength from CRYPTOCAP:LINK , pumps with the slightest uptick from BTC. Would slam a swing long in green box if we get it. I think we'd need 110-111k BTC and sub 4K ETH for that to play out. Otherwise will chase at a 4H close above current resistance

BTC last few movesJust for my haters
what and when BTC will do
From end of Aug or beg of Sept we gonna pump till 24 +-few days of September
From 1st week of november - DIP till end of November/beg of December! (altcoins even longer will go down till 10-12 of Dec)
From there one last pump till end of Jan 2026


BTC Last Dip Before Cycle HighFrom my lens, it not only coincides with the seasonal dip — but rather, the final "dip" (if we can call it that) **before** the cycle top. I’ve mapped the last two cycles on the weekly chart and noticed a pattern:
2016 Halving:
483rd day = local low
Closed ~20% down from previous week closing.
Cycle high followed ~41 days later
2020 Halving:
497th day = local low
Closed ~9% down from previous week closing.
Cycle high followed ~49 days later
2024 Halving:
We’re currently at Day 486, placing us right in the same post-halving window. If this pattern holds, we could be anywhere from a few days to a week out from a local bottom — and ~6–7 weeks away from the top.
Presently down ~~4%% down from previous week closing.

EurJpy: Long signal on bullish structureGood morning everyone,
this morning I receive an alert from LuBot on the 4H timeframe of a buy signal on which I enter the market.
Confirmation comes from the weekly and daily timeframes which follow a bullish structure.
On the daily we see a return of the bullish structure after the last correction which never brought prices below the ema50, and at the moment with today's candle we are just about to create the third positive swing accompanied by a LuBot trigger which could favor the rise at least up to the previous highs area in the 173.80 area on which a first profit could be taken.
The stop loss was placed at the level suggested by LuBot which will be moved positive if the position were to move in favor without reaching the TP.
👍 If you want to see other similar posts, like/boost
🙋♂️ Remember to follow me so you don't miss my future analyses
⚠️ Disclaimer: This post is for informational purposes only and does not constitute financial advice. Always do your research before making investment decisions.

How to Properly Use Stop-Loss in TradingStop-loss is one of the simplest yet most underestimated tools in trading. Many beginners see it only as a “loss limiter” and place it randomly. In reality, stop-loss is a core element of a trading system, defining not only the risk size but also the logic behind the trade itself.
What is a stop-loss?
A stop-loss (SL) is a pre-set price level at which your trade closes automatically to limit losses. If you enter a long position, the SL is placed below your entry point. If you go short, it’s set above.
The main purpose of SL is to ensure you never lose more than planned. That’s why experienced traders say: a stop-loss is not just protection against losses — it’s a capital management tool.
Where to place a stop-loss correctly?
The biggest mistake beginners make is placing stops “by guess.” Professionals always base it on market structure. Here are the key principles:
- Beyond support or resistance. In a long, the stop is placed slightly below support; in a short, slightly above resistance.
- Considering volatility. On calm markets, the stop can be tighter. On volatile moves, it’s safer to widen the distance.
- By indicator signals. If an algorithm highlights a key zone, the SL is best hidden in that range.
So, a stop-loss is not a random number, but a logical point where your trade idea becomes invalid.
How does stop-loss relate to risk management?
Another common mistake is ignoring the risk/reward ratio (RRR). Professionals never take trades where the potential loss equals or exceeds the potential profit.
For example, if you go long on BTC at $114,000, set a stop at $112,000 (risk: $2,000), and a target at $118,000 (profit: $4,000), your RRR is 1:2 — a good setup. But if your target is only $115,000 (profit: $1,000), the trade doesn’t make sense since the risk outweighs the reward.
Why is it essential to always use a stop-loss?
Many beginners think: “I’ll close the trade manually when needed.” But markets are faster and harsher. One sudden move can wipe out a position before you react.
That’s why the golden rule is: it’s better to exit on a stop than to lose your account by holding onto losses.
Conclusion
A stop-loss is not “insurance against mistakes” — it’s a strategic tool. It defines the level where your trade idea stops being valid and enforces discipline by removing the temptation to hold onto losses.
Remember: you can’t control price, but you can control your risk. And it’s the stop-loss that turns trading from chaos into a manageable process.
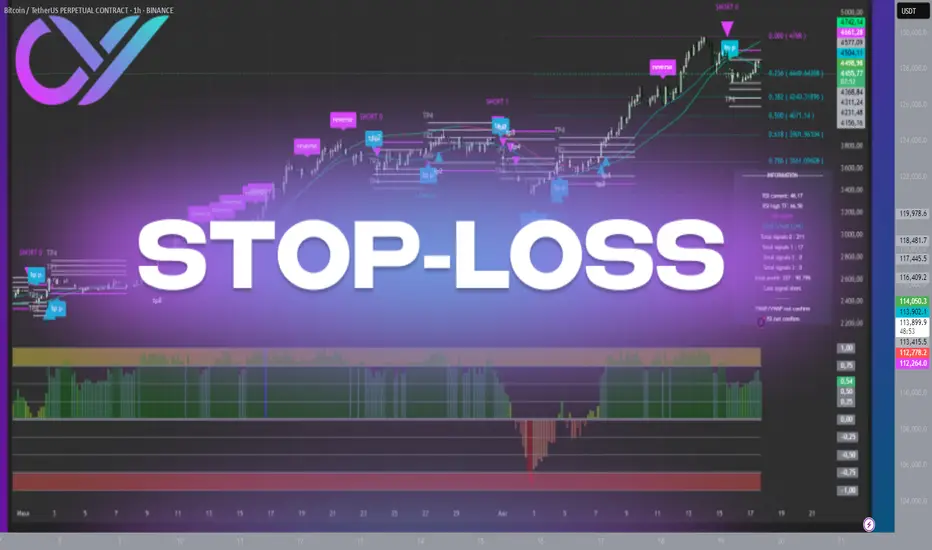
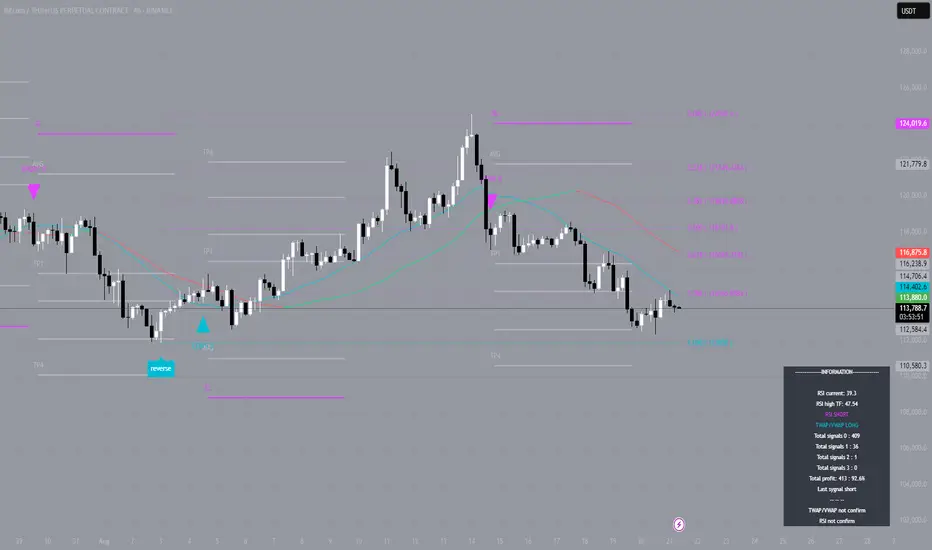
BTC — Sharp Drop: Signal Hit TP3
On August 14, the indicator on the 4H timeframe generated a clear short signal around the $118,000 zone. From the very first hours it became evident that the market could no longer handle the overheated conditions: momentum broke down sharply, and a rapid decline began.
The drop was intense and unfolded almost without pauses. The price quickly moved through the key levels, confirming the strength of the signal. TP1 and TP2 were hit in quick succession, and by August 21, the market reached TP3 at around $113,000. This move became one of the clearest confirmations of how fast the market can unwind built-up pressure in just a matter of days.
What’s important is that the signal still remains open. No clear reversal impulse has been seen, and sellers continue to hold control. The weak reaction from buyers at local support levels only increases the likelihood of further downside.
This current dynamic highlights a key lesson: when the market is overheated, corrections often come sharply and without warning. In such moments, a systematic approach is essential — entering on a valid signal and following the trade step by step toward predefined targets.
Dead Cat or Last Breath? RHC’s Pivot Trap LoomsRHC is sitting at a pivotal moment. For the bullish case to stay alive, we need to see price swiftly reclaim and close above ~$43 — that’s the line in the sand.
However, I’m leaning toward Scenario 1, which suggests a short-term push up to the yearly pivot and macro 50% retracement level, followed by a rejection and sharp move lower.
Bearish Pathway
Initial Bounce: Push toward ~$43 could trap late longs.
Rejection Zone: Yearly pivot and macro 50% level act as resistance.
Downside Targets:
First stop: $26 — previous structural support.
Then potentially: $18 — deeper liquidity zone and psychological level.

COL Bullish Blueprint: $20 or $18.93 — Which Launchpad Wins?Coles is setting up for a sustained move higher. The structure is clean, and two key scenarios are worth tracking:
Scenario 1:
Shallow Pullback to ~$20
LVN Zone: Low Volume Node suggests weak price acceptance — price may dip but not stay.
Fib Confluence:
50% retracement from the recent 1-month 2-bar swing low aligns with this zone.
Yearly R1 Pivot:
Adds structural weight to the $20 area.
Expectation: Quick dip, then bounce — ideal for aggressive entries with tight invalidation.
Scenario 2:
Deeper Pullback to ~$18.93 (Preferred)
Major Support Cluster: Previous swing tops now act as support.
Macro Fib Level: 50% retracement from ATH to the March 14.81 low lands here.
Wick Memory: March’s long wick suggests liquidity and buyer defense — midpoint could act as a springboard.
Expectation: Stronger base, better risk-reward, and potential for a more explosive leg higher.
Invalidation: if we have a monthly close below $18.31 then the chances was this breakout was a false move.
please note, no time analysis done arrows show pathing

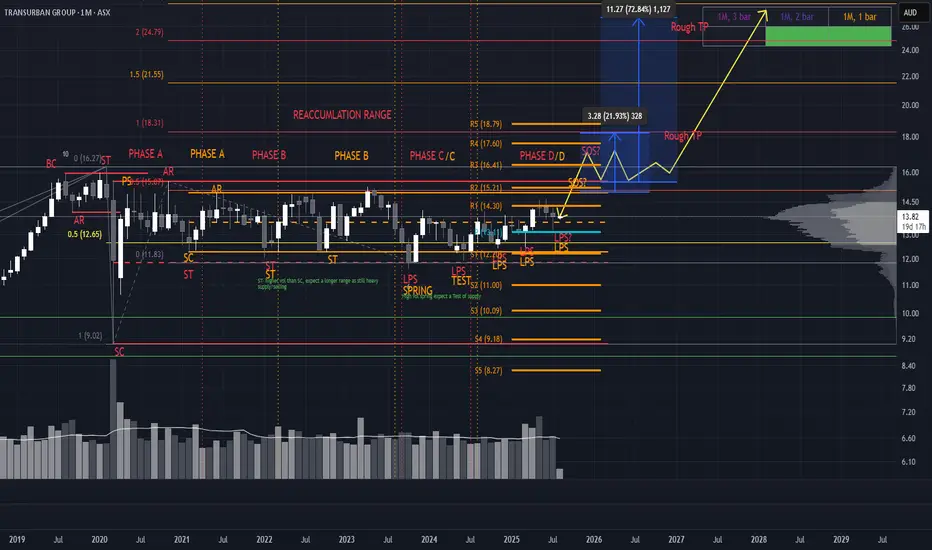
Two Ranges, One Breakout: TCL’s Wyckoff-Gann ConfluenceCurrently tracking two distinct Wyckoff ranges on TCL, each color-coded for clarity. The structure is clean despite a few lines—each range tells a story.
Accumulation Zones
Key buying opportunities are emerging at the LPS (Last Point of Support), marked by higher lows. These are classic signs of strength and absorption.
Resistance & Breakout Potential
Expect notable resistance around $15.55, but a breakout is likely. We’re approaching a Gann 4th-time breakout setup, which historically carries strong momentum. If price reaches this zone with expanding volume and wide candle spreads, it adds conviction for a Sign of Strength (SOS) and a potential pullback to retest.
Targets & Confluence For take-profit zones, I’m watching:
Yearly pivots
Range extensions from both Wyckoff structures (100%, 150%, 200%)
Gann extensions for harmonic targets
This setup blends structure, volume dynamics, and time-price symmetry. If the breakout confirms, TCL could offer a textbook Phase E markup.
*please note no time analysis is done, just looking at pathing
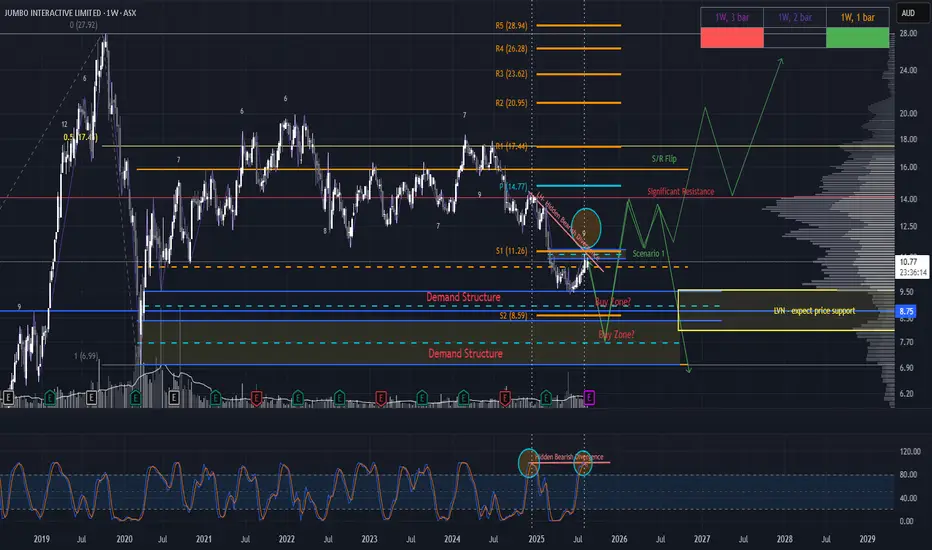
JIN Rallies into the Trap: Retail Shakeout or Reload?Jumbo Interactive (JIN) – Pre-Earnings Setup
JIN is primed for a classic retail shakeout, with the 26 August earnings release likely acting as a volatility catalyst. However, price action suggests the reaction could come ahead of the announcement, given the confluence of technical exhaustion signals.
Price Structure: Price has rallied for 9 consecutive bars, aligning with Gann’s reversal zone (7–10 bar swing rule). This rally is occurring on declining volume, into:
The yearly S1 pivot
A weekly fair value gap (FVG)
Hidden bearish divergence on the Stochastic RSI
Scenario Outlook: Expect a sharp reaction post-earnings (or sooner), targeting the Low Volume Node (LVN) or the Equilibrium of the monthly wick.
The ideal entry would be:
A closed daily dragonfly doji or bullish hammer candle in one of these two zones.
On elevated volume, signaling absorption and reversal
Profit Targets:
Initial TP: Macro 50% retracement ~$14 level or range high ~$16
Extended TP: Potential for a larger swing trade, contingent on a clean break above major resistance (S/R flip) with reaccumulation
Please note, arrows are not based on time analysis
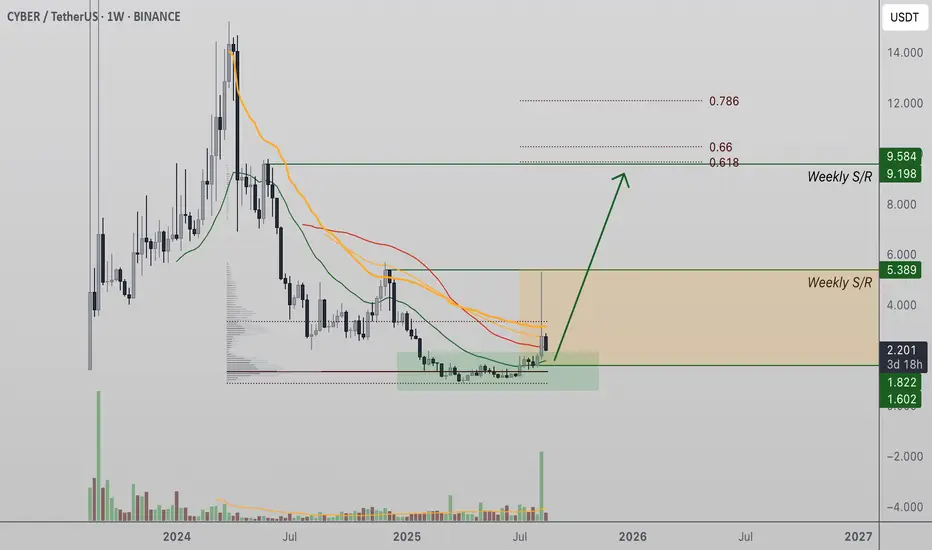
Cyber Pulls Back to Accumulation Zone After $5.38 RejectionCyber (CYBER) recently faced rejection at daily resistance of $5.38, leading to a corrective move. Price has now returned to its accumulation zone, where holding support could fuel a rally toward $9.19.
Cyber’s recent rally met stiff resistance at the $5.38 level, producing a rejection candle with a selling wick. This rejection has shifted short-term sentiment, causing price to pull back into the accumulation zone that served as the foundation of the last bullish expansion. While momentum has cooled, the corrective move is not inherently bearish. Instead, it represents a retest of structural support that could sustain the broader bullish trajectory if defended successfully.
The accumulation zone holds additional weight because it overlaps with the point of control (POC) on the volume profile. This region represents the area where the most trading activity has taken place, making it a high-volume node. Such areas often act as magnets for price and are frequently retested during corrective phases before continuation occurs. Cyber’s current retest of this zone therefore carries significant implications for its next directional move.
Key Technical Points:
- $5.38 Daily Resistance: A sharp rejection at this level triggered the corrective pullback.
- Accumulation Zone + POC: Price has returned to this high-volume support region, critical for maintaining bullish structure.
- Upside Target at $9.19: Holding support increases the probability of a rotation back toward the previous high.
From a structural perspective, Cyber remains in a bullish framework. The weekly chart still shows a pattern of higher highs and higher lows, meaning the broader trend has not been invalidated. The current corrective move should therefore be viewed as a retest rather than a breakdown. What matters now is whether bulls can maintain control of the accumulation zone in the coming days and weeks.
Volume analysis remains key to confirming the next move. While the recent pullback has not yet been accompanied by strong bullish inflows, this is not uncommon during early stages of a retest. Traders will want to see volume begin to pick up at support, as this would signal renewed demand and strengthen the probability of continuation higher.
If buying pressure emerges and price begins to rotate out of the accumulation zone, the path toward $9.19 becomes viable once again. This level marks a major resistance target and would represent a significant continuation of Cyber’s prior bullish expansion.
What to Expect in the Coming Price Action
Cyber remains in a consolidation phase following its rejection at $5.38. As long as the accumulation zone and point of control hold, the broader market structure will stay bullish. A decisive defense of this region increases the likelihood of another bullish rotation, with $9.19 as the next major upside target.
Solana Reclaims $162 Support as Bulls Eye $252Solana has reclaimed the $162 support level with multiple weekly candle closes above it, signaling market acceptance. The next target lies at $252, with the broader structure remaining firmly bullish.
Solana has shown renewed strength in recent weeks after reclaiming the $162 level, a major high-time frame support zone. Price has now confirmed multiple weekly closes above this level, a strong sign of market acceptance and structural integrity. This reclaim not only validates $162 as a pivotal area but also sets the stage for further continuation in the broader bullish cycle.
The weekly chart for Solana highlights consistent higher highs and higher lows, a textbook signal of bullish momentum. Each pullback has been met with demand, and as long as $162 holds on future retests, the broader structure remains intact. Even if the market consolidates or dips into this region again, the level is expected to act as a strong base for the next wave higher.
Key Technical Points:
- $162 Support: Reclaimed with multiple weekly closes, confirming structural strength.
- Value Area High Resistance: Currently capping price; a breakout opens the door to higher levels.
- Upside Target at $252: Major resistance zone and the next key projection for bulls.
From a technical perspective, Solana is already demonstrating clear signs of demand. The value area high, which is being respected with precision, stands as the next barrier for price. Once this resistance is reclaimed, the probability of a rotation toward $252 becomes high. Such a move would not only represent significant upside but also further confirm Solana’s bullish standing among major altcoins.
The importance of the $162 support lies in its history as a strong pivot point. Previously a contested zone, the successful reclaim and acceptance above it transforms this level into a launchpad for further growth. This is a common characteristic of high-time frame supports, where a prior barrier turns into a foundation once retaken.
Volume analysis also supports the bullish bias. Increased participation has accompanied Solana’s defense of $162, with accumulation showing up in recent weeks. Sustained buying interest at higher levels often signals market confidence, providing a strong backdrop for potential expansions.
What to Expect in the Coming Price Action
Solana remains structurally bullish as long as $162 continues to hold on weekly closes. Consolidation above this level may extend in the short term, but each higher low builds pressure for the next breakout. If the value area high is breached, $252 becomes the immediate target, representing the next stage of the bullish projection. For now, Solana’s reclaim of $162 marks a critical technical win that positions the asset for further upside in the weeks and months ahead.

Strategic Reaccumulation Zone – NXT’s Next Move Is CriticalNXT is at a pivotal level and shouldn’t be overlooked. Price has rallied strongly off a clean April hammer, which aligned with:
Yearly S1 pivot
Macro 50% level (projected from ATL to ATH)
High volume confirmation
This confluence marked a powerful reversal. Price has now reached the 50% resistance zone from the ATH and April low. What happens next will likely define the longer-term trajectory.
Scenario Modeling
Scenario 1 – Most Bullish
Price breaks and holds above $14.48
Reaccumulation above this level
Sets up a challenge of ATH and potential price discovery
Scenario 2 – Strategic Pullback
Missed the April low? This offers a second chance.
Pullback to the Yearly S1 pivot (dynamic tool—watch where the local top forms)
A higher low here = ideal entry with strong R:R
Scenario 3 – EQ Demand Zone Entry
Price dips into the EQ zone of the April wick
Bullish candle off this level = high-quality entry
Converges with macro 50% ATL–ATH projection
will take much longer for price to challenge ATHs
Scenario 4 – Breakdown Risk
April low breaks
Downside targets: $6.96 and $5.78
Takeaway: This is a step-by-step reaccumulation watch. Let price reveal intent—each scenario offers a unique R:R profile. Stay nimble, stay strategic. I will update the chart when price settles
*please note, arrows are not time analysis

Taking trades on PAR indicator 95% success on BacktestTaking trades on PAR indicator 95% success on Backtest - Using DOGE for backtest and only taking trades when conditions met

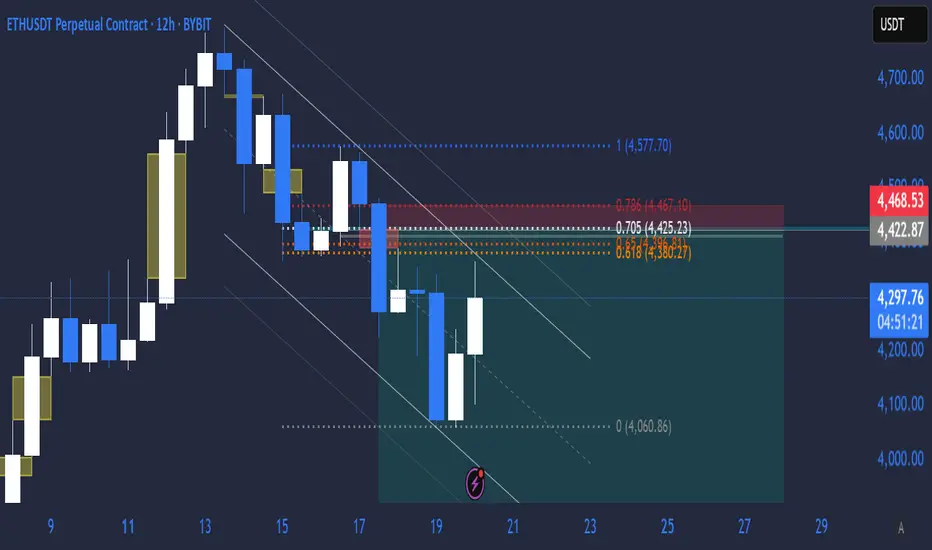
ETH Short IdeaA stack of mid time frame BB's b/n the 0.618 and 0.786 fib levels (if you take it from the swing high and swing low's). The downward 12h parallel channel also being used as confluence as the top of it will be where you enter short. Small risk only incase ETH breaks the trend as it's looking like one of the stronger assets.
LINK TradeSimilar to PUMP, if it can reclaim the box then I'd be interested in buying. Sitting on my hands until then

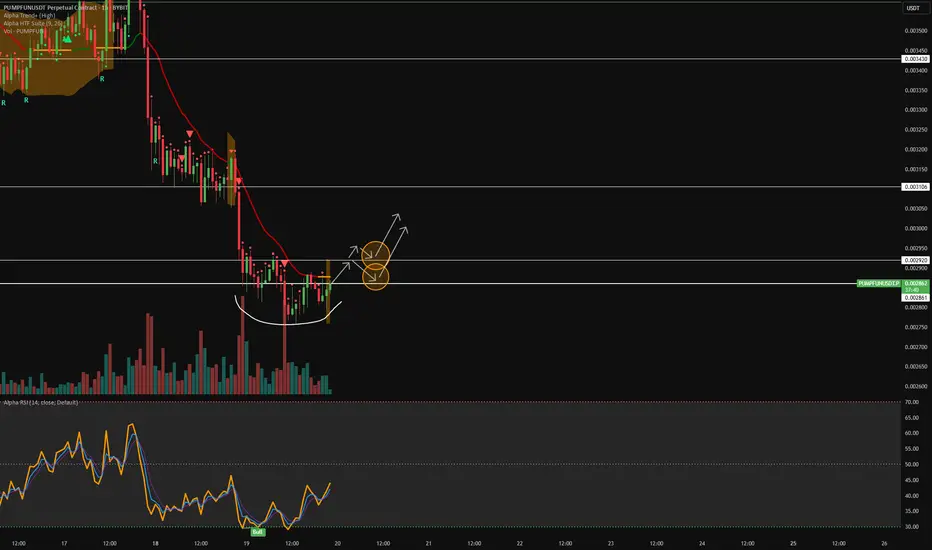
$Pump BreakoutWould like to see breakout + retest, would then buy at one of the circles ideally. Observing until then