Contains IO script

ASX200: Australian Strategic materialsPromising.
Now word to say yet but very promising.
This is the key and solution to get away from China and balance the supply of Lithium and Rare Earth Materials.
ASM have signed production with Korea.
Korea has a significant influence in production of Samsung phone and EV cars around the world.
all we need is first production and BOOM
Update at 15/08/2025
The momentum around building resilient and secure rare earth supply chains is accelerating in the United States.
ASM has been at the heart of discussions in Washington DC and is proud to be part of the evolving solution by being an active supplier of rare earth metals and alloys to the US Defense Industrial Base.
As we progress plans to expand our existing rare earth metallisation capability into the US, members of the ASM team recently travelled to North America to continue engagement with the Trump Administration, federal agencies, and state governments – exploring options for building commercial-scale domestic capability.
Meetings with the National Security Council (NSC), National Energy Dominance Council (NEDC), Department of Commerce, SelectUSA, Export-Import Bank of the United States (US EXIM), and others all verified the continued and growing urgency for diversifying existing supply chains and building allied mine to magnet capabilities.
Further travels to Oklahoma and South Carolina were highly productive. ASM met with both states’ commerce departments, economic development agencies, power providers, and permitting and workforce development authorities. We completed site due diligence on a number of brownfield sites in Oklahoma and South Carolina and have now identified a short list for potential selection.
Private sector engagement in both states, with existing downstream customers and financial firms, equally showed the high level of support that is growing for ASM’s mine to metals strategy.
With plans to build a second metallisation plant in the US and the results of our recent Heap Leach Scoping Study at the Dubbo Project indicating significant capital cost improvements and an accelerated pathway to heavy and light rare earth production, ASM is ready to be a near-term solution for securing allied rare earth supply chains – particularly those in the United States.

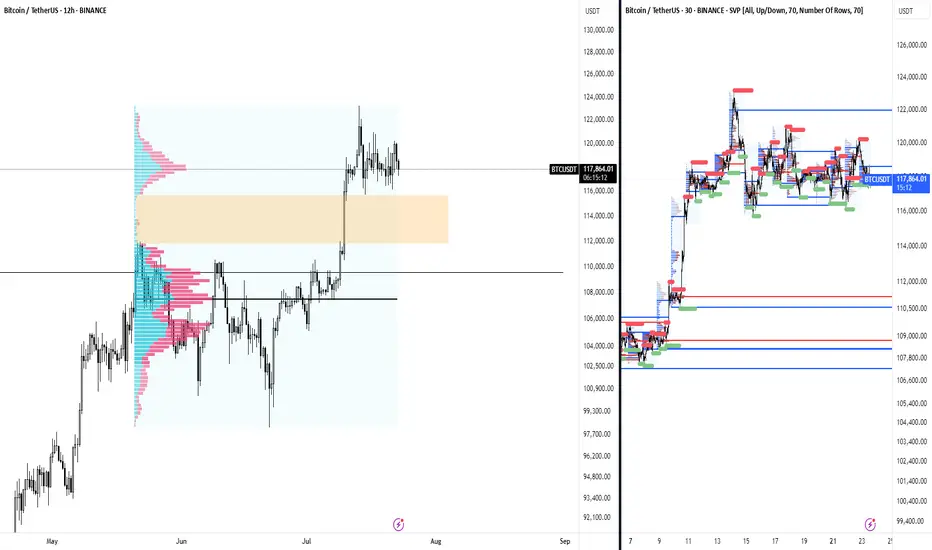
BTC possible failed range breakout - Aggressive Move The BTC ATH rally began post cash close and had very thin volume on the break out before setting this range on the higher time frames. Normally, a range after ATHs are made I would be extremely bullish and I am.
Aside from the failed breakouts at the highs, the attempts paired with nuances such as the crypto week impulses, the day of signing GENIUS and new regulatory acts being drafted now, the attempts to break those ATHs were nudged off.
Sometimes come failed moves come fast moves, and so I have to be prepared that BTC will trade between these thin areas on the volume profile from 111k to 115k. 113k being the most noticeable node in the entire profile.
Similar to my analysis on the break to ATHs, I would expect this move to be aggressive and remind us of a 2020 cycle style flush in Altcoins. Kind of already seeing it with the performance of alts today preempting the failed move up on BTC at range highs.
I will NOT be shorting anything in crypto, these are just areas that I am heavily interested in buying. Currently flat perps and will wait for BTC to make its mind up.

NIFTY50.....Time is on our side!Hello Traders,
the NIFTY50 rose 331 points 'til the end of the week.
A final sell-off hasn't started yet; but I am anticipating it.
Chart analysis:
Since the low of 24337, the NIFTY50 has risen by 465 point, peaking on Tuesday the 12th.
The chart leaves behind a difficult to assess pattern. Either we have seen the end of waves (iii), pink, or the start of a wave c/y with targets much lower in the coming weeks ahead.
With a wave (iv), green, coming to an end, the next move should be to the upside with potential for a new ATH in the coming weeks. My long term favored price target @28905 is still valid!
The bears need to watch, if wave b/x has ended, and a waves a-b-c are still in progress!
In any case! The wave structure is not clear to my view, and maybe the coming week will clear the focus we need to have!
Seasonally, the time has come for correction for the coming 8–10 weeks, but the stock marked is not like a "Christmas wish list"!
So, I recommend staying at sideline, as I did many times before. That is the time, where we all can crash our trading account!
We all need to wait for a clearer structure at the chart and if we can catch one impulsive move, we will be there and take the chance to do so!
For the coming week I will check the chart daily, and I will update, if something important happens!
Have a great week.....
Ruebennase
Please ask or comment as appropriate.
Trade on this analysis at your own risk.

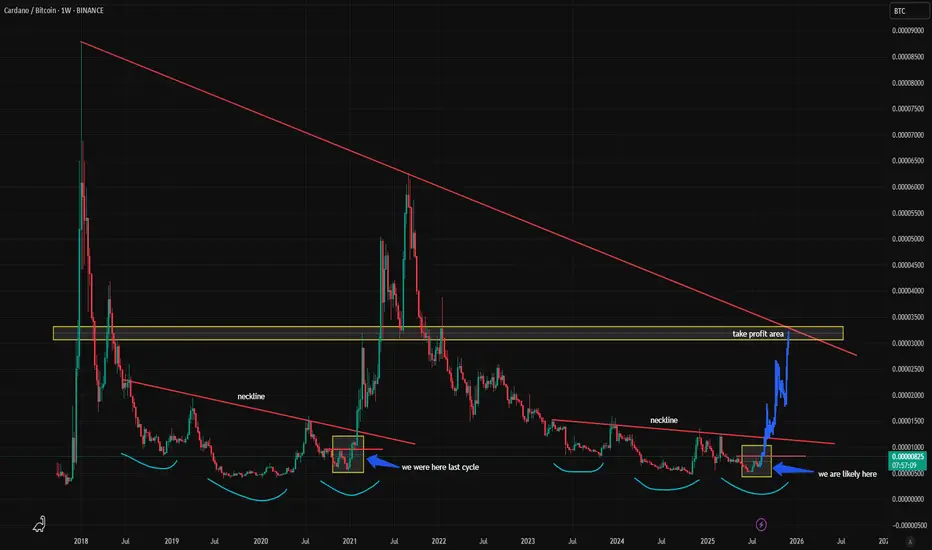
ADA/BTC - 2021 COMPARISONADA vs BTC from last cycle:
Inverse Head and Shoulders Pattern
Break of Local Resistance (red horizontal line)
Break of Neckline was the start of the bullrun for ADA/BTC
Current Cycle:
Possible Inverse Head and Shoulders Pattern
Awaiting Break of Local Resistance (red horizontal line)
Awaiting Break of Neckline to start the bullrun for ADA/BTC
We could see a pullback in September back to the bottom of the yellow box, making a swing failure pattern (September of post halving years have always been red), but if resistance breaks than it could signal the start of a huge breakout.
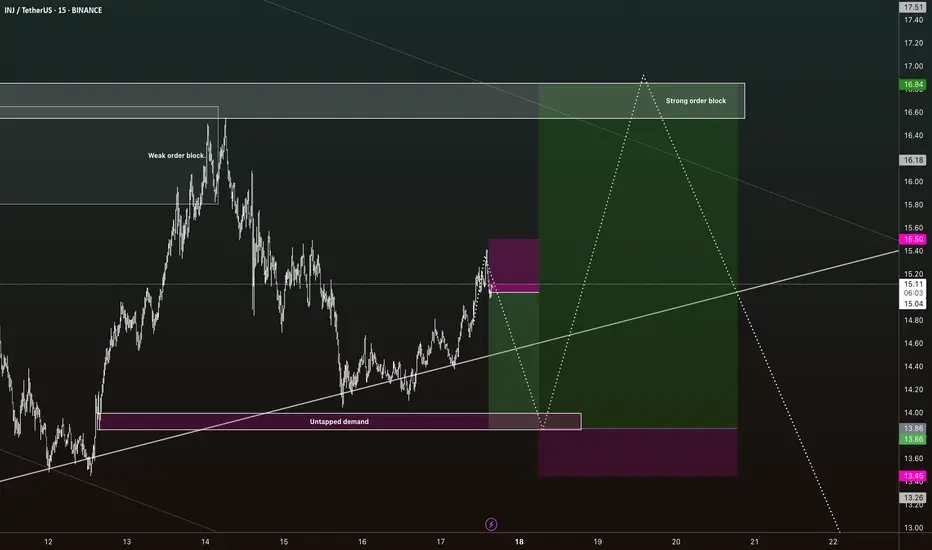
Injective Demand > Order block USDT.D has some supply above, therefore I see Injective tapping the demand area below, before reaching a HH - but the order block at around 16.8 will be strong resistance. This is in line with a final pump for BTC before we start to form a correction on BTC..
NQ daily retracement level reached - potential upcoming longsNQ retraced excatly to the 0.705 Fib level and into the daily order block. A valid POI for a swing low formation that can turn into a MMSM to new ATHs.
During the retracement nice trendline liquidity was built that can be used during the new bullish swing.

OKB Technical Outlook – Key Levels & Market ContextDescription:
OKB is the native utility token of the OKX ecosystem, designed to provide benefits such as trading fee discounts, staking rewards, and access to exclusive products. The project maintains strong fundamentals with consistent ecosystem growth and a clear roadmap that supports long-term adoption.
This technical analysis focuses on key support and resistance levels, trend structure, and potential setups without providing financial advice. Observing price action, volume, and momentum indicators can help traders make informed decisions.
Disclaimer:
This is not financial advice. Trading cryptocurrencies involves significant risk and may result in the loss of capital. Always conduct your own research before making any trading decisions

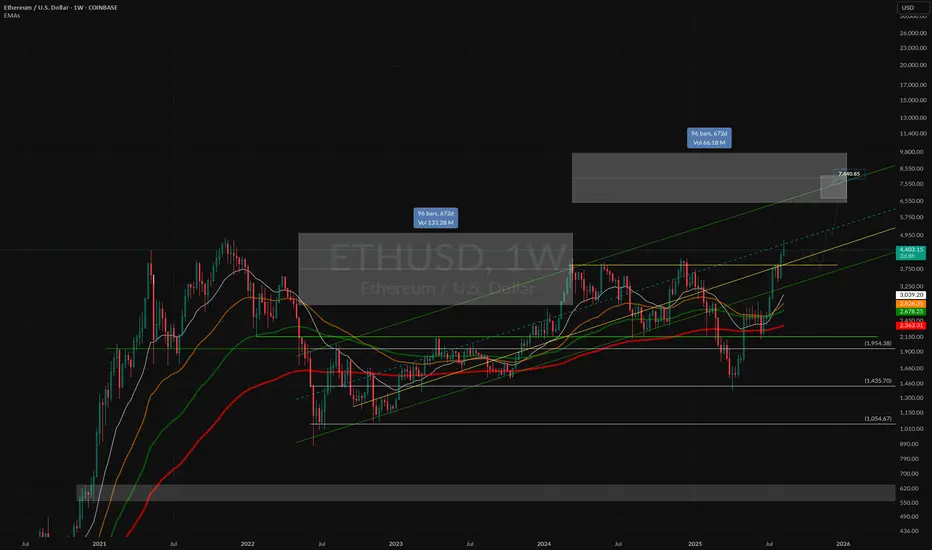
ETH Dip Before ATHSimple strategy using bolinger bands and various moving averages. Liquidity zone is around $4100. Expect to dip into that and maybe wick lower before the next leg up and break through ATH.

BTCUSD FIB channels on Daily heiking ashi candles.This is how I like to look at the market structure.
To draw this channel I put the Fibonacci channel over the last major lows and connected it with the last major high.
For some reason Bitcoin loves to move in these ranges. Lets see how this chart ages :D
(last chart was a work of art but tradingview didnt allow years of history to be played back...)

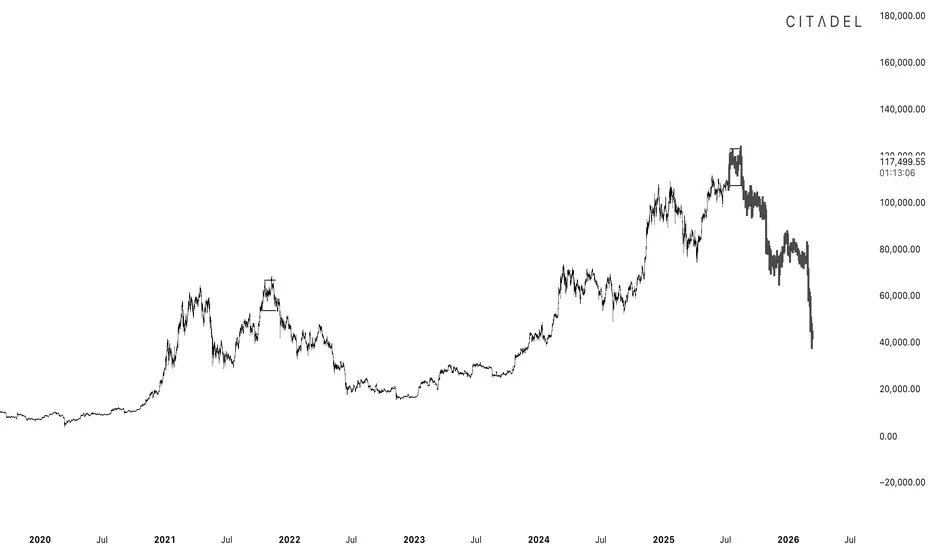
turtle soup completed. see you all at 40k next yearTS above CRH is completed on the monthly. still many who think this cycle will top the same as the last but imo the top is getting front runned by big cats. no alt szn and all alt pumps should be faded going forward
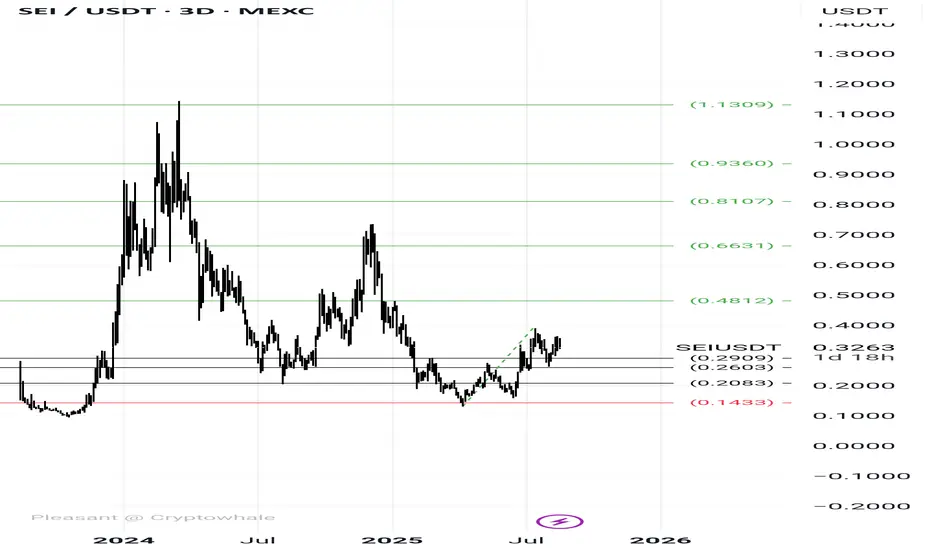
NOTCOIN Analysis On Demand Notcoin Is Still in Range. And Need To Break At Least The Level 0.002267 Before Starting a New Trend

#BTC.D Update After PPI NewsDominance dropped perfectly into our yellow zone, and after today’s PPI report we saw a small bounce. Now the big question is:
👉 Is this a reversal or just a retracement?
📊 According to my analysis, this is still just a retracement as long as price remains below the two bold blue lines and doesn’t break above the yellow zone.
✅ Shallow retracement is already done. If the market dips further, price could test Arrow #2 and continue down.
🔥 But if the drop comes from under the blue line at Arrow #3, then we’re looking at a strong, heavy move.
Also, keep in mind:
* A wave structure has formed and price just confirmed it.
* If this confirmation fails, we could see a big reversal.
* Otherwise, we continue the downtrend wave with targets at Arrow #4 and Arrow #5.
⚠️ Today’s move doesn’t mean much — the real momentum starts tomorrow. Patience is key. Let the market show its hand by tomorrow evening before entering the next setups.
💡 Remember: Discipline + Patience = Profits
Stay focused, don’t rush. The big opportunities are coming! 🚀

AFCOM - Weekly closing near support levelSharp pullback seen from near 40W EMA to 10W EMA. Closing above Rs. 906 and volume need to be monitored.

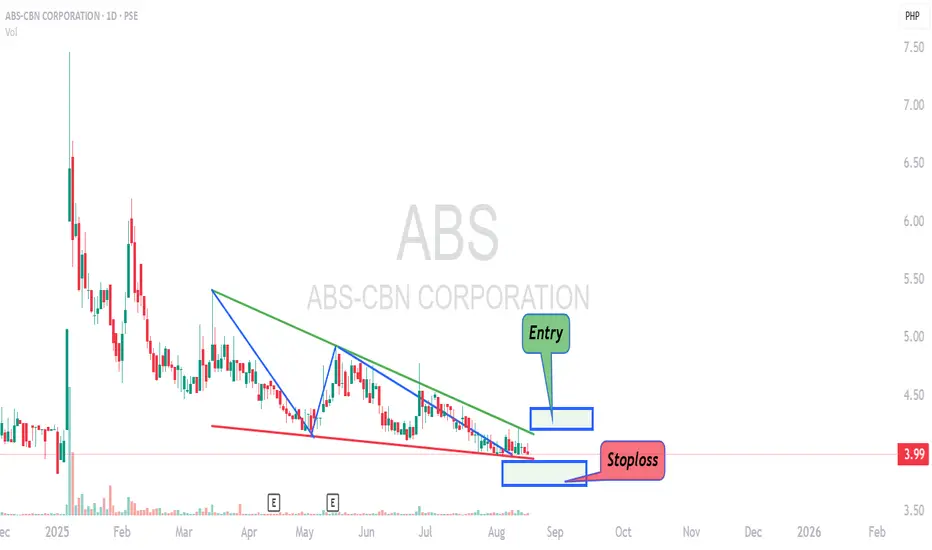
ABS Reversal Trade And Analysis Aug 16, 2025A Falling Wedge pattern showed up on ABS chart. It is a tradeable bullish reversal pattern. A falling wedge pattern is all about trendline resistance and trendline support. ABS price has been going up and down creating this narrowing range. If it breaks the trendline resistance then you have a bullish breakout. If it breaks the trendline support then you have a bearish breakout. Bearish breakout or what we call "breakdown" is useless right now in PSE market since there is no shorting available to retail traders yet as of writing this analysis.
This trade is very simple. There is a trendline resistance at 4.2 pesos. If the price breaks it or if the price goes up to 4.21 or higher then you can enter. You are entering on a breakout of the upper line of the Falling Wedge pattern. Upon entry, you set your stoploss at 3.94 pesos. That is the price below the lower line of the pattern. That gives you an exit if the price ever breaks the lower line.
Lets talk about risk. How much risk are you taking on this trade? Well, to do that, you measure from 4.21 pesos down to 3.94 pesos. That is over 6 percent. If you take this trade then you are looking at a potential 6 percent loss. The risk will vary depending on what price you have entered.
This is a bullish reversal trade. I gave you an entry price and a cutloss price. Your exit with gain will come from a different chart pattern. A bearish reversal one.
Thank you. Goodluck on your trade. May you trade well.
BTC/USD: $100K Shakeout or New All-Time High Incoming?Bitcoin has been trading in a strong bullish cycle, recently touching highs above $124,000, driven by institutional inflows, favorable macro sentiment, and expectations of Federal Reserve rate cuts. However, the market is now showing early signs of exhaustion, with prices struggling to maintain momentum above the $118,000–$120,000 resistance zone.
From a technical perspective, the 50-day moving average currently sits near $107,000, acting as the first major support level. A decisive break below it could open the door to a deeper retracement toward the psychological $100,000 level, which also aligns with a key historical demand zone.
The RSI on the daily chart is entering overbought territory, suggesting that a short-term pullback may be healthy for the market. Meanwhile, MACD momentum is flattening, indicating that bulls may be losing steam after an aggressive rally.
Fundamentally, Bitcoin remains in a strong long-term uptrend, but short-term risks cannot be ignored. Regulatory headlines, macroeconomic shocks, or a failure to hold technical support could accelerate a correction. Many analysts, including Arthur Hayes, have mentioned the possibility of a drop to $100K, not as a collapse but as a potential accumulation phase before another leg higher.
Key Levels to Watch:
*Support: $107,000 – $100,000
*Resistance: $120,000 – $124,500
*Breakout Target: Above $125,000 could trigger a run toward $135,000+
*Breakdown Target: Below $100,000 could extend to $95,000
While the macro trend remains bullish, a short-term dip toward $100K is a realistic scenario if momentum continues to fade. Long-term holders may see such a move as an opportunity, while short-term traders should watch for a confirmed break of $107K to position accordingly.

I'm ready to size up TTDIf you've been following me you know i've got TTD at a good price. I'm ready to size up position if we get a sell off in the next few weeks. The 9 take profit is coming up, sell could come sooner, but i'm looking for a test of previous levels (green horizontals) before the next leg up. I also continue to passively DCA into this.

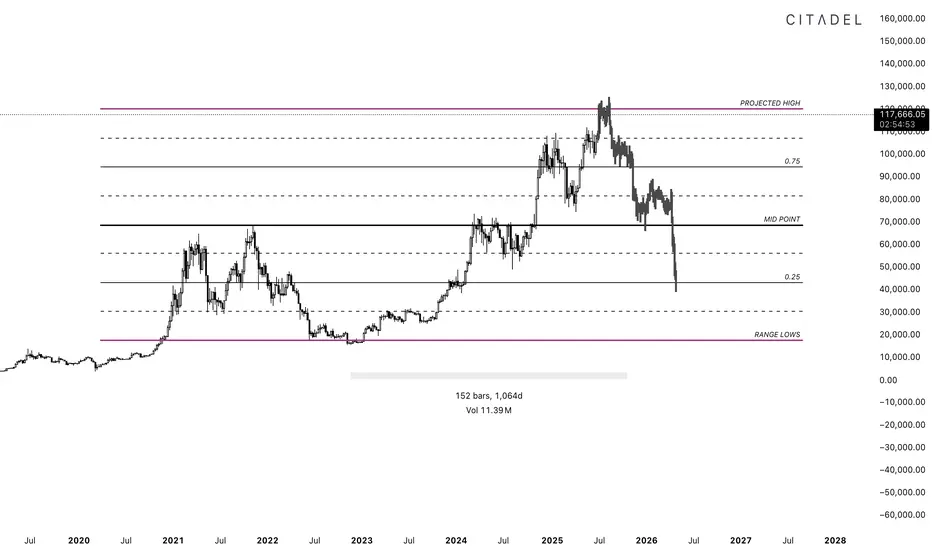
Basic bull targetBased on this parallel channel and 2x in length the target would be around 7-8K. Another parallel channel can be drawn within the bottom half. The 2024 triple top resistance should be the prominent bias here for confirmation on retest.
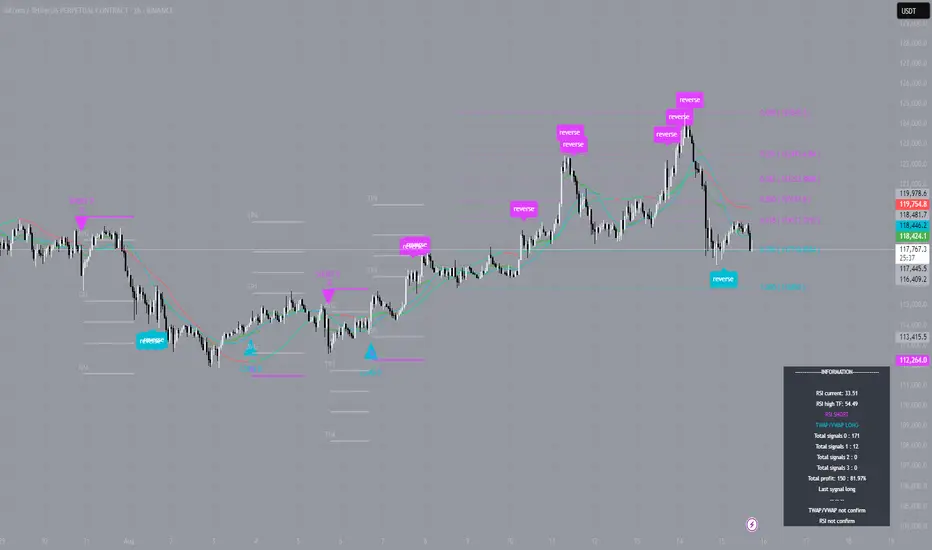
#BTC — The Long That’s Been Alive for Over a WeekOn August 6, our indicator on the 1-hour timeframe generated a long signal around the $114,000 zone for Bitcoin. At that moment, the move was just beginning to build momentum, and for many, the market looked uncertain. However, the algorithm precisely identified the entry point and has kept the trade open ever since.
Today, more than a week later, the signal remains active. The price has traveled a significant distance, while the indicator has been guiding the position all along — adjusting support levels and areas for partial profit-taking.
Is this pure coincidence, or does the machine truly see what is not always obvious to traders? The answer lies in mathematics: the algorithm analyzes not only price, but also market structure, trend strength, and hidden impulses. This allows it to stay in a position for so long, extracting the maximum from a move while avoiding false reversals.
The question remains for each to decide — mystery or cold calculation? One thing is certain: the long opened on August 6 is still very much in play.
ZKUSDT Long Setup – Aug 15, 2025
ZKUSDT Long Setup – Aug 15, 2025
Entry: 0.06431
Target: 0.0733 (+15.2%)
Stop: 0.0620 (-3.5%)
R:R: 4.32
I'm currently in this after profiting from the peak formation short and then reversing for the longer term trend.
Why Long?
• Multi-timeframe structure: Higher lows forming on 4H, daily, and weekly after long
downtrend.
• Volume profile: Bullish volume spikes on rallies, light volume on pullbacks.
• Indicators: MACD bullish crosses, CCI > 100, RSI divergence across higher TFs.
• Market context: Price breaking out of accumulation zone (0.062–0.064), aiming for next liquidity pocket near 0.073.
•. bullish ETH and other coins many follow with a lag behind
Execution
• Entry after London pullback to demand zone and BOS confirmation.
• Stop below demand zone 0.0614.
• Target set at prior daily supply zone.
Risk Plan
• 4.32 Risk to reward potential.
• Monitor 0.067–0.068 zone; partial profits if strong rejection.
Bulls have taken short-term control, with potential to push toward 0.073–0.075 before major resistance.
