What RegimeWorks Means – And Why I Often Don’t TradeMost traders start with entries.
I start with permission.
RegimeWorks is not a signal method – it is a decision filter built on three questions:
Is the market currently behaving in a defined regime?
Is the active session appropriate for participation?
Is today’s quality high enough to justify risk?
If any answer is “no” → the correct trade is to do nothing.
That is why many of my ideas show no-trade outcomes.
Not because the market is “bad,” but because discipline is part of edge.
Good trading is not about finding reasons to click buy or sell.
It is about filtering conditions where behavior and liquidity disagree.
If this page looks boring, that is intentional.
Professional process usually is.
What you will NOT find here
• No signals
• No hindsight entries
• No prediction contests
• No hype
What you WILL find
• Context before action
• Session awareness
• Risk-first thinking
• One behavior at a time
The indicator shown on my charts is a framework tool only – it defines when to be cautious before when to participate.
Context

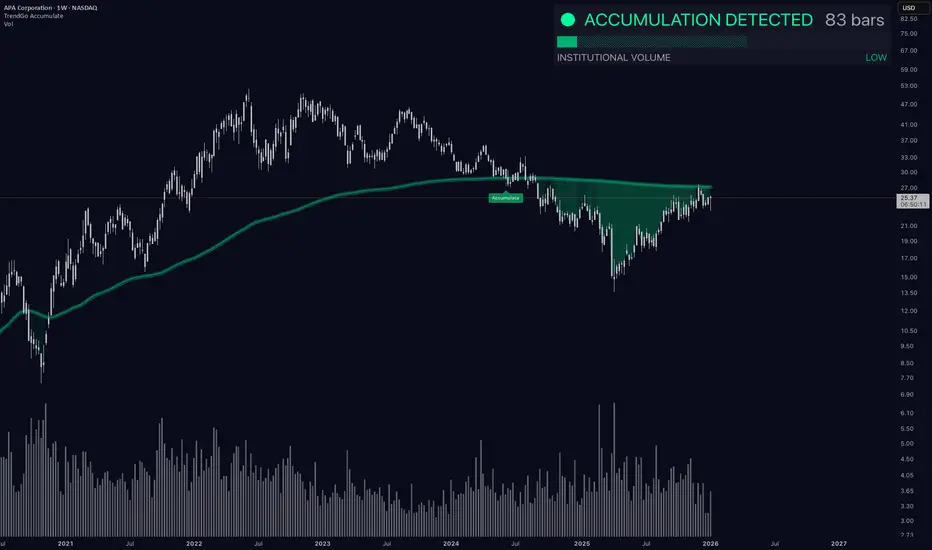
APA Corporation (APA) - Weekly Accumulation & Compression PhaseOn the weekly timeframe, APA is entering a well-defined accumulation and compression phase . Price has stabilized and is consolidating directly inside the Accumulate zone , which suggests that selling pressure is no longer dominant and that supply is being absorbed rather than expanded.
From a structural perspective, this is not a breakout environment yet - it is a pre-expansion phase . Historically, similar compressions after extended declines tend to precede directional moves , as volatility contracts and the market prepares for resolution. The longer price remains compressed within accumulation, the higher the probability of a dynamic expansion once balance is broken.
Importantly, this consolidation is occurring on a weekly timeframe , which increases its relevance for medium- to longer-term positioning. Accumulation on higher timeframes often reflects institutional behavior rather than short-term speculative flows.
At this stage:
• Structure favors base-building , not continuation of the prior downtrend.
• Volatility compression increases the likelihood of a trend acceleration once price exits the range.
• The Accumulate zone continues to act as a contextual anchor, defining where risk is being absorbed.
As always, the focus remains on context and structure , not prediction. The market is transitioning from distribution to balance - the next impulse will define the direction, but the groundwork is clearly being laid.
VARONIS (VRNS) - Accumulation zone revisited | Higher-timeframe VARONIS (VRNS) - Accumulation zone revisited | Higher-timeframe context
Price has once again returned to the Accumulate zone , an area that historically marked institutional stabilization rather than distribution.
Looking at the broader structure, this is already the third occurrence where price interacts with this zone after an extended move. In the two previous cases, similar conditions led to strong impulsive advances , once downside pressure was absorbed and the market transitioned back into trend continuation.
From a structural perspective:
• Price is testing a higher-timeframe support area rather than breaking structure.
• Volatility expanded to the downside, followed by compression - a typical behavior during absorption phases.
• No signs of aggressive distribution are visible at this stage.
This setup is best viewed as a contextual accumulation phase , not a timing signal.
The key element here is where price is located in the broader trend, not when to act.
As always, sustainable moves tend to emerge from patience, structure, and momentum alignment , not from chasing short-term reactions.
Context first. Decisions second.

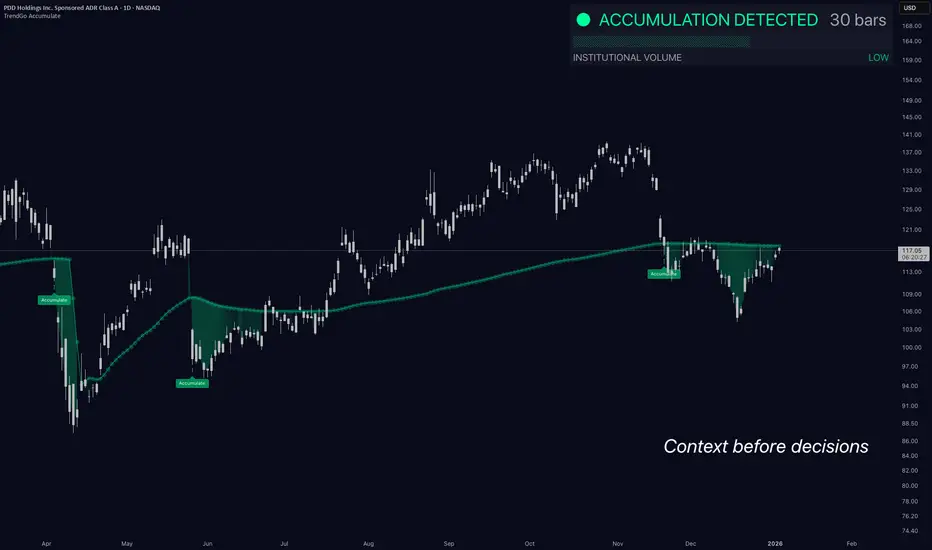
Context Before Decisions | Why This Accumulation MattersMost traders focus on entries.
Professionals focus on context.
⸻
On this chart, price is not doing anything spectacular on the surface.
No breakout. No momentum expansion. No trend acceleration.
And that’s exactly the point.
What is visible here is institutional accumulation behavior :
• Price holding near a long-term reference level
• Reduced downside continuation after selloffs
• Repeated absorption zones marked by Accumulate
This is not a buy signal.
This is information.
Accumulation doesn’t tell you what to do.
It tells you where attention should be focused.
Markets don’t move because of indicators.
They move because capital positions itself quietly before expansion.
If price eventually breaks structure and momentum aligns - this context becomes valuable.
If it doesn’t - the context simply expires.
No prediction.
No hype.
Just preparation.
⸻
Key takeaway:
👉 Context comes before decisions.
👉 Decisions come after confirmation.
⸻
🔒 DISCLAIMER
This analysis is for educational purposes only.
No financial advice. No trade recommendations.
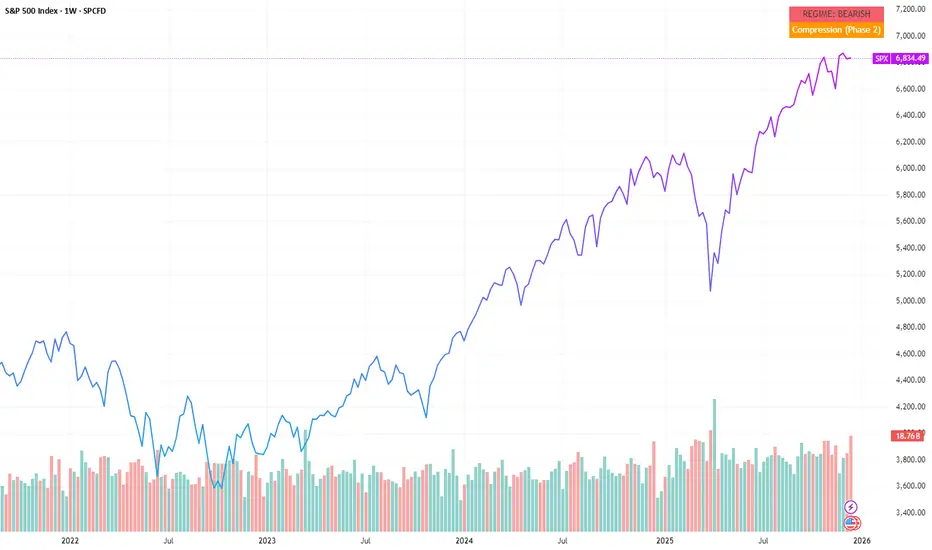
When regime shifts before price reactsOn the SPX weekly chart, price still looks firm, even as the higher-timeframe regime has already turned bearish.
The Free HUD looks past short-term movement and reflects broader context.
Here, that context has changed while price itself has not.
This isn’t a signal.
It isn’t a forecast.
It’s a shift in conditions.
Regime changes often become visible in structure before they show up clearly in price.
Markets can keep moving while internal alignment is already changing.
That disconnect between price and structure becomes easier to see here.
Context before conclusions .
Educational context only. Not financial advice.
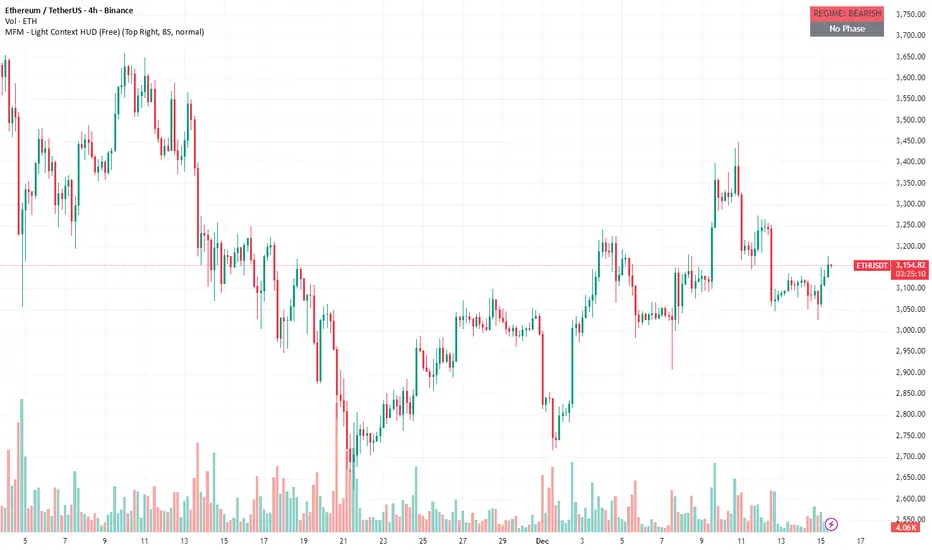
When context refuses to confirmPrice moves, reacts, and creates local structure,
often triggering the urge to anticipate or “do something”.
The MFM Free HUD does not comment on direction or entries.
It only shows the broader market context.
In this case, the environment remains bearish, with no structural phase in control.
No phase doesn’t mean “nothing is happening”.
It means conditions are unreliable for method-based decisions.
Context before action.
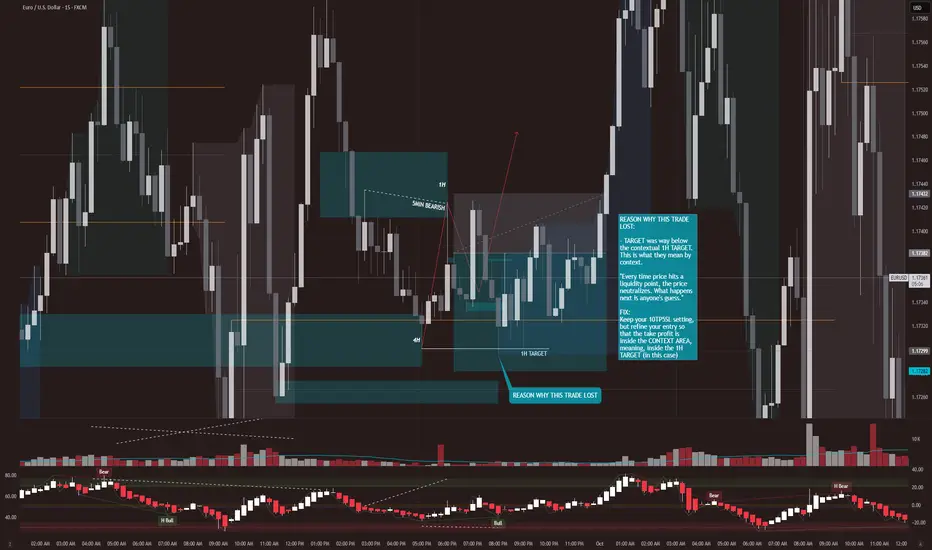
First Time Losing... That The Reason is ObviousFirst Time Losing... That The Reason is Obvious
I feel like this is a good losing trade.
I basically won.
Figured out the market bias correctly, found the target liquidity, and the narrative(POI) to get there.
1H POI, 1H TARGET, Bearish Orderflow, BSL Sweep, Divergence, Overbought, and entered on the 5min FVG after the sweep.
All criteria for entry are aligned.
Price went to where I expected it to, with momentum.
The only mistake?
Setting the take profit point farther than the 1H TARGET LIQUIDITY.
That's it.
After it hit that liquidity, price really just moved uptrend with momentum.
I've read some comment on youtube that said, “Price seeks liquidity, and once that liquidity is filled, it rebalances back to equilibrium.” or some shit like that honestly it was such an awesome quote that i remembered the meaning of it(very rare). The exact wording, I forgot.
well, that's it.
Honestly, this might seem obvious to you, but this is such a big step for me.
I used to NOT KNOW why my trades were losing. Like, what am I doing wrong, is the strategy wrong, should i find another strategy, should i switch to elliot wave, etc etc lmfao.
But now... the fact that I immediately knew what was wrong with my trade, and the fact that only one thing was wrong and is easily fixable in the next trade... is such a breakthrough for me.
Well, thanks for listening to my TedTalk.
Context and Learning To Change With ChangeOne of the hardest things for traders, or anyone for that matter, is to adapt to change. Mostly we get stuck when things change, which makes trading difficult since the very nature of markets is change. This is where the cliché 'going with the flow' originates, but simply understanding the cliché isn't enough; we must internalize and practice it and get it in our bones.
In this post, I will outline a trade plan for RNG. This is a part of our '30 Planned Trades' series, where we plan every aspect of the trade ahead of time and then execute what we have planned.
One aspect of a trade plan is the method or setup. Setups don’t happen in a vacuum, there is a context that determines the meaning of the content. I’m going to approach context very simply here as the thing that decides if the market is going up or down.
I often read things about how I should follow the trend or go with the flow or don’t fight the market, but exactly what trend or flow should I follow? It’s too abstract, so I’m going to fix a cycle to follow and learn to let go and change when it changes.
In the video, I show the basics of a simple practice you can try, using a rolling 100-bar cycle to determine if we are looking for long setups, short setups, or in a transitional or neutral phase. I not only want to be precise and consistent in my Trade Plans, I want to be consistent in my methods.
By adhering to a fixed cycle and adapting with changes, I avoid the need to guess or predict market directions, maintaining balance in my approach. Think about this: If you charge your mind with the impossible task of predicting a market when markets are unpredictable, you will end up a nervous wreck and then wonder why your trading is so emotional.
I encourage you to try this practice. Since it keeps you from constantly looking to the left of the chart or at higher time frames for more information, it will likely push you out of your comfort zone into the unknown, which is a good start.
Shane

Pro vs AmateurIn trading especially in retail trading we have a massive focus on entries and very little focus on the context behind the trade, we focus alot on things such as indicators, or the perfect candle set up, but we have very little look into the context, so the fundamentals or catalysts behind the move in the first place, we tend to overlook this and focus purely on probability which can take its toll on your account balance.
Whereas in a professional environment they do things very differently with a major focus on the context behind the trades, and why price is going to move a certain a way, and the entry itself is actually a lot smaller part of how and why they trade, it is more the icing on the cake.
So the takeaway is to realise that in a professional environment the focus is less on the indicators and moving averages ect, and more on the reasoning, so to align ourselves closer to professional trading we need to make sure there is always context behind our decision making, in the long term this is how to become consistently profitable.
An interesting way to look at this, is to view the forex market like any other market in the world! it is merely a buying and selling exchange, so would you believe that anywhere else in the world for example the housing market, would a high end property developer be waiting for RSI indicator to be below 30 before buying houses? or would they wait for context like rising interest rates or declining interest rates?
Would they be waiting to see if demand or supply increased before making these high end decisions? so why as a trader should our trading be any different? we need to find value and opportunity!

Morning Ideas December 30, 2021Good morning traders,
Same ol' stuff, different day. Still consolidating at the highs, likely to see some kind of push in the next two trading days to "clean up" this weak high.
You need to distance yourself as a trader from the result of the next trade, and think of the market in probabilities. The data shows that the probability of the market continuing higher is much higher than continuing lower.
Whatever happens in this particular trade, is irrelevant. Each trade is just 1 trade in a large sample.

Morning Ideas December 29, 2021Good morning traders,
We are still balancing on the highs and I would expect the dips to continue to be bought into the new year.
Trendy looking profile, clearly looks unfinished to me.

$WISH Wish Context Logic Analysis $Wish Context Logic Analysis
NOTES:
- Wish is currently at all time low-ATL
- There are currently 2 RSI takeaways:
-- RSI Divergence is shown on the chart: followed by price correction, white line chart on RSI
-- RSI Convergence is shown on the chart last week: will follow by price upward momentum, shown in yellow on RSI
TAKEAWAY:
- Price will move higher towards the mid-level support line at around $4.75/s
- WATCH the mid-level support line at $4.75.
-- IF BOUNCE the price will move lower
-- IF BREAK the price will continue to $6/s range
REMEMBER: if you have a stock in mind, let me know I will upload a TA.


Morning Ideas December 2, 2019Right in the middle of where we traded around the thanksgiving holidays.
I expect this to be a neutral type of day while everyone is back at the desk after the holiday break.
I look for 3150-3140 areas to frame the market today.

Morning Ideas November 22, 2019A nice ping pong between areas yesterday.
3111 looms large today, and it's where we are at the time of the video. I would expect to see some more fighting here from the sellers.

Morning Ideas November 21, 2019Beautiful fall into the volume below yesterday afternoon on news.
Look for the market to try and make a decision here around 3110 and if its able to sustain above it, look for 3120.
If not, 3090's are back in the cards.

Morning Ideas November 20, 2019A good lesson on unfinished profiles and what they mean.
I would expect to see 3110 area be a big level this morning. If we are able to sustain prices above it, 3122 is back on deck.
If we break below and pull back, I'd expect to see some sellers step in and try and move us down towards 3095


Morning Ideas November 15, 2019Got a nice push higher overnight to finally separate ourselves from the range.
Careful here as the push looks like it could be exhaustion, I'm looking at the 94 area on a pullback.

Morning Ideas November 14, 2019Market still clearly accepting prices higher.
Profile becoming very box-y meaning that the market is indifferent at any price between the highs and lows of value.
The line in the sand below is still 70, in my opinion, and you'd wouldn't be wrong staying long until that is broken.
Remember, the market is accepting higher and when that happens, the more likely scenario is that we will continue in that direction.
If you're going to be short from up here, you have a nice Reward for your risk as long as you keep the stops tighter.
You don't want to be holding on to positions against the grain that are moving against you.

Identifying contextThis looks like a range as it passed the 76%fibo and broke the channel just about.unsure however because once the 3rd boundary reaches lower than the 1st doesn’t that cancel\restart the range so would my 3rd boundary in this case become my 1st

Morning Ideas October 18, 2019Still short from yesterday.
Low volume overnight, looking like a dead kind of day to end the week.
I am still looking on the short side for the market to rollover. The key to knowing this trade is wrong is if we start accepting above 3000.

Morning ideas October 17, 2019We are now hanging out at the top of balance.
Gun to the head, I'd still want to be short.
If I change my mind on the short, it's becuase the buyers will move the market abvoe this 3000 area and we will start to trade a lot of volume up there.
Until then, if you are long from here you are buying the breakout from value high and that's a losing proposition, long term, in this instrument.
Remember, whether this trade works or not is irrelevant, whats important is the body of trades.
