Bitcoin Update
Bitcoin — Pre-New York Session (Daily)
By CORE5DAN | October 21, 2025
Bitcoin tests the edge — bearish range meets its make-or-break moment.
Price is pressing against the bearish range’s lower boundary, after rejecting the naked Point of Control (POC) at 111.086. Yesterday’s POC also declined to the same level — a sign of sustained supply pressure. We’re now trading down from bearish discount levels, approaching yesterday’s low at 107.449. If the Dollar holds its bullish bias, cross-markets could see heavier declines. The structure remains Locally bearish with range limits set between 116.077 (high) and 103.516 (low).
🧭 Technical Map
If today’s daily close prints below 107.449, it confirms a heavy bearish mode by algorithmic logic. Order flow flipped strongly bearish from the POC, with an aggressive reaction in the discount zone.
Momentum remains one-sided — patience over prediction.
🌐 Fundamental Pulse
A data-heavy U.S. week continues:
• Retail sales and housing data show mixed resilience.
• Yields stay near recent highs — tightening liquidity across risk assets.
• Fed speakers on deck later today may reinforce higher-for-longer tone.
Dollar strength keeps weighing on crypto sentiment as liquidity risk persists.
🎯 Plan
Hold positions aligned with structure.
Watch macro + order flow for alignment.
Avoid reacting to short-term bounces — the market is thinning, not turning.
💭 Mindset Pulse
“Markets are like Washington press briefings — lots of noise, little truth. Keep your logic, not your loyalty.”
Note:
Long-term, BTC remains in a weekly and monthly bearish macro range.
Stay patient, disciplined, and avoid greed as volatility expands.
Institutional Logic. Modern Technology. Real Freedom!
Core5dan

King Dollar Returns: 98.190 Break💵 Dollar Breakout — Cross Assets Dumping Hard
The U.S. Dollar just flipped 98.190 CAP
After weeks of hesitation, DXY broke clean through the 98.190 daily imbalance, turning prior resistance into a launchpad — and global markets are reacting fast.
📊 Technical Frame
The daily imbalance that capped price now acts as fresh support, confirming a higher-timeframe breakout.
Momentum alignment across 4H and Daily frames signals a firm trend shift.
Upside magnet sits at 98.800–99.200, the next liquidity shelf where sellers may regroup.
🌐 Fundamental Pulse
Cross assets are dumping — EUR AND GBP all bleeding as Dollar strength tightens global liquidity.
Yields grind higher with markets reloading for extended Fed tightness.
Risk aversion and portfolio deleveraging are amplifying the move — capital is flowing back into USD safety.
🧭 Takeaway
The Dollar is back in charge. Above 98.190, the structure supports continuation toward 99+.
In this regime, correlation flips: strong Dollar = weak everything else.
When the Dollar breathes in, global markets exhale.

US DOLLAR UPDATE DXYDXY — Rangebound but Firm: 98.19 Holds the Line
Dollar holds steady inside Friday’s range — a quiet coil before the macro rotation.
🧭 Context
The Dollar spent Monday trapped between Friday’s high and low, liquidating the upper wick at 98.190 before closing back within range.
Price currently sits near the 50% Fibonacci retracement (98.123), keeping the bullish range intact but unconfirmed.
The market is balanced, not directional — patience is the edge here.
📊 Technical Map
Structure: Price remains inside a clean bullish range with a volume imbalance still unfilled near 97.436.
Momentum: Mildly bullish but range-dependent — upward bias, no breakout confirmation yet.
Key Levels:
Support → 97.672 / 97.436
Pivot → 98.123
Resistance → 98.190 / 98.420
🌐 Fundamental Pulse
This week’s key drivers: PMI flash, GDP (Thu), and PCE inflation (Fri) — all high-impact data that will steer the Fed narrative.
Yields remain firm but cooling; risk appetite mixed as traders await fresh growth signals.
Without new inflation pressure, the Dollar likely stays rotational within its higher-timeframe band until late-week catalysts.
🎯 Plan
Primary: Avoid midrange noise. Best setups are at range extremes — 97.6 support and 98.2 resistance.
Execution Filter: Wait for volume expansion or 1H close confirmation before breakout engagement.
Alternative: Failure to hold 98.12 reopens imbalance toward 97.43; a break above 98.19 invites continuation to 98.4–98.6.
⚠️ Risk / Alt
Range = noise. Stay tactical. High-frequency trades only until volatility expands.
🧠 Mindset Pulse
“In dull markets, discipline is the premium asset — not conviction.”
Professionals don’t chase noise; they preserve readiness.

BTCUSD — Bearish range meets imbalance capBTCUSD - patience before momentum
Date: Sunday, October 19
Timeframe: Daily
Context
Bitcoin remains inside a bearish range — with high of116.080 and low of 103.492.
Price currently sits near the range low, trading into a discount zone the Fibonacci 50% retracement.
The big question: Does price reject from the imbalance cap, or reclaim it and squeeze higher?
Technical Map
• Structure: Daily range remains intact. A daily imbalance cap sits above price in the premium area. If rejected, we confirm bearish continuation; if pierced, it signals structural weakness in sellers and possible momentum shift.
• Momentum: Recent candles show mild bullish recovery. Wait for daily lows to start breaking before short continuation — patience here pays.
• Volume: Heavy bearish volume node clusters near the 111.000 psychological level — expect reaction.
Fundamental Pulse (Week Ahead)
• Macro Drivers: Traders watch US GDP advance data, PCE inflation, and Fed speakers for cues on policy tone.
• Yields: Rising yields could strengthen the Dollar — pressuring risk assets like Bitcoin.
• Liquidity Context: Stablecoin flows and ETF net inflows have slowed; liquidity rotation favors defensive positioning.
Plan
Bias stays bearish unless structure proves otherwise.
The ideal path: rejection from the imbalance cap and midrange confirmation lower.
However, if Dollar strength eases or yields drop, that may unwind shorts — watch structure, not emotion.
Remember: you trade your system, not your feelings.
Mindset Pulse
“You’re never lost when you know your map.”
Structure is the map. Emotions are the fog.
Wait for clarity — not excitement.

BITCOIN UpdateBitcoin — 104,716 POC in Play: Rotation or Breakdown?
Context
BTC remains trapped in a daily inside-bar range, digesting last week’s expansion.
Structure shows fading momentum within value, signaling a potential bearish transition.
Technical Map
• Point of Control (POC): 104,716.97 (key range Level) — line in the sand between control and collapse.
• Price Action: Low-volume compression near the POC; buyers fading as market pauses below mid-value.
• Key Target: 103,516.75 — next liquidity shelf if sellers keep pressure.
• Momentum: Bearish drift persists; initiative buying remains weak.
• Invalidation: Daily close back above 104,716 flips tone to neutral-bullish.
Fundamental Pulse
Markets are in a macro digestion phase:
• U.S. GDP & Core PCE data next week = volatility bottleneck ahead.
• Fed speaker blackout window keeps tone muted.
• Yields steady, crypto flows thin, and ETF inflows subdued — explaining the slow volume and cautious tape.
This is the classic “positioning pause” before macro catalysts hit.
Trade Plan
Below 104,716, bias remains bearish toward 103,516.75.
Mindset Pulse
The chart breathes in before it exhales volatility.

DXY UpdateDXY — The Volume Cap: Where Momentum Meets Memory
Every market has memory — and in the Dollar Index, it’s sitting right at 97.4.
That’s the current Volume Cap — a zone where heavy participation once stopped price cold, leaving unfinished business behind.
Price loves to revisit these caps, testing whether the imbalance still holds or finally gives way.
⚙️ Context (4H | Friday Recap)
Friday delivered heavy volume and clean directional flow — a textbook session.
DXY continues to rotate within the 97.048–99.198 range, holding a short-term bullish tone inside a larger consolidation.
📊 Technical Map
• Structure: Long-term bearish range inside a broader consolidation phase.
• Momentum: Still bullish, but showing early fatigue.
• Volume Cap: The 97.4 level remains unfilled, acting like a magnet for potential retests — the true battleground between continuation and correction.
🌐 Fundamental Pulse
After a month of running hot, the dollar finally cooled.
Retail Sales and Industrial Production softened, yields eased, and traders started whispering “rate cuts” again.
The Fed’s cautious tone keeps volatility contained ahead of next week’s Core PCE inflation data.
🧭 Trade Plan (If/Then)
If DXY runs through 97.4, watch for a bearish Volume Cap flip — potential downside toward nearby support.
If Monday’s price action drives higher, expect bullish momentum rotation back toward the 97.0 retest region.

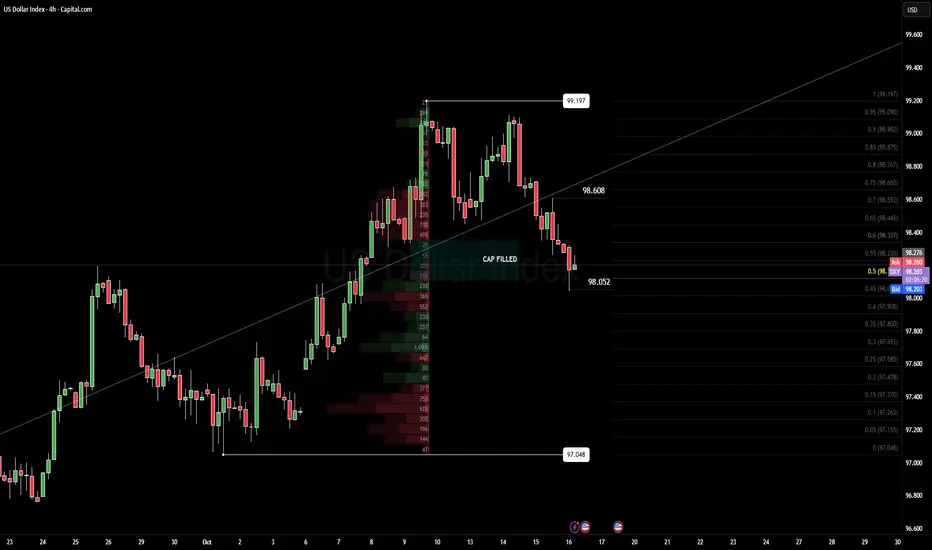
DXY — 4H Fibonacci Discount ZoneDXY — 4H Fibonacci Discount Zone: bounce or breakdown?
Context (4H | Pre-London | 16 Oct)
Dollar Index is testing a 50% Fibonacci discount zone after an overnight -2 deviation.
Volume remains light, but buyers stepped in near the 98.2 region, defending short-term structure.
Big picture still leans bearish
Technical Map
• Structure: Consolidation within broader bearish context — 4H recovery attempts forming.
• Key Level: 98.2 acting as short-term decision point; deviation off 50% Fib zone.
• Momentum: −2 deviation within 4H range — early shift toward mean reversion.
• Volume: Heavy order flow support beneath 98.0; thin liquidity overhead until 98.6.
Structure overall remains bearish, but short-term momentum favors a corrective bid from the Fibonacci discount zone.
Fundamental Pulse
The Fed minutes gave us a small dip in yields, but the Dollar didn’t flinch — it’s still holding firm.
Sticky inflation keeps the Fed cautious, reinforcing that “higher-for-longer” tone.
Now all eyes turn to today’s CPI at 15:30 EET — the real test for rate expectations.
For now, rates steady, risk tone calm, traders waiting for direction.
Plan (If/Then)
If DXY pushes above 98.6, expect momentum toward the 99.0 zone.
Break below 98.05 reopens path toward 97.6–97.4 support band.
R:R potential ≈ 1 : 3 — solid setup if volatility expands post-CPI.
Stay patient and scale small before the CPI lands.
Mindset Pulse
Observation beats anticipation.
Let price confirm your story, not the other way around.
Stay aligned with structure; one mouse click can cost a narrative.
EUR/USD — BEARISH FRACTAL TAKES SHAPEEUR/USD is developing a fresh bearish fractal, printing a high at 1.19187 after months of consolidation since June.
We’ve already broken last month’s low, and price now sits in alignment with the expanding dollar structure.
Momentum is building — a massive move may unfold next month, but for now confirmation is key.
If October closes bearish, this market confirms a full structural breakdown.
The June low near 1.1720 becomes Target 1, and I’ll be trading it heavy on a confirmed close.
Until then, the play is patience — hunting range discounts and watching orderflow rotations for clean continuation setups.
From a macro perspective, the dollar’s strength remains clear.
The U.S. Dollar Index (DXY) is pressing toward 99.197, an algorithmic expansion zone supported by volume analytics and internal order flow.
Rising U.S. yields and sustained capital inflows continue to pressure the euro, while Eurozone industrial output fell 4.3% month-on-month with Germany down 18.5%, underlining structural weakness.
From the CORE5 lens, structure leads, liquidity confirms, fundamentals justify.
As long as dollar momentum holds and EUR/USD fails to reclaim last month’s structure, the bias remains lower.

DOLLAR INDEX (DXY) — TECHNICALS FIRST, FUNDAMENTALS SECOND
Technically, the key level this week is 99.197. If DXY manages a bullish close above it, we should see a weekly structure shift higher. That opens the door for 99.8 → 101.5 as internal algorithmic targets. This isn’t wishful thinking — this is how systems behave when liquidity regimes flip.
Under that lens, any rejections beneath 99.197 or weak closes around it remain valid short setups — but only after structure gives the nod. Don’t force trades ahead of confirmation.
In the background, the dollar is reacting to trade-war rhetoric and political shifts. Trump’s 100 % tariffs on Chinese imports raised volatility, but he later softened his tone, suggesting more cooperation than conflict. Its complet currency war.
Meanwhile, some analysts argue a bullish case for the dollar remains due to relative U.S. productivity strength and higher real yields.
These narratives give motive, but do not override price structure.
So from CORE5’s frame: structure leads, news lags. Let clean price confirmation in the 99.197 zone tell you whether to lean into long bias or respect the risk of failure. Eyes locked.
BITCOIN — STRUCTURE SHIFT INSIDE BEARISH RANGEBitcoin has filled the 116.3 to 114.9 imbalance and is now trading inside a defined bearish range.
Lower-timeframe structure has shifted downward with significant volume left behind, which suggests this is not a place to buy into strength.
Price has completed the imbalance fill, and the next question is whether this area becomes a market-maker trap or a true continuation leg.
If smart money continues to build short positions, distribution could follow.
If liquidity dries up and buyers absorb, the trap scenario takes shape. Patience remains the correct position.
Focus on the 15-minute to 1-hour range for confirmation. A break of structure, a clean rejection, or a failed retest around 116.3 will define the next directional move.
Until that occurs, any trade inside this zone is a low-probability action.
On the macro side, the U.S. Dollar Index continues higher, signaling risk aversion and tighter global liquidity.
Bitcoin does not move in perfect correlation, but capital still follows the path of safety when the dollar strengthens.
In the current environment, the edge lies in observation and precision, not anticipation.
Let structure confirm before committing. Probabilities always favor the patient.

BITCOIN UpdateWeekly Wrap: The Dollar Holds the Key
BTC hit the highs, we shorted the trap, and rode it clean back to range low — 109,358.
That level? It’s the bearish validation line — the hinge between bull control and breakdown.
Now, price rejected 109 and bounced. As long as this weekly candle closes above 107,250, structure stays technically bullish. No weakness on tape, just normal liquidity rotation.
That’s why I’m closing the heavy shorts and keeping only micro runners. The market still reads algorithmically bullish unless that low gives way.
The wildcard, as always: the Dollar.
We’re sitting in a high-probability sell zone. If DXY rolls over, that fuels risk-on flow — BTC, Gold, and Euro all breathe again.
But if market makers squeeze it higher, that’s death to metals and crypto. Expect a sharp flush across the board.
📊 Bottom line:
→ BTC structure intact.
→ DXY in sell territory, but not confirmed.
→ Watch weekly close — 107,250 is everything.
Stay calm. This is the part where most traders misread rotation as reversal.

BTCUSD update
Bitcoin just smashed through another order block and slipped straight into the discount zone — the area where opportunity often hides.
Price has flushed thru last oredblock and is now sitting deep in liquidity pockets Structure remains bearish in the short term, but momentum hints at a possible rotation higher if we see dollar to reclaim lower levels, lets see what next week brings to us
This has been an incredible trading week — multiple clean plays across majors and BTC delivering textbook structure. Now comes the patience phase. Let price confirm before adding exposure.
#BTC #Bitcoin #Crypto #SmartMoney #CORE5TRADECRAFT #MarketStructure #OrderFlow #TradingView

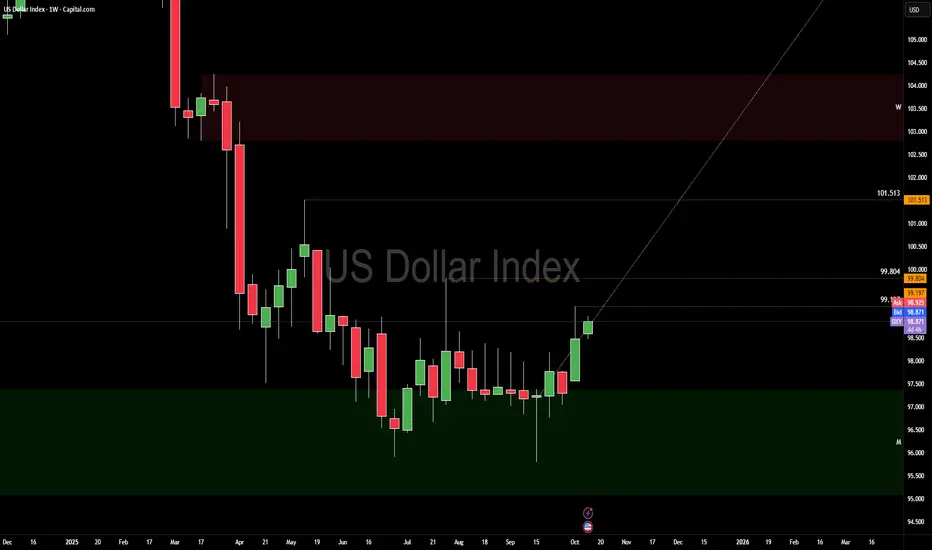
US Dollar RECAPDollar Index (DXY) — Range Heat Building
You’ve got a weekly bearish range, with a key high at 99.8 and price now trading into bearish distribution around 99.0.
The dollar’s been front and center this week — while Washington argues over funding, it’s been doing real damage across cross-asset charts.
Price has been printing higher lows all week, grinding inside this bearish range.
That’s your profit-taking zone, not an add-on zone.
Stay patient. Let the range speak.

BITCOIN IDEA
Bitcoin is still stuck in a sideways range.
KEY level bullish is at 122,300, and right now price isfilling orders near 121,183 daily cap.
That means we’re kind of in the middle — not super strong, not super weak.
The daily trend is still up, but price is pulling back a bit to fill orders.
If Bitcoin starts dropping, 118,543 is the next big level to watch.
If it holds and bounces, we might see another push higher.
If it breaks, we could fall deeper into that lower area.
The U.S. dollar is strong this week → makes it harder for BTC to move up.
Jack Dorsey (the Twitter guy) just dropped a new Bitcoin wallet — cool for long-term use.
So for now: stay patient, watch 121K and 118K zones, and don’t chase candles.

US DOLLAR TARGETS HITThe U.S. government is still shut down, so no fresh economic data is coming out. That means everyone’s trading half-blind right now—no jobs numbers, no inflation updates, just noise. But the chart still tells the truth. All the bullish dollar targets were hit exactly as planned, and now price is sitting right under that 99.8 key high. That’s the line that decides everything. If market makers push price higher than 99.8, the bullish phase stays alive a bit longer. If it fails there, we drop back into bearish discount territory, where value sits lower and sellers regain control.
Over the past four months, liquidity’s been building above those highs. Now we’re watching a classic stop run—price pushing up to take out weak hands before the real move begins. That’s why cross markets like stocks, gold, and crypto are slipping. The dollar’s acting as a safe spot while everything else bleeds. But the volume looks thin, which usually means manipulation, not genuine demand.
Without the usual USD data, it’s all a guessing game until the Fed minutes drop later today. For now, it’s simple: the 99.8 zone is the make-or-break level. Stay patient, read the structure, and let the chart talk. Price always moves to where orders are missing, and stops where they’re full. Follow that rule, and you’ll never feel lost in the noise.

EUR USD and DOLLAR UPDATE
The Dollar Index (DXY) is grinding through a daily order block and has just pierced 97.882.
Technical
If we close above 97.882, that confirms a break and opens continuation toward higher liquidity zones. With tomorrow’s heavy macro news, the setup has volume behind it for a potential massive move.
Macros
U.S. government shutdown is weighing on confidence and trimming growth forecasts (each week may shave 0.1–0.2pp off GDP).
The Fed remains cornered — markets price in rate cuts, but policy credibility is under scrutiny.
Safe-haven flows are mixed: gold at records, dollar stabilizing after Supreme Court support for Fed’s Cook.
Data releases are being delayed by the shutdown, which adds uncertainty and volatility.
EURUSD
We’re short and holding.
4-month rangebound structure remains
Be aware
Dollar strength is being fueled by technical break + macro volume. EURUSD is vulnerable if DXY confirms above 97.882.
But with policy risk and shutdown uncertainty, expect volatility spikes and liquidity hunts around tomorrow’s big data.

BTC vs USD: Macro Liquidity vs TechnicalsBitcoin is at a hinge point.
Technical View: Weekly volume profile looks bearish, but if BTC closes above 119,465.52 the setup flips into an explosive breakout.
Macro View: The dollar is boxed (96.7–98.3) and fiscal stress + Fed cut bets are weighing on USD. Gold is at record highs on safe-haven demand. In this environment, macro liquidity can override technical ceilings.
That’s why I’ve stepped back to scalping until the macro picture stabilizes. The market is running on liquidity hunts, not clean structure.
🔑 Levels to Watch
BTC: Weekly close >119,465.52 → ignition higher
DXY: Breakout from 96.7–98.3 range decides cross-asset direction
When macros dominate, technicals bend. Patience and risk control matter more than chart perfection here.

BITCOIN USD UPDATE🚀 “117,998.17” — We Hit the Trigger
We pierced a massive rally threshold today (117,998.17) — a short squeeze or momentum flush — yet dollar and gold remain locked in ranges. That dissonance tells you this is a liquidity-game market, not a clean trend.
We’re still trading in what I’d call an overpriced arena — volatility amplified, direction masked. Price action will mislead until a big macro break comes.
The dollar remains boxed: Value Area High ~98.322 / Low ~96.747. Gold, meantime, is ripping higher under safe-haven flows, hitting record highs amid shutdown fears and rate cut bets.
Meanwhile, bitcoin is getting a bullish tailwind. Whale accumulation, institutional demand, and macro narratives favoring digital gold are pushing sentiment.
Macro catalysts (Fed, U.S. jobs, fiscal politics) could fuel either direction — but the setup is leaning toward asymmetric upside in risk assets if USD weakens.
LOOK OUT:
Liquidity hunts likely before clarity — expect fake-outs.
Dollar must break its box for cross-pairs and cryptos to trend.
Bitcoin is better aligned with the upside in this regime than dollar or gold.

US DOLLAR LIQUIDITY GAMES🇺🇸 US Dollar Range Politics – Liquidity Before Clarity
The dollar isn’t trending — it’s negotiating.
📊 Current Setup
U.S. Dollar Index (DXY): 98.322 → testing the value area high
Range Floor: 96.747 → the value area low
Structure: Bearish range, with liquidity being hunted before any true direction emerges.
🏛️ Macro Backdrop
Tariffs are reshaping global flows.
Fiscal gridlock + shutdown risk clouds investor confidence.
Inflation + Fed policy signals remain mixed.
Every headline feels like an amendment to a bill no one fully understands.
The result: the dollar drifts sideways in a liquidity-seeking phase. Traders should expect chop inside the box until a decisive catalyst (data, Fed action, or policy shift) provides clarity.
🌍 Cross Pair Impact
This stalemate spills into the majors:
EURUSD & GBPUSD → reflecting the same sideways ranges and fake-outs.
USDJPY → volatility compressed, waiting for dollar direction.
Crosses are trading in sympathy — liquidity hunts on both ends, with no clean trend until DXY escapes its range.
🧭 Takeaway: The dollar is boxed in by politics and policy. Patience rules here: trade the range, wait for the breakout.

Bitcoin Chart Marks Its 2 Big Next Stops: $105K → $98KBitcoin has spent three months consolidating near record highs.
That kind of sideways grind usually ends with a liquidity hunt.
If the dollar finishes its current swing higher, Bitcoin likely tags the mid-range support zone next.
Two major downside targets remain on the map for the coming months.
Probability of a flush lower sits around ~80%
It’s a normal structural move: after heavy consolidation, price seeks liquidity before the next sustained leg.
Dollar drifts lower as U.S. growth stays hot—Q2 GDP +3.8% and a government-shutdown risk on deck.
Bitcoin presses $111K–112K resistance while whales quietly accumulate after recent liquidation spikes.
Price is at the hinge: soft USD supports risk, but volatility is loaded.
Trade the structure, not the noise.

BTC USD PLAN
Bitcoin’s chart is one thing, but the bigger story is what’s driving the money behind it.
The Fed & Yields
The Federal Reserve is still the invisible hand. Every surprise in rates—whether a hotter inflation print or a sudden hint of deeper cuts—moves global risk appetite.
Lower real yields = cheaper capital = stronger bid for assets like BTC.
A hawkish turn does the opposite.
Institutional Flow
Big money isn’t just buying dips—it’s writing new rules.
Case in point: asset manager Strive is set to acquire about 5,800 BTC (≈ $675 million) through a corporate deal.
Moves like this tighten available supply and add a slow, steady demand base.
Bitcoin Technical View
This week’s candle is shaping up bearish, and Monday will tell us if today’s Sunday session finishes the job.
If the market doesn’t fill that daily gap, we’ll be watching Monday’s open closely.
Right now the daily range runs from 113,999 down to 108,644.
If the dollar pushes into higher liquidity zones, Bitcoin could feel the pressure and drift lower.
The plan is simple: wait for a clear shift on the smaller time frames before making any move and calculate risk from there.
Patience matters more than bravado—let the market come to you.
For now, the setup still looks constructive, but it only pays to act when the levels confirm.
Trade small, stay calm, and protect your capital first.

US Dollar Flexes, Look For on 99.05Sunday War Map –
A weekly candle this strong leaves a mark. The dollar printed a 96.77 low to 98.18 high—a full-bodied bullish bar that demands respect.
Macro
This week is stacked with U.S. data that can shake the pullback narrative:
Tue 30 Sep – JOLTS & Consumer Confidence: first look at hiring demand and household mood.
Wed 1 Oct – ISM Manufacturing PMI: factory pulse and price pressures.
Thu 2 Oct – Durable Goods & Trade Data: capital-expenditure clues.
Fri 3 Oct – Non-Farm Payrolls & Hourly Earnings: the heavyweight. A hot jobs print could delay the December Fed-cut story (futures still price ~70% odds).
Technical Targets
Expect an early-week pullback as traders digest that massive weekly bar.
Two liquidity pools we’ve tracked for months were cleared last week; two upside targets still in play 98.2 and 98.3 remain before the chart reaches a true “bearish-range discount.”
Keep eyes on the 99.05 volume node—a well-defined supply zone where cross-market reactions (EUR, gold, crypto) could spike.
The dollar controls the tempo. Wait for the market to come to your levels; don’t chase the last candle.

EUR/USD Mid-Range HoldThis week’s price action has done its job
Two recent highs were taken out after the massive bull-back we mapped.
First targets on the cross pairs are still open, so I’m standing by into the weekend—no new adds here.
Right now EUR/USD sits mid-range.
Bias remains lower if the dollar keeps its bid, but I’ll let next week’s closes confirm.
Fresh Brookings research this week tied the dollar’s safe-haven status directly to U.S. trade policy.
Even with the tariff drama earlier this year, current rates (≈17–18%) stay well below the 26% “tipping point,” leaving the us dollar reserve role intact.
Fed Chair Powell’s recent remark that U.S. equities are “fairly highly valued” only adds to the cautious tone that supports the dollar.
Next Week’s Data to Watch
Tue – U.S. Consumer Confidence
Wed – Eurozone CPI Flash
Thu – U.S. Q2 GDP Final
Fri – U.S. PCE Price Index & Personal Income/Spending
Stronger U.S. numbers here would reinforce the dollar’s strength and keep pressure on EUR/USD.
