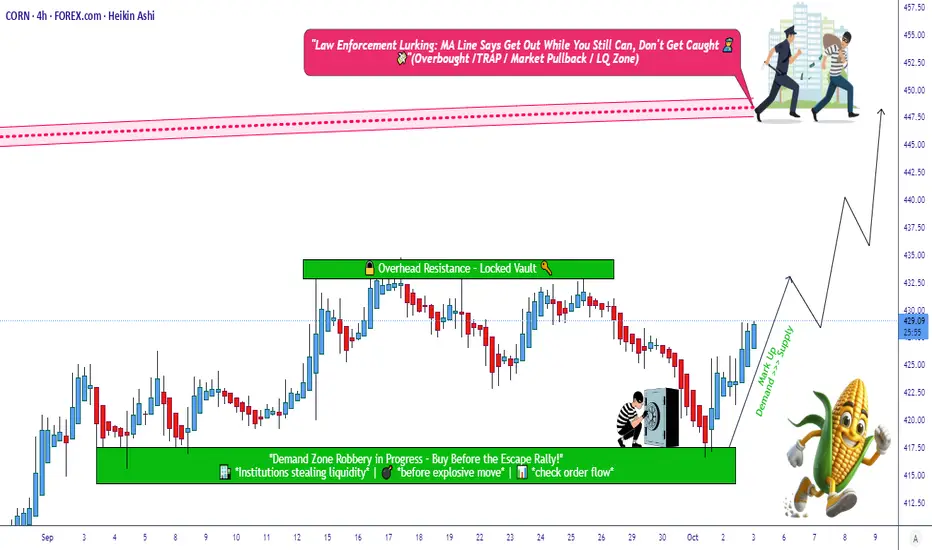
Corn Agro Market Strategy Map – Bullish Path Ahead!🚜🌽 CORN Agro Commodities Wealth Strategy Map (Swing/Day Trade)
📌 Plan: Bullish (Swing + Day Trade Setup)
✅ Market sentiment favors bullish bias in CORN.
🎯 Swing/Day traders can look for upside continuation until resistance zones.
🎯 Entry Plan (Layering Style Method)
🔑 You can enter at any price, but pullbacks are safer.
Layered Buy Limit Orders (multi-entry strategy):
🟢 417
🟢 420
🟢 422
🟢 425
🟢 427
📌 You can extend or add more layers depending on your personal risk appetite.
🛡️ Stop Loss (Protective Exit)
🚨 Thief SL is placed at 415.
📝 Note: This is my personal style. You can set your own SL depending on your strategy & risk comfort.
🎯 Target Levels (Profit Booking)
🏁 447 → Suggested take-profit zone.
🚔 450 = “Police Barricade” → Acts as a strong resistance + potential trap + overbought zone.
💡 Best practice: Exit at 447 before the heavy resistance wall to lock in profits.
🗣️ Important Note for Readers (Thief OG’s 🕶️)
🙏 This is not financial advice.
⚡ You are free to set your own TP/SL.
📌 I share my strategy map — you manage your own risk.
🏦 Market is open to everyone → take profits in your own style, at your own risk.
🔍 Key Insights & Market Correlations
🌾 Agro Commodity Correlations:
CORN often moves in relation to CAPITALCOM:WHEAT and $SOYBEAN.
Soft commodities like PEPPERSTONE:COFFEE can also reflect agro market sentiment.
💵 Currency Link (Dollar Impact):
TVC:DXY (US Dollar Index) plays a key role.
Stronger dollar = bearish pressure on commodities.
📈 Indices & Risk Sentiment:
Global equities ( CAPITALCOM:US30 , SP:SPX , NASDAQ:NDX ) indirectly influence commodities via sentiment.
⚡ Energy Connection:
NSE:OIL & FX:NGAS affect input costs → higher energy = higher agro costs.
Farmers & supply chains react, impacting commodity pricing.
📊 Related Pairs to Watch
🌽 CAPITALCOM:CORN
🌾 CAPITALCOM:WHEAT
CAPITALCOM:SOYBEAN
☕ PEPPERSTONE:COFFEE
🛢️ NSE:OIL
💵 TVC:DXY
📊 CAPITALCOM:US30 / SP:SPX / NASDAQ:NDX
✨ “If you find value in my analysis, a 👍 and 🚀 boost is much appreciated — it helps me share more setups with the community!”
⚠️ Disclaimer: This is a thief-style trading strategy, designed for fun and community sharing. Not financial advice. Please trade responsibly and at your own risk.
#CORN #AgroCommodities #SwingTrade #DayTrading #TradingStrategy #LayeringStrategy #MarketAnalysis #WHEAT #SOYBEAN #COFFEE #DXY #US30 #SPX #Commodities
Cornforecast
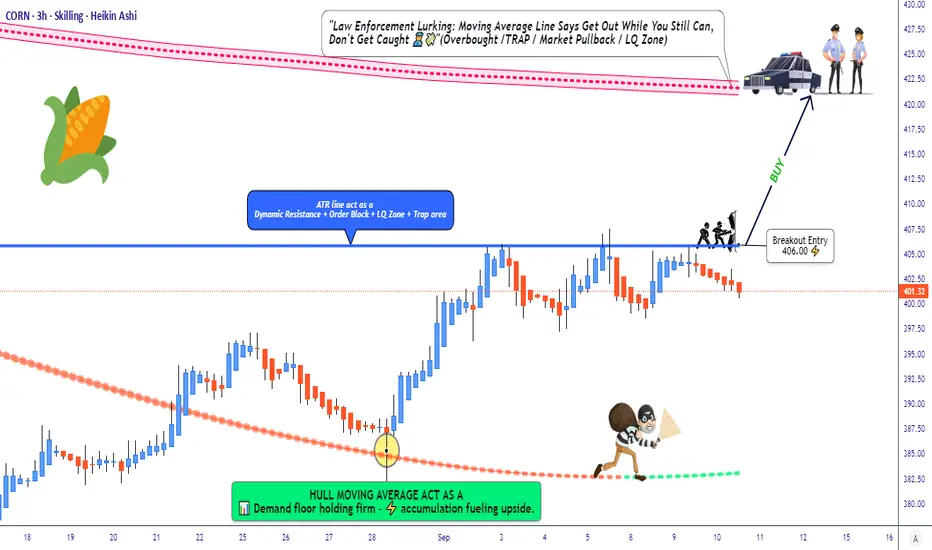
CORN Setup: Is This The Bullish Breakout We've Been Waiting For?🌽 CORN CFD | Money Heist Plan 🎭 (Swing / Day Trade)
🔑 Trading Plan (Thief Style Strategy)
Entry (Breakout Trigger): 📈 406.00 — when candle breaks ATR resistance, bullish plan activates.
Layering Entries (Thief Method):
Buy Limit Layers: 400.0 | 402.0 | 405.0 | 407.0 | 410.0 (flexible — adjust/add more based on breakout confirmation).
Layering helps manage entries & average position smartly.
Stop Loss (Thief’s Safety Lock): @ 395.00 🛑 after breakout trigger.
⚠️ Adjust SL based on your own risk tolerance.
Target (Escape Point): 🎯 421.00
Resistance zone + overbought condition = “police barricade” (take profits before getting trapped).
🌍 Why This Plan? | Thief Technical + Macro/Fundamental Mix
📊 Technical Edge
ATR breakout level at 406.00 ⚡
Momentum build-up near resistance, potential squeeze if volume spikes.
Layered entries provide risk-managed exposure.
🌽 CORN Market Data (10 Sep 2025)
Daily Change: -1.05% 🔴
Monthly Performance: +3.13% 🟢
Yearly Performance: -1.90% 🔴
👥 Investor Sentiment
Retail: 45% Long 😊 | 55% Short 😟 (slightly bearish bias).
Institutions: Net short 91,487 contracts 🏦 (hedging against oversupply).
😨 Fear & Greed Index
Score: 51/100 (Neutral 😐)
Balance between fear (supply risks) vs greed (demand resilience).
📉 Fundamentals & Macro Score
Supply Side
Record US production: 16.7B bushels 🟢
Brazil’s harvest adds oversupply pressure 🔴
Crop diseases (Tar Spot & Southern Rust) hurting yields 🔴
Demand Side
Exports YTD: +46.8% 🌍
Ethanol production: 1.105M barrels/day ⛽ (+30k WoW) 🟢
Tariff risks (China/Mexico) could slow trade 🔴
Macro Score: 6/10 → Moderately Bullish
🎯 Market Outlook Summary
Bull Case (Long) ✅
Strong exports (+28.6% YTD)
Biofuel/ethanol demand supporting floor
Technical rebound chances
Bear Case (Short) ❌
Record harvests (US/Brazil/Ukraine) = oversupply
Institutions scaling up shorts
Global glut risks
📌 Outlook Bias: Bearish-to-Neutral 🐻⚖️
Short-term pressure from supply glut, but demand stabilizes downside.
📌 Key Takeaways for Traders
Breakout Watch: 406.00 🚨
Layered Entry: Manage risk via staggered buys.
Target Zone: 421.00 (book profits before trap).
Macro Mix: Demand solid but supply risks dominate.
Watch List: CAPITALCOM:CORN , CBOT:ZS1! (Soybeans), CBOT:ZW1! (Wheat), CBOT:ZC1! (Corn Futures)
🔗 Pairs to Watch (in USD)
AMEX:SOYB (Soybeans CFD): Moves in lockstep with CORN due to shared ag trends.
AMEX:WEAT (Wheat CFD): Grains often trend together—keep an eye out!
TVC:USOIL : Influences ethanol demand, impacting CORN indirectly.
TVC:DXY (US Dollar Index): A rising USD could pressure commodity prices.
✨ “If you find value in my analysis, a 👍 and 🚀 boost is much appreciated — it helps me share more setups with the community!”
#CORN #Commodities #SwingTrade #DayTrade #ThiefStrategy #MoneyHeistPlan #Futures #LayeringStrategy #BreakoutTrading #Agriculture #Ethanol #TradingCommunity
crypto is crypto, but do you need to buy corn? - If the trend line breaks, this is the beginning of a bullish trend.
- a Formulated is Golden Cross Moving Average
- the reason for the rise in corn prices is the decrease in the EU corn harvest in 2024/25. This is the third consecutive year of poor harvest.
If you have anything to add, please write in the comments.

CORNFinal Big move to the upside before a possible correction, Using Elliot wave methodology and other indicators a strong move to the upside to complete trade cycle is to be expected.

CORN LONG - Buy Entry - H4 ChartCORN LONG - Buy Entry - H4 Chart
Buy @ Market
Symbol: CORN
Timeframe: H4
Type: BUY
Entry Price: Buy @ Market
TP - BE - Resistance @ 774.91
TP - Resistance @ 802.92
Support @ 732.56

CORN FUTURES (ZC1!) WeeklyDates in the future with the greatest probability for a price high or price low.
The Djinn Predictive Indicators are simple mathematical equations. Once an equation is given to Siri the algorithm provides the future price swing date. Djinn Indicators work on all charts, for any asset category and in all time frames. Occasionally a Djinn Predictive Indicator will miss its prediction date by one candlestick. If multiple Djinn prediction dates are missed and are plowed through by same color Henikin Ashi candles the asset is being "reset". The "reset" is complete when Henikin Ashi candles are back in sync with Djinn price high or low prediction dates.
One way the Djinn Indicator is used to enter and exit trades:
For best results trade in the direction of the trend.
The Linear Regression channel is used to determine trend direction. The Linear Regression is set at 2 -2 30.
When a green Henikin Ashi candle intersects with the linear regression upper deviation line (green line) and both indicators intersect with a Djinn prediction date a sell is triggered.
When a red Henikin Ashi candle intersects with the linear regression lower deviation line (red line) and both indicators intersect with a Djinn prediction date a buy is triggered.
This trading strategy works on daily, weekly and Monthly Djinn Predictive charts.
This is not trading advice. Trade at your own risk.
