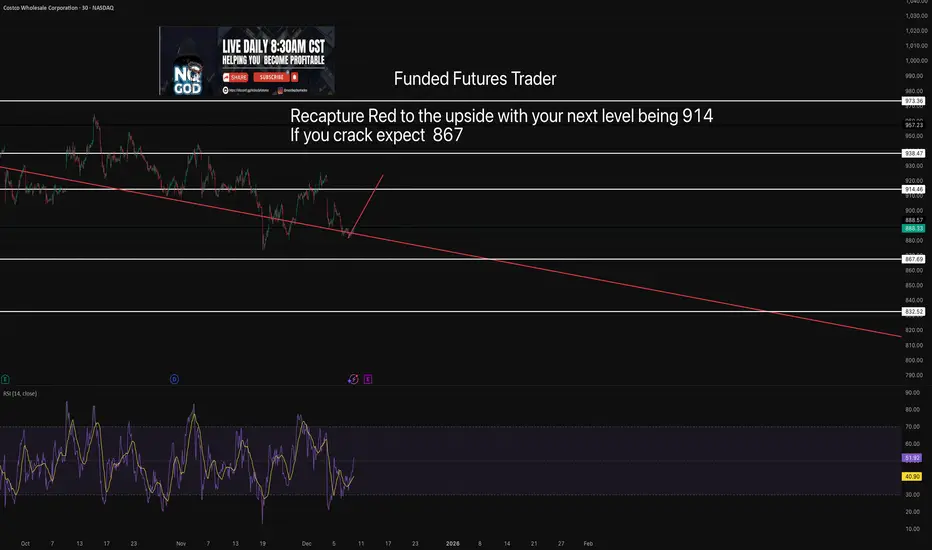
Costco Levels with TAPretty clear recapture red and youll grind to the upside if you don't you have your red to the downside which is a magent.
Costco
COSTCO may be the most durable choice in this Bear Cycle.Costco (COST) has been trading within a 17-year Channel Up ever since the 2008 Housing Crisis. Since its June 2025 High, it has been on a steady decline, contrary to the big gains of other high cap stocks (mainly tech).
During this decline, it has broken below its 1W MA50 (blue trend-line), which has been the main Support of the Bull Cycle since May 2023, confirming its Bear Cycle.
However, it just hit its 1W MA100 (green trend-line), a critical level as it is the one that not only formed the bottom of the 2022 Bear Cycle but has also been holding since September 2017, providing numerous excellent buy entry opportunities.
With the 1M RSI also approaching its 9-year Support Zone, we believe that Costco may be one of the most durable stock investment choices during the upcoming Bear Cycle on stock indices. The Sine Waves are laying out a rather solid mapping of key market top formation periods long-term and we are currently far from one.
The 17-year Channel Up is currently on its 3rd major Bullish Leg and remarkably enough the previous two both rose by the exact same percentage, 347.16%. If the current Bullish Leg repeats that from its 2022 bottom, then we can expect this stock to reach $1800 around 2028.
---
** Please LIKE 👍, FOLLOW ✅, SHARE 🙌 and COMMENT ✍ if you enjoy this idea! Also share your ideas and charts in the comments section below! This is best way to keep it relevant, support us, keep the content here free and allow the idea to reach as many people as possible. **
---
💸💸💸💸💸💸
👇 👇 👇 👇 👇 👇

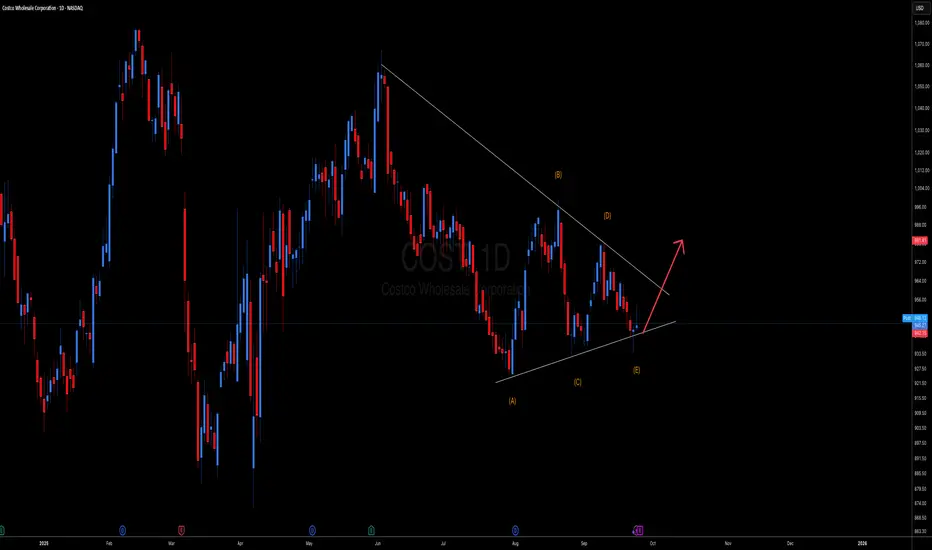
COST on the move soon ?!!! Cost completed a wave 4 triangle since the ath .. now a 100+ move is expected once the triangle breaks .

Costco bullish triangle pattern break outCostco bullish triangle pattern break out. Costco earnings will complete triangle pattern
COST Costco Wholesale Corporation Options Ahead of EarningsIf you haven`t bought COST before the rally:
Now analyzing the options chain of COST Costco prior to the earnings report this week,
I would consider purchasing the 970usd strike price Calls with
an expiration date of 2025-9-19,
for a premium of approximately $8.85.
If these options prove to be profitable prior to the earnings release, I would sell at least half of them.
Disclosure: I am part of Trade Nation's Influencer program and receive a monthly fee for using their TradingView charts in my analysis.

COSTCO Looking for a bottom to fuel rally to $1250.Last time we looked at Costco (COST) was 6 months ago (January 21) when we gave the most optimal buy signal exactly at the bottom of the Channel Up at the time, easily hitting our $1045 Target:
Since then, the stock has entered a new Accumulation Phase in the form of a Triangle and this week broke below its 1W MA50 (blue trend-line), which is where its previous bottom (Higher Low) was formed.
The last similar Triangle pattern was formed straight after the May 16 2022 market bottom and once it broke upwards it led to a massive rally. Even the 1W RSI sequences between the two fractals are similar.
Our Target is $1250, just below the 1.786 Fibonacci extension.
-------------------------------------------------------------------------------
** Please LIKE 👍, FOLLOW ✅, SHARE 🙌 and COMMENT ✍ if you enjoy this idea! Also share your ideas and charts in the comments section below! This is best way to keep it relevant, support us, keep the content here free and allow the idea to reach as many people as possible. **
-------------------------------------------------------------------------------
💸💸💸💸💸💸
👇 👇 👇 👇 👇 👇

$COST earnings short, possible uptrend selloff(Sorry for mobile charts/posts)
NASDAQ:COST Hello, looking at multiple time frames on Costco I am going to take a stab at a short. This name isn’t unfamiliar with big moves so an 8% to 10% move could take place here on earnings forecast. Granted, they could not divulge any details but I think that wouldn’t be good and amidst the tariff rhetoric which has been the narrative for retail names could add headwind. 6/6 $900p is what I will take a stab at. 1 contract will suffice as there could be a good R/R especially if you hedge. If you look at the Monthly chart this thing is bought up heavily. I am going to try and get a good entry so I’m not risking what I may feel is too much on an earnings “lotto.” $100-$150 on a contract will be good in my book.
WSL

COST Costco Wholesale Corporation Options Ahead of EarningsIf you haven`t bought COST before the rally:
Now analyzing the options chain of COST Costco prior to the earnings report this week,
I would consider purchasing the 800usd strike price Puts with
an expiration date of 2027-1-15,
for a premium of approximately $42
If these options prove to be profitable prior to the earnings release, I would sell at least half of them.

COSTCO: 4 touches/rejections. Can we pop over gap?Costco looks loaded.
4 touches along the resistance, looks like a big wedge forming. Next touch can be a break out to upside, fill gap and move with momentum upside.
OR
Green ray for the entry to downside. We got data tomorrow as well..
Do your DD! Not FA but let me know what you think!

$COST Getting TiiightCostco has been bouncing between these trendlines the past couple of days. I'm expecting a big move in either direction soon, but right now its 50/50. My lean on the longer time frame is to complete the H&S on the daily chart to the downside after potentially trying to fill the gap at 1020.

COSTCO: Massive rebound on the 1W MA50 can go for +45% profit.Costco has just turned bullish on its 1D technical outlook (RSI = 56.966, MACD = -6.590, ADX = 35.211) as it's on the 3rd straight green week ever since it touched and held the 1W MA50. This rebound, though not an absolute bottom on the 2 year Channel Up, is the new technical bullish wave of the pattern. We've had so far 2 main +45.14% price surges in the past two years. We estimate that to be the 3rd and last up until the end of the year. Go long, TP = 1,270.
See how our prior idea has worked out:
## If you like our free content follow our profile to get more daily ideas. ##
## Comments and likes are greatly appreciated. ##

Breaking: COSTCO Shares Dip 2% In Premarket Amidst Earnings MissCostco Wholesale Corporation (NASDAQ: NASDAQ:COST ), together with its subsidiaries, engages in the operation of membership warehouses in the United States, reported fiscal second-quarter sales that topped analysts’ estimates, but earnings missed as costs rose.
The membership-based retailer saw revenue rise 9% year-over-year to $63.72 billion, above the analyst consensus from Visible Alpha. However, Costco's net income of $1.79 billion, or $4.02 per share, missed expectations, despite rising from a year earlier. The results came as merchandise costs rose 9%.
The period marked the company’s second quarter since its membership fee hike went into effect in September. Revenue from membership fees rose 7% year-over-year to $1.19 billion, though executives previously said they expect the impact on margins to be weighted to the back half of the fiscal year and into fiscal 2026.
Technical Outlook
Shares of Costco slid 1.5% in after-hours trading Thursday following the release extending the lost to premarket trading hours, with the asset down 2.02% in Friday's premarket session.
For Costco shares, the immediate support lies within the 1-month low axis. Should Costco shares face selling pressure the 1-month low should serve as a point of reprieve for Costco shares. With the RSI at 50 a breakout above the 1-month high should spark a bullish reversal for Costco shares respectively.

COST Costco Wholesale Corporation Options Ahead of EarningsIf you haven`t bought COST before the rally:
Now analyzing the options chain and the chart patterns of COST Costco Wholesale Corporation prior to the earnings report this week,
I would consider purchasing the 1030usd strike price Puts with
an expiration date of 2025-3-21,
for a premium of approximately $22.15.
If these options prove to be profitable prior to the earnings release, I would sell at least half of them.

Selling Premium Going into Costco EarningsGiven Costco’s historical tendency for minimal post-earnings stock movement, along with inflated IV in the options market, selling premium via a bear call spread is a high-probability, risk- managed strategy to profit from an expected IV crush and minimal price movement following earnings.
Key Points Supporting the Thesis:
1. Historical Price Movement: Over the past 4 years, Costco’s stock has experienced an average post-earnings price movement of only 1.24%. The majority of moves have been within a modest range of -1% to +2%. This indicates that despite earnings announcements, the stock tends to remain within a predictable price range, minimizing the potential for significant directional price swings.
2. Implied Volatility and Overpricing of Options: Currently, the options market is pricing in a 4.6% move for Costco’s stock post-earnings. Given Costco’s historical price movement patterns, this is an overestimation of potential volatility. IV tends to collapse after earnings announcements.
3. Costco’s High Valuation: Costco is currently trading at a P/E ratio of 61, which is significantly higher than historical levels. This suggests that the stock is already expensive relative to its
earnings potential, making it less likely to experience a massive upward movement after earnings. The high valuation also means that even strong earnings may not drive significant upside, further increasing the likelihood of a muted post-earnings reaction.
4. Earnings Catalysts and Market Behavior: Costco’s earnings reports historically have had limited impact on the stock’s price due to the company’s stable revenue and earnings growth.
Investors have already priced in much of the growth potential, leading to minimal surprise reactions to earnings releases. The combination of low historical price movement and high IV makes this a prime environment for selling premium, as the likelihood of large moves is low, while option prices remain high.

Costco Wholesale: Robust Earnings Support Bullish Trend◉ Technical Observation
● The stock price is exhibiting a strong uptrend, moving within an ascending parallel channel.
● A recent breakout from a rounding bottom pattern has propelled the price higher, nearing the upper boundary of the channel.
◉ Two Possible Scenarios
1. Rejection and Pullback: The price may face resistance at the upper end of the channel, leading to a potential decline.
2. Breakout and Continuation: Alternatively, the price may break through the upper boundary, sustaining the uptrend and driving the stock higher.
◉ Q1 FY25 Result Highlights
● Net Income: Up 13.1% to $1.79 billion, compared to $1.58 billion in Q1 FY24.
● Comparable Sales: Increased by 5.2% in the US and 5.8% in Canada.
● E-commerce: Comparable sales soared by 13%, with adjusted e-commerce comparable sales rising to 13.2%.
● Membership Revenue: Grew by 7.8% to $1.166 billion, reflecting strong customer loyalty.
● Gross Margin: Improved by 24 basis points to 11.28%.

COST, Short, 4h✅ COST is overbought and is pulling back to retest the key support at 1007.80 before determining its next move.
SHORT 🔥
✅ Like and subscribe to never miss a new analysis! ✅

After-Hours Update: COST 50% Retracement Break-Up?COST has been trading below it's most recent 200 Candles right around the $951.64 Price Level, currently consolidating and presenting an additional opportunity to get around that lower trend level (Bottom Purple) to ride this into the year.
With the planned Tariffs, we plan for that to be handed down to the consumer ultimately, causing a potential continued rise in Consumer Goods through it's Cyclical Rotation throughout 2025. Getting into things like COST, WMT, TGT and KR (which we reported on yesterday) could provide some great performance in a longer-term hold and nice returns along the way.
Let's see what #2025 has to bring to the table! Otherwise, connect with us everywhere you are in the meantime by visiting our website to access more of our Premium Personal Budgeting & Investment Portfolio Management Solutions to get started investing, as well as, optimize your potential for a better financial future at @MyMIWallet!

COSTCO: Correction phase may be coming to an END!! Costco Wholesale is an international chain of hypermarkets with a Price Club format whose objective is to provide the best prices on quality products.
At Costco you can find a large selection of exclusive products, including hospitality products, confectionery, household appliances, television, car parts, tires, toys, electronic devices, sports items, jewelry, watches, cameras, audiovisual, books, household products, health, beauty, furniture, equipment and office products... all with the best quality.
It has large stores in the United States, Puerto Rico, Canada, Mexico, Taiwan, Korea, Japan, the United Kingdom, Australia, Spain, France, Iceland and China.
--> What is the technical aspect?
If we look at the chart, the technical aspect is impeccable bullish in a retracement phase, but the retracement phase may be coming to an END!!.
After making a strong retracement overcoming the 61.8% Fibonacci zone, on January 7 the price gave us the first bullish warning (Bull). The next one to warn us of bullish strength (Bull) was the oscillator on January 13, and finally, yesterday, the FORCE aligned with the TREND and the MOMENTUM (see table), leaving everything bullish (Bull) ready to attack highs.
--> What do we need to attack highs?
That it overcomes its last important resistance which is the 963 area.
-------------------------------------
Strategy to follow:
ENTRY: We will open 2 long positions if the H4 candle closes above 963
POSITION 1 (TP1): We close the first position in the 999 area (+4%)
--> Stop Loss at 899 (-6.2%).
POSITION 2 (TP2): We open a Trailing Stop type position.
--> Initial dynamic Stop Loss at (-6.2%) (coinciding with the 899 of position 1).
---We modify the dynamic Stop Loss to (-1%) when the price reaches TP1 (999).
-------------------------------------------
SET UP EXPLANATIONS
*** How do we know which 2 long positions to open? Let's take an example: If we want to invest 2,000 euros in the stock, what we do is divide that amount by 2, and instead of opening 1 position of 2,000, we will open 2 positions of 1,000 each.
*** What is a Trailing Stop? A Trailing Stop allows a trade to continue gaining value when the market price moves in a favorable direction, but automatically closes the trade if the market price suddenly moves in an unfavorable direction by a certain distance. That certain distance is the dynamic Stop Loss.
-->Example: If the dynamic Stop Loss is at -1%, it means that if the price drops by -1%, the position will be closed. If the price rises, the Stop Loss also rises to maintain that -1% in the rises, therefore, the risk is increasingly lower until the position becomes profitable. In this way, very solid and stable price trends can be taken advantage of, maximizing profits.

COSTCO New uptrend about to begin.Costco (COST) gave us the most optimal buy signal on our previous analysis (October 07 2024, see chart below) right at the bottom of the Channel Up, and easily hit our 1000 Target:
Yet again, we are ahead of a strong bullish break-out and the only Resistance level that remains is the 1D MA50 (blue trend-line). The 1D RSI has already given a buy signal right on its oversold barrier (30.00) on January 02 2025.
Once the 1D MA50 breaks, we will have a confirmed break-out buy signal. The previous tree Bullish Legs have been of at least +16.08%, so our new Target as of today is 1045.
-------------------------------------------------------------------------------
** Please LIKE 👍, FOLLOW ✅, SHARE 🙌 and COMMENT ✍ if you enjoy this idea! Also share your ideas and charts in the comments section below! This is best way to keep it relevant, support us, keep the content here free and allow the idea to reach as many people as possible. **
-------------------------------------------------------------------------------
💸💸💸💸💸💸
👇 👇 👇 👇 👇 👇

Correction to $850-920 essential for keeping the uptrend healthy- Price is overextended and investors are treating NASDAQ:COST as the growth stock than a safe quality stock. Price/Earnings ratio is around 60 which his historical high on the other hand the company is growing single digits.
- With wage growth stalling and with uncertain macro, it's unlikely that majority of people will stock groceries for a month in advanced. Many folks are shopping weekly/bi-weekly from Walmart instead.

COSTCO 850 AFTER EARNIGS ?? 5 STRONG REASONS WHY !!!
thanks to
WWW.CAFECITYSTUDIO.COM
NY RUNS GLOBAL INC .
Robust Financials:Costco has consistently demonstrated strong financial performance. Its revenue growth, profitability, and debt management are impressive.
The company’s ESG (Environmental, Social, and Governance) score for its industry is good, indicating responsible business practices .
Customer Loyalty and Resilience:Costco’s loyal customer base contributes to its stability. Even during economic downturns, consumers tend to remain loyal to the brand.
This loyalty makes Costco stock relatively recession-resistant, which is a valuable asset for long-term investors.
Analyst Sentiment:Over the past few months, analysts have revised their average price target for Costco upwards significantly. This suggests positive sentiment and confidence in the company’s future prospects.
There is high visibility into Costco’s activities for the coming years, supporting predictable sales.
Inflationary Pressures:The recent inflationary pressures have positively impacted Costco stock. As the Federal Reserve adjusts its monetary policy, companies like Costco may benefit from higher prices and increased consumer spending.
Valuation Considerations:While Costco’s fundamentals are strong, it’s essential to consider valuation. The company operates with relatively high earnings multiples.
Investors should weigh the potential upside against the current valuation when projecting the stock price.

COST Costco Wholesale Corporation Options Ahead of EarningsIf you haven`t bought the dip on COST:
Now analyzing the options chain and the chart patterns of COST Costco Wholesale Corporation prior to the earnings report this week,
I would consider purchasing the 1020usd strike price Calls with
an expiration date of 2025-1-17,
for a premium of approximately $22.30.
If these options prove to be profitable prior to the earnings release, I would sell at least half of them.

$COST end of trend? Time to go short?NASDAQ:COST looks exhausted here. If you look on the weekly we got a big spike up that then closed under resistance which is usually a pretty good bearish signal.
I think NASDAQ:COST will start it's way down to the ~$400 support levels over the next year (by the end of 2025).
However, I think in the short term it's likely that we'll bounce at $761 or $667 support levels.
Let's see how the move plays out.
