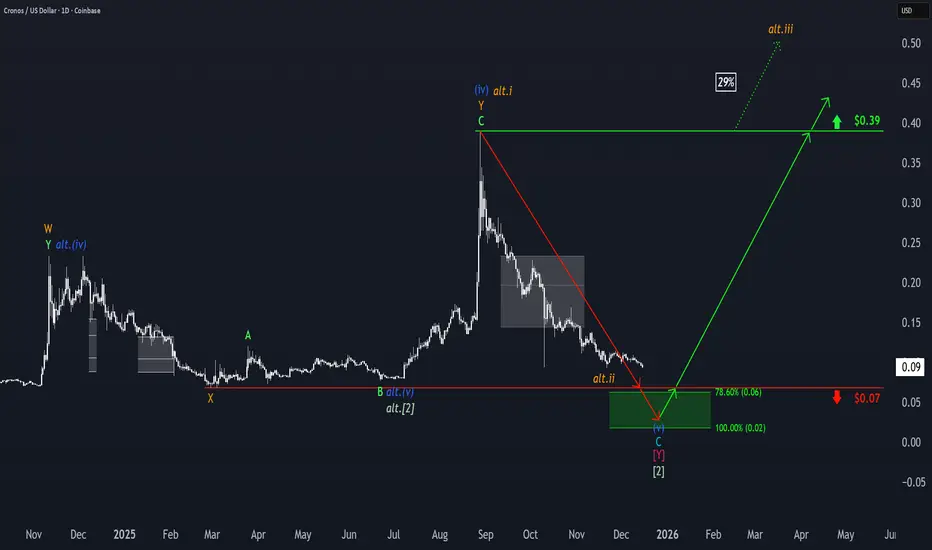
Cronos: Approaching the Target ZoneCrypto.com coin Cronos has continued its move toward the green Target Zone between $0.06 and $0.02. We expect the low of the large wave correction to form within this range. A sustained upward move should only become the main focus once this significant bottom is in place. There is a 29% probability that the low of the green wave alt. has already been reached. If that’s the case, the next step could be a breakout above the resistance at $0.39, rather than a drop below the $0.07 support.
CRO
Cronos (CRO) Weekly Chart Analysis: Back at Cycle Lows Cronos is starting to get interesting again from a higher timeframe perspective. When you zoom out on the weekly chart, CRO has a very clear history of sharp cyclical spikes followed by long periods of flat, compressed price action. These expansions typically happen fast, and the retracements tend to grind slowly back to key baseline levels.
Right now, CRO is sitting almost exactly at that long term equilibrium zone it has returned to multiple times. This is essentially the “cycle floor” where previous moves have bottomed out before major expansions. The dotted level you’re hovering near on the chart represents a multi-year demand zone that has repeatedly acted as a reset point.
A few key observations:
- CRO has shown it can produce explosive moves when liquidity cycles back into the ecosystem.
- It’s currently trading near the bottom of its historical range, a zone where volatility compresses before trend changes.
- Unlike many small caps, CRO has a massive platform behind it (Crypto.com), which means strong branding, user flow, and ongoing development that can continue feeding utility demand.
- The slow bleed back to cycle lows is typical in assets that rely on broader exchange-driven hype cycles rather than pure organic network activity.
This doesn’t imply a breakout is imminent, but structurally this is where smart money tends to at least start paying attention. Price is back at historical value, sentiment is washed out, and the chart is coiled in a multi-year compression phase. If the platform sees growth or renewed marketing pushes in the next cycle, CRO has plenty of room to re-expand.
In short: CRO is back at its long term base, supported by a major ecosystem, and showing the same early conditions that preceded prior upward cycles. This is the zone to watch.

CROUSD - Bullish Megaphone Currently price is trending along the lower line but a fast move could pump price up to the top of this structure, a trend line that has been touched before. This is a megaphone pattern on the Weekly chart for CROUSD.

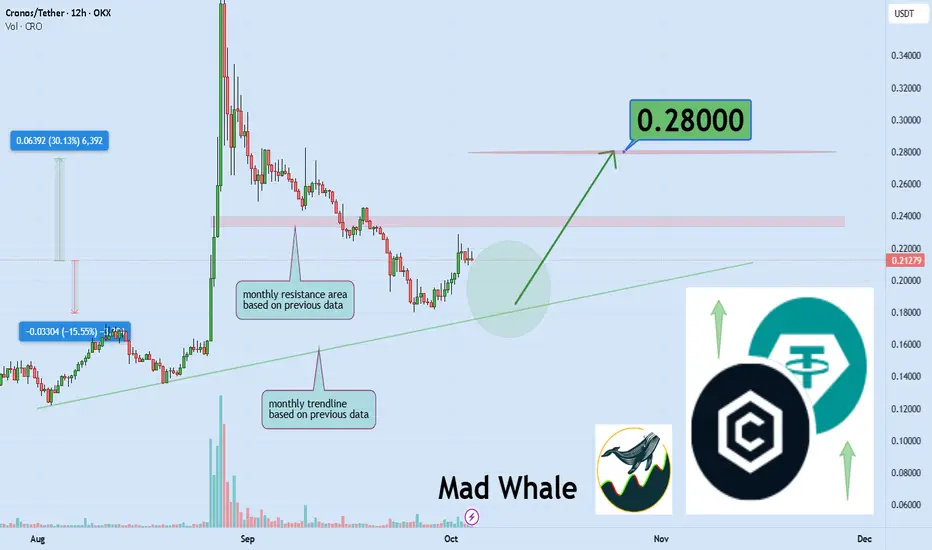
Cronos Approaches Key Trendline, Potential 30% Surge Toward 0.28Hello✌️
Let’s analyze Cronos's price action both technically and fundamentally 📈.
🔍Fundamental analysis:
In simple English:
Morpho’s launch on Cronos could make lending with BTC and ETH easier and boost CRO use for gas and collateral, a good sign for Cronos DeFi growth. 🚀
📊Technical analysis:
OKX:CROUSDT is approaching a crucial monthly trendline, and holding this level while breaking nearby resistance could trigger a potential 30% rally toward $0.28. Traders may watch for confirmation of bullish momentum at these key levels. 📈💎
📈Using My Analysis to Open Your Position:
You can use my fundamental and technical insights along with the chart. The red and green arrows on the left help you set entry, take-profit, and stop-loss levels, serving as clear signals for your trades.⚡️ Also, please review the TradingView disclaimer carefully.🛡
✨We put love into every post!
Your support inspires us 💛 Drop a comment we’d love to hear from you! Thanks, Mad Whale
CRONOS Giant Bull Flag can lead it to 0.85000 just like in 2021.Cronos (CROUSD) has been trading within a Bullish Megaphone through the entirety of its current Bull Cycle. Ahead of its first 1W Golden Cross, the pattern draws many similarities with the Bullish Megaphone of the previous Cycle.
More specifically, it appears we are inside a Bull Flag similar to April - May 2021, which after testing and holding the 1W MA100 (green trend-line), it rebounded and peaked just above the 1.618 Fibonacci extension.
As you can see the Fibonacci structure between the two Megaphones is quite similar, giving high probabilities of a continuation. As a result, as long as the 1W MA00 holds, we expect Cronos to dip some more and then rebound to 0.85000 (Fib 1.618 ext).
-------------------------------------------------------------------------------
** Please LIKE 👍, FOLLOW ✅, SHARE 🙌 and COMMENT ✍ if you enjoy this idea! Also share your ideas and charts in the comments section below! This is best way to keep it relevant, support us, keep the content here free and allow the idea to reach as many people as possible. **
-------------------------------------------------------------------------------
💸💸💸💸💸💸
👇 👇 👇 👇 👇 👇

croI don't know what you want from a symbol that has grown so much that you are looking to enter it now. I showed two areas that each one wants to enter, the green or blue box or the intersection of both, I just wrote the distances and what percentage they are, even if you use lever 2, if you go into loss, you will lose between 40 and 50 percent.

CRO Bullish pennantCRO broke out of bullish pennant. Possible to break down to last resistance. Anyway, my bags are full. Getting nice stake out of it.
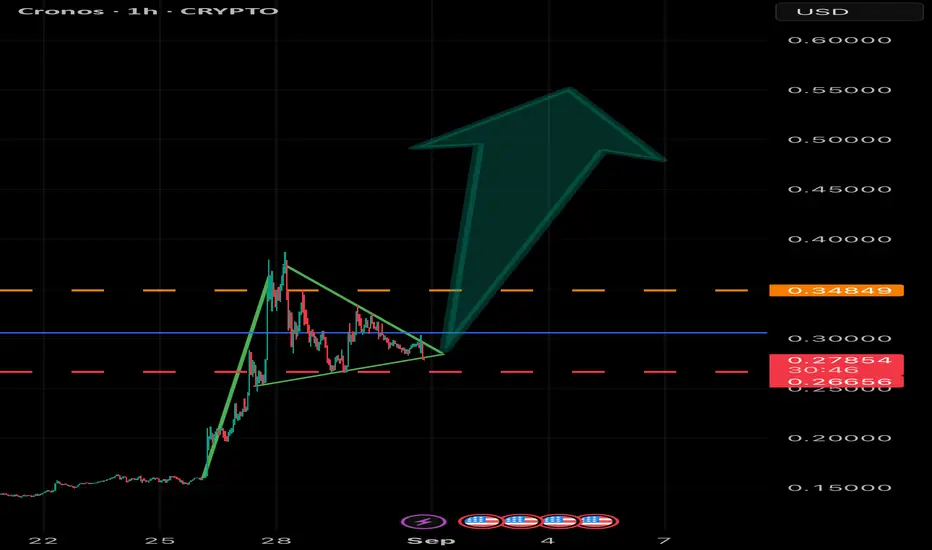
CRO - Bullish Pennant FormationBullish Pennant Analysis for CROUSD (based on provided chart as of late Aug/early Sep 2025):
• Flagpole: Sharp upward surge from ~0.15 to ~0.48 around Aug 28, driven by strong momentum, forming the pattern’s “pole.”
• Consolidation Phase: Post-peak, price enters a symmetrical triangle (pennant) with converging trendlines: declining highs (~0.48 to ~0.30) and rising lows (~0.27 upward), lasting ~1 week on 1H timeframe, indicating temporary pause in uptrend.
• Characteristics: Pattern resembles a small flag/pennant; volume likely decreases (not visible but typical); shorter duration fits bullish continuation criteria.
• Current Status: On Aug 31, 2025, price at ~0.279 is within the pennant, near apex, showing formation but no breakout yet. Down 4.63% suggests consolidation pressure.
• Breakout Signal: Bullish if price breaks upper trendline (~0.35) with rising volume; confirms continuation.
• Price Target: Measure flagpole height (~0.33), add to breakout point; potential target ~0.60-0.68.
• Invalidation: Bearish if breaks lower trendline below ~0.27, signaling reversal.
• Implications: High probability (~70% historically) of upward move if valid; watch for crypto market catalysts like BTC correlation.
Cronos Mega pump incoming! Based on this fractal comparison of Ethereum's cycle to CRO, I expect a mega run on this coin. It’s ready for a vertical move, just like we saw with Ethereum in 2020–2021. Watch for a big-picture breakout and a super moon.
As always, stay profitable,
– Dalin Anderson

$CRO price pumped hard after the big news:🚀 The price of CRYPTOCAP:CRO skyrocketed after major news:
SPAC-company Yorkville Acquisition Corp, TMTG, and Cryptocom signed a final merger agreement.
They are launching Trump Media Group CRO Strategy, Inc. — a new digital asset management firm focusing on acquiring #CRONOS.
💹 Key details:
▪️ Yorkville Acquisition Corp plans to file for listing Class A shares on Nasdaq under ticker MCGA
▪️ Charter capital:
• 6.3B #CRO (~19% of supply) ≈ $1B (avg. price $0.159)
• $200M in fiat
• $220M in warrants
• + $5B credit line
🤔 But here’s the catch…
As the old trader’s saying goes:
"Buy the rumor — sell the news"
OKX:CROUSDT is still far from ATH ($1), but the news already seems to be “priced in”.
So we may see a distribution phase coming… if it hasn’t started yet.
⚖️ And the key point:
the further CRYPTOCAP:CRO price moves from the $0.159 average set in the deal, the less appealing it looks to buy right now.
And next… 👇
🧠 DYOR | This is not financial advice, just thinking out loud.
______________
◆ Follow us ❤️ for daily crypto insights & updates!
🚀 Don’t miss out on important market moves

CRO/USDT 1W Chart📊 Current situation
• Price: ~ 0.2067 USDT (+33% per week).
• Trend: strong Breakout after a long consolidation.
• SMA:
• Short -term (red, ~ 0.1236 and 0.1592) was pierced → confirms the change of trend.
• Green (SMA #2) also below the price → bull signal.
• MacD: heavily growing histogram, MacD line above the signal → growth moment.
• RSI: ~ 70 → enters the purchase zone, but not yet extreme (no divergence).
⸻
📈 levels of support and resistance
• Support:
• 0.1592 (last Breakout Level).
• 0.1236 (strong zone of previous consolidation).
• resistance:
• 0.2347 (nearest resistance).
• 0.3374 (key resistance from higher intervals).
⸻
🧐 Interpretation
• We have a confirmed upward trend - the price has pierced the relegation line (yellow trend line) and the SMA broke.
• Momentum is growing (MacD, RSI, volume).
• However, RSI signals the possibility of short -term correction if the price hit 0.2347.
⸻
🔮 Scenarios
1. Bycza (more likely)
• If we keep it above 0.1592, possible attacks on:
• 0.2347 → Then even 0.3374.
• A good chance of continuing the trend within the average time.
2. Bear (correction)
• a decrease below 0.1592 → correction to 0.1236.
• Only a breakdown 0.1236 will negate the current upward trend.

Crypto.com (CRO)Cro usdt Daily analysis
Time frame daily
Risk rewards ratio >5.3 👈👌
Nothing to say
Chart is clear
Red line is historical support line

CRO Breakout Alert – Red Resistance Cleared! 🚨 GETTEX:CRO Breakout Alert – Red Resistance Cleared! 🔴✅
GETTEX:CRO has successfully broken out of the red resistance zone.
📈 Momentum is in play — next targets in focus:
🎯 First Target → Green line level 1
🎯 Second Target → Green line level 2
Strong breakout confirms buyer control — watching for continuation toward both targets.
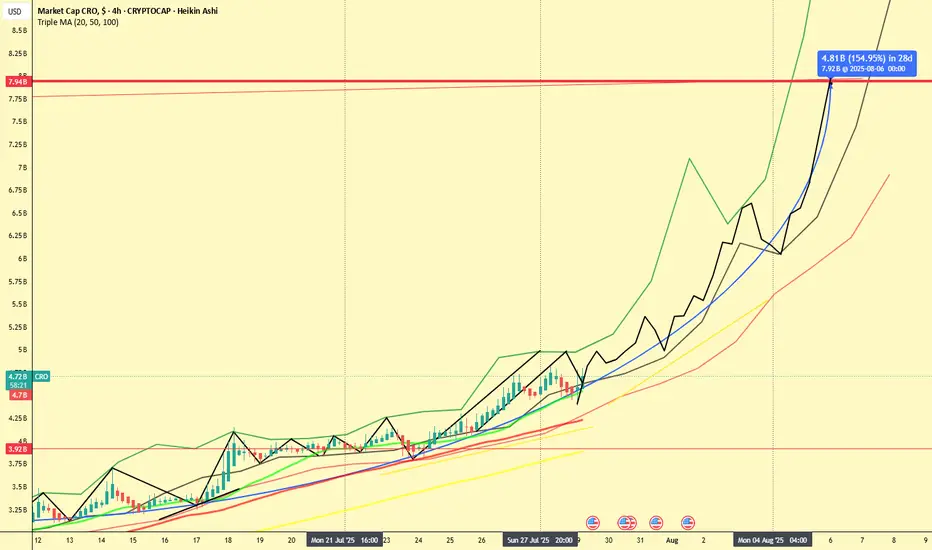
CRO 2x in 7 Days? Chart Hints at Explosive Move!📆 July 29, 2025
📍 CRO Market Cap (4H Heikin Ashi - Historical Projection Analysis)
If this chart doesn’t scream "Breakout Incoming", I don’t know what does.
CRO (Crypto.com) is showing signs of a massive 154% move incoming — and it might all happen within 7 days, according to the current market cap projection.
🔍 Chart Breakdown
The chart combines:
Heikin Ashi candles on 4H timeframe
Six SMAs (21 to 1000) showing steady incline
A historical path projection (green/black lines) based on earlier fractals
A measured move (blue arrow): from ~$3.9B to ~$7.92B by August 6th
This projection implies a 2x from current levels ($4.72B) — within just a week!
⚠️ 2 Healthy Corrections Already In
Let’s not forget: CRO already had two corrections within this structure — visible in the black zig-zag overlay:
End of July: Quick dip into the SMA cluster
Start of August: Second pullback before resuming trend
These retracements build confidence, as they typically reset indicators before major continuation.
📈 Momentum is Building
Price is respecting all major SMAs (21, 50, 100, 200, 300, 1000)
We’ve re-entered the aggressive uptrend channel
No significant resistance seen until the $7.9B area
🧠 Final Thoughts
Could CRO really double in a week?
If it follows the trajectory mapped by the historical fractal pattern, the odds aren’t as crazy as they seem.
Stay sharp. These setups don't come around often.
💬 Agree or disagree? Drop your thoughts and let's chart it together.
📊 #CRO #CryptoCom #Altseason #FractalAnalysis #HeikinAshi #TradingView
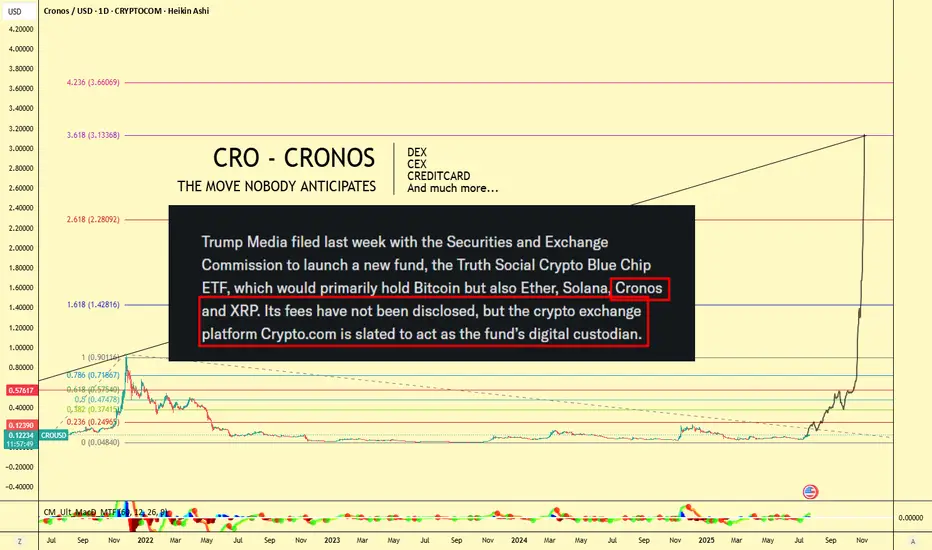
CRO (Crypto.com) $3 Target! Don't Miss This Move🪙 Ticker: OKX:CROUSDT
🕰 Chart: 1D (Heikin Ashi)
🔧 Tools Used: Fibonacci Extension, Fundamental News (ETF Filing)
🔍 Chart Analysis: Fibonacci Extension Targeting $3+
The Fibonacci Extension tool has been applied to the major CRO impulse wave from its peak near $0.90 (late 2021) to the 2022–2023 bottom at $0.0484, confirming a multi-year retracement and consolidation period.
Let’s break down the major Fib levels:
Extension Level Price Target
0.236 $0.2495
0.382 $0.3741
0.618 $0.5745
1.0 $0.9011
1.618 $1.4281
2.618 $2.2809
3.618 $3.1336
📌 Current Price: ~$0.12
🔥 Upside Potential to $3.13+ — a 25x move from current levels if full extension plays out!
📣 Fundamental Catalyst: CRO in Trump Media ETF
According to the chart note (sourced from SEC-related headlines):
"Trump Media filed with the SEC to launch a new ETF, the Truth Social Crypto Blue Chip ETF, which would primarily hold Bitcoin, but also Ether, Solana, Cronos (CRO), and XRP."
Even more important:
"Crypto.com is slated to act as the fund’s digital custodian."
This is massive fundamental validation for CRO — not just as a token, but as an ecosystem and financial infrastructure provider.
🌐 Why Crypto.com Matters: Utility, Ecosystem, Adoption
Crypto.com isn't just an exchange — it's a comprehensive Web3 ecosystem, which includes:
🔁 CEX (Centralized Exchange):
Buy, sell, stake, and trade hundreds of cryptocurrencies with high liquidity and low fees.
🔄 DEX (Decentralized Exchange):
Cronos Chain supports decentralized trading and DeFi apps — with low gas fees and EVM compatibility.
💳 Visa Credit Card Integration:
Crypto.com offers one of the most popular crypto Visa debit cards — earn cashback in CRO and enjoy perks like Spotify/Netflix rebates.
📱 Mobile Super App:
Buy/sell/stake/farm on-the-go with a seamless user interface.
📈 Earn & Lending Services:
Stake CRO or other assets for up to double-digit yields.
🤝 Strategic Partnerships
Crypto.com has been aggressively investing in brand and adoption:
🏟 Official partner of UFC, FIFA World Cup, and Formula 1
🏀 NBA’s Los Angeles Lakers Arena naming rights (Crypto.com Arena)
💼 Member of Singapore's regulated exchanges
🔐 ISO/IEC 27701:2019, PCI:DSS 3.2.1, and SOC 2 compliance — one of the most secure platforms in the industry
🧠 Conclusion: The Perfect Blend of TA + FA
With CRO being included in a potential U.S.-regulated ETF, the Crypto.com ecosystem booming, and technical patterns pointing to a Fib-based target above $3, CRO might be the sleeper play of the next bull run.
"The move nobody anticipates" might just be the most explosive one.
🎯 Short-Term Targets:
$0.25
$0.37
$0.57
🎯 Mid-Term Bull Targets:
$0.90 (prior ATH)
$1.42
$2.28
🎯 Full Cycle Extension:
$3.13
📢 Let me know in the comments:
Are you holding GETTEX:CRO ? What do you think about its inclusion in the ETF?
#CRO #CryptoCom #ETF #TrumpMedia #Altcoins #Bullrun #CryptoTrading #DeFi #FibTargets #CronosChain
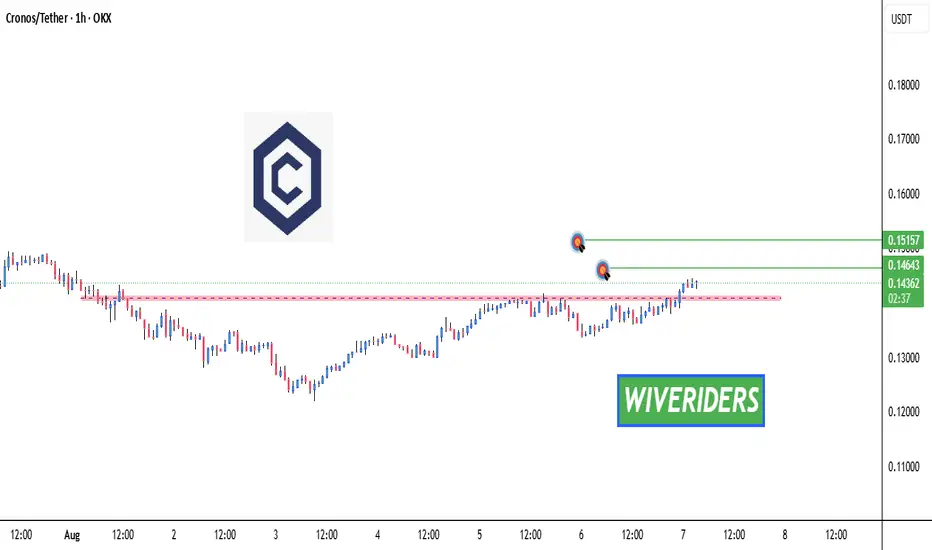
BULLISH - Head and Shoulder fake out - Upside > $0.16 USDBased on the analysis of recent market data, technical patterns, and aggregated forecasts, the short-term price prediction for Cronos (CRO) over the next five days, from July 28, 2025, to August 2, 2025, anticipates moderate upward momentum with a potential trading range of $0.145 to $0.160. This outlook considers the current price of $0.1468, reflecting a 0.85% increase over the past 24 hours, alongside a market capitalization of $4.74 billion and 24-hour trading volume of $81.85 million. The head and shoulders pattern observed in the provided chart suggests bearish reversal risks, with a potential downside target near $0.130 if support fails; however, recent positive sentiment on social platforms and short-term algorithmic predictions indicate resilience and possible gains of 7% to 12%.
Key influencing factors include elevated chain activity correlating with price appreciation, as noted in community discussions, and broader cryptocurrency market trends potentially buoyed by upcoming events, though no specific catalysts for CRO were identified in recent searches. Predictions from sources project incremental rises, such as reaching $0.160 by August 2, assuming sustained volume and no major sell-offs. This assessment is speculative and subject to volatility; it is not financial advice, and market conditions should be monitored closely.

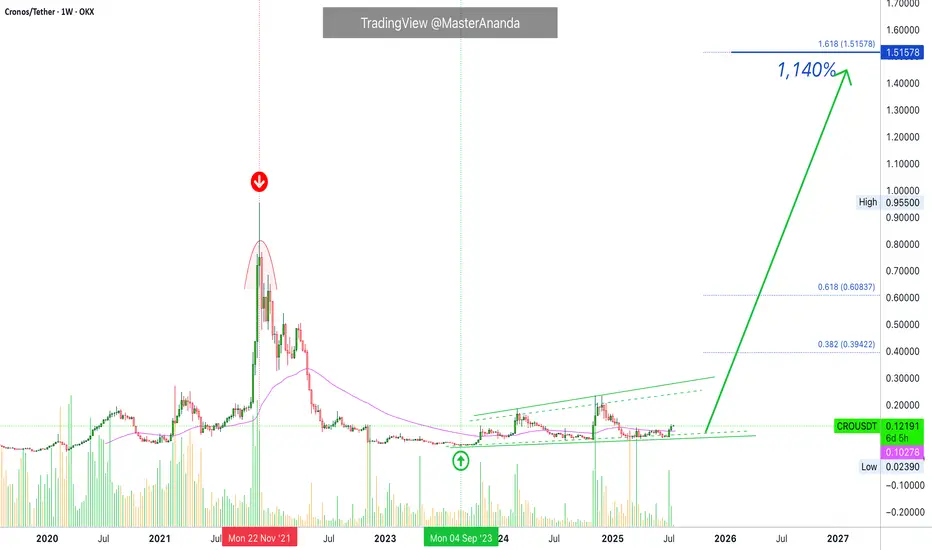
Cronos 2025/26 New All-Time High Revealed · PP: 1,140%Cronos has all the classic signals ready, confirmed and combined. RCC. And this opens the doors for a major advance which will not be shown fully on this chart. That is because I am using the linear chart for perspective but the log chart is needed to see all the major targets. Just trust, it is going to move very high in this bullish cycle run.
Good afternoon my fellow Cryptocurrency trader, I hope you are having a wonderful day.
Didn't I told you that you would see so much growth, that you will become complacent at some point? We are not there yet, but we will get there and you will have new challenges to face. Believe it or not, taking profits, using your earnings, will be one of the hardest things to do but the only right choice. A win is only a win when you close when prices are up.
Just as you cannot incur a loss unless you sell when prices are down; you cannot secure a win unless you sell when prices are up. When a pair grows 1,000%, you should take profits, period. When a pair growths 500%, it is wise to secure, 10%, 20%, etc. A plan is needed to achieve maximum success.
How you approach the market will depend on your goals, your capital, your trading style, which projects are available to you in your home-country, and so on.
A long-term investor does not need to sell, can continue to buy, accumulate and hold for a decade or more. Can you see? Each strategy is dependent on the person behind it.
CROUSDT · Trading weekly above EMA55 while still near the bottom. The bottom is revealed when we compare current candles size and location to the 2021 high price.
Last but not least, notice how each time there is a strong increase in trading volume the weekly session ends up closing green. Bullish volume is dominating this chart. A long-term accumulation phase.
Without further ado, the next and easy all-time high target is $1.51 but it can go much higher. Total profits reaching 1,140%.
Thank you for reading.
Namaste.
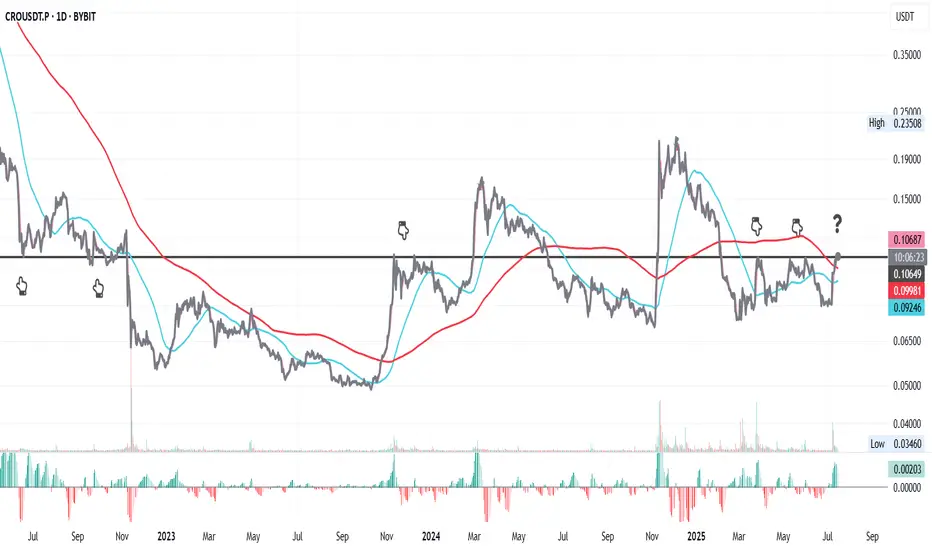
CRO at a Turning Point ?This is CRO on the daily chart.
Price has interacted multiple times with the key resistance at **0.10649** (black line). It’s now testing that level again, and there's a real possibility it flips it into support.
On top of that, CRO is attempting to reclaim the 200MA, while the 50MA is starting to flatten out—potential signs of a longer-term shift.
That said, this process might take some time and could be volatile. CRO’s relatively small market cap of \$3.33B and this week’s major macro events (starting today with CPI) could add pressure in both directions.
Always take profits and manage risk.
Interaction is welcome.
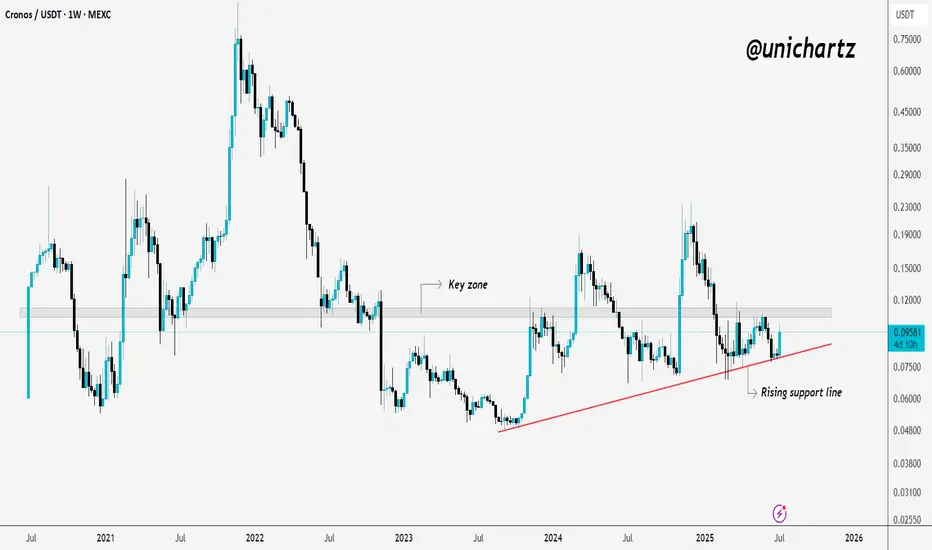
Cronos Holds Key Trendline – Will Resistance Crack Next?CRO is bouncing off its rising support line again.
The price has respected this trendline multiple times, showing steady accumulation. It’s also sitting just below a key resistance zone, if it breaks above that, we could see momentum kick in.
For now, the structure looks healthy as long as the support holds.
DYOR, NFA
Cronos Rallies 18% After Truth Social Files for Blue-Chip ETFOKX:CROUSDT is a leading candidate for a Binance listing this month, following the proposed Crypto Blue-Chip ETF filed by Truth Social with the SEC. The fund includes 70% Bitcoin, 15% Ethereum, 8% Solana, 5% Cronos, and 2% XRP , positioning Cronos as a key asset in the fund.
Of the tokens in the proposed fund, only Cronos (CRO) is not currently listed on Binance. If the SEC approves the Crypto Blue-Chip ETF, Binance could fast-track the listing of Cronos . This move would likely draw more liquidity and investor interest toward CRO, fueling its price growth.
OKX:CROUSDT price surged by 17.8% over the last 24 hours, signaling strong momentum. If the ETF listing is approved and Binance acts swiftly, CRO could break through key resistance levels, potentially surpassing $0.1007. This upward movement would benefit investors, continuing the positive trend for the altcoin.
Long On CRONOS/CROLong on Cro after a bounce on the 61.8% back to the highs. Also CRO ETF coming with Canary & partnership with President Trump could cause more bullish momentum.

CROUSDT 1D AnalysisCRO ~ 1D Analysis
#CRO Buy gradually after successfully breaking through this resistance line with a short-term target of at least 10%++.

Cronos: Bear Market VibesCronos is resisting the persistent selling pressure after last week's low, but it should soon turn sustainably downward again. We anticipate the imminent bottom of the overarching turquoise corrective wave 2 within the green Target Zone between $0.06 and $0.02. According to our primary scenario, once CRO reaches this new bear market low, it can quickly move upward in the next impulse wave, with the resistances at $0.14 and $0.23 serving at most as temporary pauses.
