Cronos (CRO) - April 25hello?
Traders, welcome.
By "following", you can always get new information quickly.
Please also click "Like".
Have a nice day.
-------------------------------------
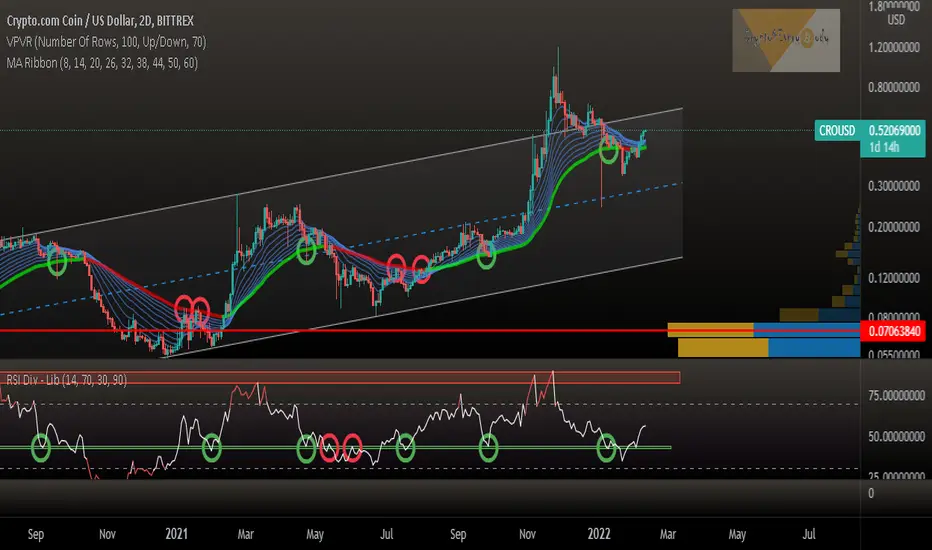
(CROUSD 1D Chart)
To turn into an uptrend, it must rise above the 0.4608-0.4802 section.
Therefore, the interval 0.4608-0.4802 is an important interval.
Below 0.3645, it is likely to enter the mid- to long-term investment area.
(buy)
- After confirming the support at 0.3952
(Stop Loss)
- When it falls below 0.3645 and receives resistance
(Sell)
- When receiving resistance in the 0.4608-0.4802 section
- When receiving resistance near 0.5632
A box interval was formed in the interval 0.3786-0.4608.
Therefore, if the movement continues in this section, it is expected that an uptrend to turn up is expected.
------------------------------------------------------------ -----------------------------------------------------
** All indicators are lagging indicators.
Therefore, it is important to be aware that the indicator will move accordingly as price and volume move.
However, for convenience, we are talking in reverse for the interpretation of the indicator.
** The MRHAB-T indicator used in the chart is an indicator of our channel that has not been released yet.
** The OBV indicator was re-created by applying a formula to the DepthHouse Trading indicator, an indicator disclosed by oh92. (Thanks for this.)
** Support or resistance is based on the closing price of the 1D chart.
** All descriptions are for reference only and do not guarantee a profit or loss in investment.
(Short-term Stop Loss can be said to be a point where profit and loss can be preserved or additional entry can be made through split trading. It is a short-term investment perspective.)
---------------------------------
Crousd

BTCUSD and CRONOS ComparisonCronos is showing very similar price action to that of BTC early 2013
Pasted the bars pattern in green to show a comparable run

$CRO IS ABOUT TO WAKE UP!cro is oversold, -65% from ath
cro is the official sponsor of fifa world cup 2022
cro is forming a pennant
cro is testing uptrend for the 5th time
cro is about to make the "e" breakout
cro is in a high volume node area

CROUSD DailyPrice is now on the 4 hour ascending trendline, & lower timeframe demand zone. Watching price action here for a reversal, also it is possible that if price breaks the trendline can test key level support for a 3rd reaction for powerful movement. CRO coin has big future potential as it is highly sponsored & has alot of great utilities as well.

Cronos (CRO) - April 5Hello?
Traders, welcome.
By "following", you can always get new information quickly.
Please also click "Like".
Have a good day.
-------------------------------------
(CROUSD 1D Chart)
(buy)
- After confirming the support in the 0.4608-0.4802 section
(Stop Loss)
- When it falls below 0.42
- (Short-term) When you find resistance by dropping below 0.4608, it's a good idea to sell some and check for further movement.
(Sell)
- When receiving resistance near 0.5632
- When receiving resistance in the range 0.643-0.69
------------------------------------------------------------ -----------------------------------------------------
** All indicators are lagging indicators.
Therefore, it is important to be aware that the indicator moves accordingly with the movement of price and volume.
However, for the sake of convenience, we are talking in reverse for the interpretation of the indicator.
** The MRHAB-O and MRHAB-B indicators used in the chart are indicators of our channel that have not been released yet.
(Since it was not disclosed, you can use this chart without any restrictions by sharing this chart and copying and pasting the indicators.)
** The wRSI_SR indicator is an indicator created by adding settings and options to the existing Stochastic RSI indicator.
Therefore, the interpretation is the same as the traditional Stochastic RSI indicator. (K, D line -> R, S line)
** The OBV indicator was re-created by applying a formula to the DepthHouse Trading indicator, an indicator disclosed by oh92. (Thanks for this.)
** Support or resistance is based on the closing price of the 1D chart.
** All descriptions are for reference only and do not guarantee a profit or loss in investment.
(Short-term Stop Loss can be said to be a point where profit and loss can be preserved or additional entry can be made through split trading. It is a short-term investment perspective.)
---------------------------------


Good time to buy CROChart self-explanatory. Looks like good reward to risk ratio for short/medium/long term based on these levels. Let me know what you think so we all can learn and grow! CRO expected to continue to grow longterm due to their aggressive marketing, defi wallet, portals, and customer growth.

CRO 0.64 $ or back to 0.37 $ ?hello
I hope you are doing well.
I always like to keep the chart simple.
Green path : if today's candle closes green and above 0.45 $ with good volume, it's an entry on the daily chart.
Red path : close below 0.45 $ which is mean we can't be bullish anymore until seeing another resistance breakout, and the price will be drop to around 0.35 - 0.37 $
.....
on 4h chart , we had a retest kinda , but some people wait for bullish engulf or wait for 2 green candles to enter a trade.
also we had a bullish Divergence on RSI
.....
not financial advice !
let me know what do you think and share your ideas with me , please !
have a good day !

CRONOS Pure TechnicalsHi guys,
I have been overlooking the Cronos chart quite recently, and I have to admit that this is one of the most beautiful charts i have looked into, according to respecting simple geometry.
We can see that currently Cronos is both testing the border of the triangle on the outside and as well trying to establish a higher low and support above the previous lower high. If this plays out, a double bottom od W pattern will be confirmed which would send Cronos to its next ressistance levels at 0.54. After that resistance is broken the next target is 0.68, and finally the previous ATH.
In case Cronos losses support and cannot establish a confirmation outside the triangle and above the W neckline, we will be testing the prices of 0.4, and furthermore 0.35 according to the support made around that price.
Trade responsively.
This is an observation and opinion, not advice.
Cheers!

CRO, a good short-term and mid-term buying opportunityAdmission price: current price
Stop Loss: 0.417-
Goal: 0.45 0.47 0.54…
Good luck!

Cronos CRO Price Targets and Stop LossCRO/USDT
Entry Range: $0.395 - 0.427
Price Target 1: $0.49
Price Target 2: $0.55
Price Target 3: $0.60
Stop Loss: $0.366

Cronos (CRO) - March 20Hello?
Traders, welcome.
If you "follow", you can always get new information quickly.
Please also click "Like".
Have a good day.
-------------------------------------
(CROUSD 1W Chart)
We need to see if we can continue the uptrend with support in the uptrend channel.
Therefore, point 0.377 is an important junction.
------------------------------------
(Coinbase CROUSD 1D Chart)
1st resistance section: around 0.4799
Secondary resistance section: around 0.643
Support section: 0.3645-0.3952
-------------------------------------
(CROBTC 1W chart)
0.0000 0607 - 0.0000 0746 or higher: Expected to continue upward trend
------------------------------------------------------------ -----------------------------------------------------
** All indicators are lagging indicators.
Therefore, it is important to be aware that the indicator will move accordingly as price and volume move.
However, for convenience, we are talking in reverse for the interpretation of the indicator.
** The MRHAB-O and MRHAB-B indicators used in the chart are indicators of our channel that have not been released yet.
(Since it was not disclosed, you can use this chart without any restrictions by sharing this chart and copying and pasting the indicators.)
** The wRSI_SR indicator is an indicator created by adding settings and options to the existing Stochastic RSI indicator.
Therefore, the interpretation is the same as the traditional Stochastic RSI indicator. (K, D line -> R, S line)
** The OBV indicator was re-created by applying a formula to the DepthHouse Trading indicator, an indicator disclosed by oh92. (Thanks for this.)
** Support or resistance is based on the closing price of the 1D chart.
** All descriptions are for reference only and do not guarantee a profit or loss in investment.
(Short-term Stop Loss can be said to be a point where profit and loss can be preserved or additional entry can be made through split trading. It is a short-term investment perspective.)
---------------------------------

CROUSD - Technical short term downtrend (15m chart) - 003Since 09Mar, CROUSD has been trading mostly sideways, with Bollinger band tightening.
Trading band in a descending triangle pattern with the upper downtrend line (formed with Nov21 and Mar22 highs) and immediate support line of 0.37. Poised for breakout or breakdown by 18Mar.
After which, we look to the 0.35 support line if breakdown below 0.37, or using resistance-turned-support downward trendline as a guide

CRO Crypto.com: 4H Chart ReviewHello friends, today you can review the technical analysis idea on a 4H linear scale chart for Crypto.com (CROUSD).
Crypto.com price has been in a downward trend. There are multiple Support and Resistance Lines shown. The price may make an attempt to get to the 0.236 Fibonacci Retracement area with the Ichimoku Cloud possibly creating resistance. RSI, MACD and MFI look bearish. Price is below the 20, 50 and 200 SMA.
If you enjoy my ideas, feel free to like it and drop in a comment. I love reading your comments below.
Disclosure: This is just my opinion and not any type of financial advice. I enjoy charting and discussing technical analysis . Don't trade based on my advice. Do your own research! #cryptopickk

Will CROUSD Continue Like This? A curved trend line can be drawn between bottom points, and likewise between top points, creating this nice parabolic channel, the question is has it already topped out right now? or is there more bull action to come as the curve becomes steeper

Crypto.com CRO - Ascending Inverted ScallopThe focus on the last part of the course is where we keep an eye on.
The Ascending Inverted Scallop with which we can nicely define the playing field. price target calculated (A - B = $0.15 x 0.64 = 0.096 + B = C).
It also coincides with a Falling Wedge which may be needed to approach the top of the scallop zone. with the slight positive divergence and the price at the bottom of the bollinger band, an upward impulse would not be surprising. does take into account any breakout at the bottom seen on large timeframe that show is present. a possible fakeout based on the goldenpocket shorter trend soon coincides with the 0.382 of the major trend, but if its continues to fall, prices towards $0.40 are not surprising.
Keep calm, trade safe and manage your risk.
*(Disclaimer: This is not financial advice)

CROUSD - Technical short term downtrend (15m chart) - 002A followup to the previous chart
Initial anticipation to hit the 0.39 level and resuming downtrend to the 0.35 short term bottom (in the coming days). This may be further extended with the temporary rally due o the material news of the treasury statement signaling some bullishness for crypto
Looking to see if the rally fails to surpass the 0.41 - 0.42 resistance level, with support levels at 0.37 and 0.35.
Daily chart shows a slightly descending triangle since Dec21. waiting to break strongly either sides before end of Mar22.

CROUSD Looks Bullish CROUSD has found a nice double bottom support above 0.786
Previous rejection points at 0.618 and 0.5 indicated by red arrows
In white box's I portray similarities between two points, both resulting in bullish results, from a double bottom scenario
Overall it does look bullish after breaking out of this rising wedge , which is normally considered more of a bearish pattern

CRYPTO.COM - SEARCHING FOR THE BOTTOM (CRO ANALYSIS)In our previous analysis on CRO, we identified Potential buy areas and DCA zones. However, we've had a hard time having our orders filled.
Not to worry as our trade idea is still on track,
UPDATE:
From the chart above in this current analysis, we can clearly see CRO in a channel up. Notice that after price touched channel resistance the first time out, we took a lengthy retracement back to support, however this was only confirmed after closing below the 360 Daily Moving Average(Blue Line).
We touched resistance for the 2nd time and we can expect our buy orders at the 360 daily MA (in-line with out first horizontal support).
Also notice that after touching the 360 MA, we retraced further down to hit the channel support at least approx. 40% each time.
Should history repeat itself, we can have our bottom below the 360 Daily MA. (I however expect the bottom to be at the W2 support region)
BUY ZONE 1- 360 DAILY MA/1ST HORIZONTAL SUPPORT
BUY ZONE 2- 2ND HORIZONTAL SUPPORT
BUY ZONE 3- W2 HORIZONTAL SUPPORT
BUY ZONE 4- CHANNEL UP SUPPORT REGION.

CRO against more resistance.Hi,
Let's take a look at the CRO / USDT chart, 4 hour interval. The price is moving in an uptrend channel.
We can designate the first short-term support at $ 0.51, while the second-place support is at $ 0.48.
A resistance zone between $ 0.55 - $ 0.61 is ahead of us. Breaking through this resistance could give us more gains.

CRO bullish ahead of the Super Bowl If you haven`t sold CRO at the top:
Then you should know that it is one of the most aggressive marketing companies in the crypto space.
I expect them, if not run an Super Bowl, then at least to be extremely bullish before the event and few days later.
My price target is $0.58 followed by a retracement.
The support and resistance play in the chart speaks for itself.
Looking forward to read your opinion about it.

#Crypto.com Coin #CRO flipped MA-Ribbon bullish again#Crypto.com Coin #CRO flipped MA-Ribbon bullish again
A good sign is the reconquest of the RSI-support.
And now we have the MA-Ribbon bullish flip as a conformation.
What do you think? 😎
Drop me a nice comment if you'd like me to analyze any other cryptocurrency.
*not financial advice
do your own research before investing
How to retire at the age of 65 with more than 1 millionI am going to use an article for my analysis. www.gobankingrates.com
If you scroll down to the how to save 1m starting at age 25 tab; it says to save 158$ per month "assuming" a 10% return.
Now if you do the same without assuming, using my method, here's how you'll be guaranteed a million by investing 158$ per month into CRO.
CRO has a staking reward system like many other cryptocurrencies with a guaranteed % APY. CRO has return rates ranging from 10%-12% depending on the card that you get.
Now let's assuming that this chart plays out, from what I can see on this chart, there is a possible gain of 19875% ROI. I will not do the math for you, if someone else can, please do lol. What does this mean? You'll be guaranteed 1 million at the age of 65 with a 10% APY staking and even sooner with a 12% APY. At the rate that CRO will increase you can possibly retire even sooner as the coin continues to increase in value. .60 today and in 40 years its 11$. If it hits 11$ in 40 years that's almost 20 million you'll have. The 1 million at 65 was with the assumption of CRO being at .60 cents on a 10% APY.
The graph shows 2088 bars, 1 bar is 7 days since this is a weekly chart. 2088 x 7 = 14616 days. 14616/365 = 40 years.
Here's how you retire at 65 with 1 million dollars guaranteed and not assumed.
For Wakanda
