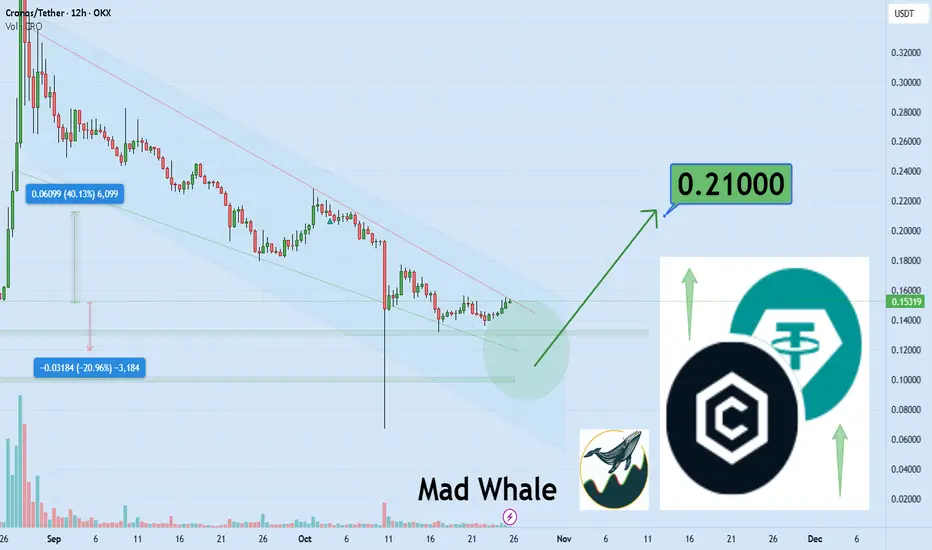
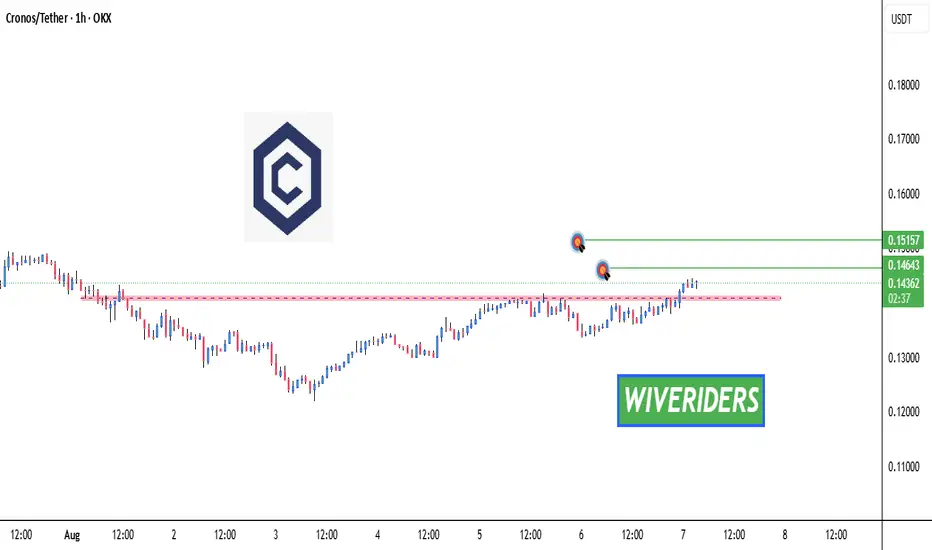
Cro Battles Last Defenses For 40% Move To $0.21Hi
the support and resistances on the chart are based on the previous data and weekly candlesticks if OKX:CROUSDT holds this last support the potential of 40% gain is logical toward 0.21$
CROUSDT
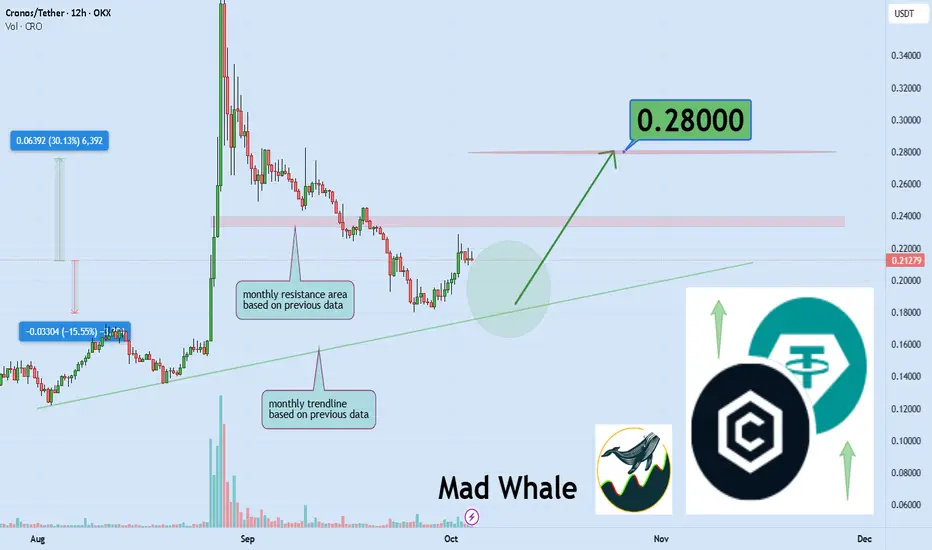
Cronos Approaches Key Trendline, Potential 30% Surge Toward 0.28Hello✌️
Let’s analyze Cronos's price action both technically and fundamentally 📈.
🔍Fundamental analysis:
In simple English:
Morpho’s launch on Cronos could make lending with BTC and ETH easier and boost CRO use for gas and collateral, a good sign for Cronos DeFi growth. 🚀
📊Technical analysis:
OKX:CROUSDT is approaching a crucial monthly trendline, and holding this level while breaking nearby resistance could trigger a potential 30% rally toward $0.28. Traders may watch for confirmation of bullish momentum at these key levels. 📈💎
📈Using My Analysis to Open Your Position:
You can use my fundamental and technical insights along with the chart. The red and green arrows on the left help you set entry, take-profit, and stop-loss levels, serving as clear signals for your trades.⚡️ Also, please review the TradingView disclaimer carefully.🛡
✨We put love into every post!
Your support inspires us 💛 Drop a comment we’d love to hear from you! Thanks, Mad Whale
CRO ; BIG PROFITHello friends
These days, this currency has grown well, which shows the power of buyers, and now we have identified important supports, which if maintained and the price stabilized, can rise to the specified price targets.
*Trade safely with us*
croI don't know what you want from a symbol that has grown so much that you are looking to enter it now. I showed two areas that each one wants to enter, the green or blue box or the intersection of both, I just wrote the distances and what percentage they are, even if you use lever 2, if you go into loss, you will lose between 40 and 50 percent.

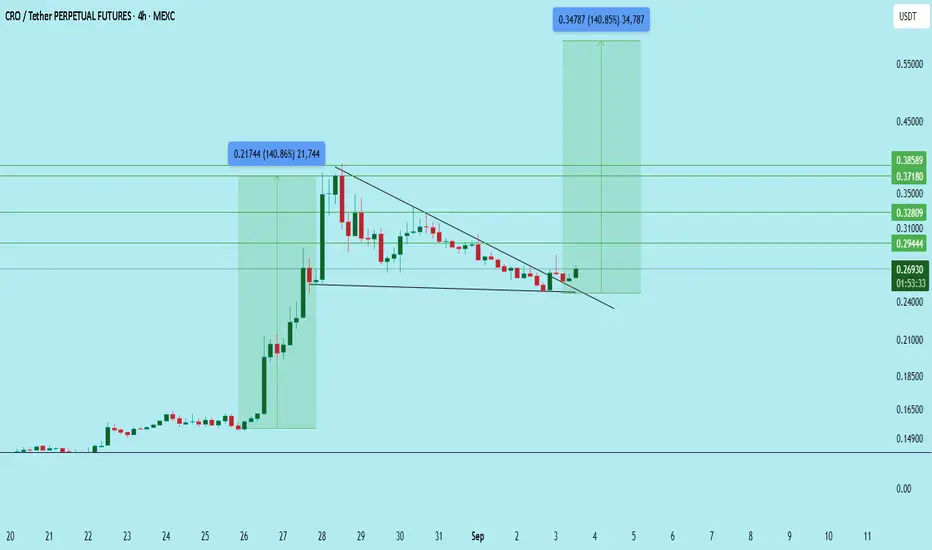
CRO/USDT – LONG, MAYBE a new HIGH in LINE !!CRO has broken out of a descending wedge pattern on the 4H chart after several weeks of consolidation. Historically, this setup often signals the end of a corrective phase and the beginning of a bullish continuation.
Key observations:
The breakout candle closed above the wedge trendline with increasing momentum.
Price is reclaiming the 0.260–0.270 support zone, which was previously resistance.
Strong bullish engulfing candle adds confirmation of demand stepping in.
If momentum sustains, CRO could target the upper resistance cluster near 0.328 – 0.385.
Entry zone: 0.260 – 0.270
Stop loss: Below 0.240
Targets:
T1: 0.294
T2: 0.310
T3: 0.328
Extended: 0.371 – 0.386
Insights: Holding above 0.265–0.270 is critical. Failure to hold could drag price back toward 0.245 before any continuation.
DYOR | Not Financial Advice
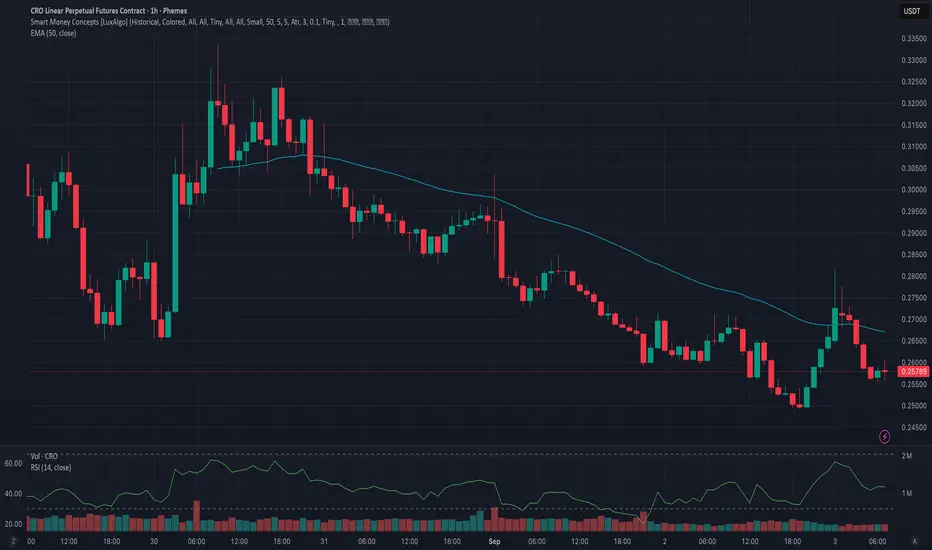
Phemex Analysis #106: Is Cronos (CRO) Ready for a Comeback?Cronos (CRO), the native token of the Crypto.com ecosystem, has had a turbulent year but is beginning to show signs of recovery. After plunging to lows near $0.08 in early July, CRO rallied to $0.38 by end-August, before retracing and trading today around $0.25. This rebound has fueled optimism among holders who see CRO as a long-term play on exchange tokens and blockchain adoption.
Beyond price action, CRO continues to be supported by its strong ecosystem. As the gas token for the Cronos Chain, it powers DeFi apps, NFT platforms, and GameFi projects while offering utility within Crypto.com’s exchange. The combination of real-world usage and a dedicated user base gives CRO a strong foundation for potential growth.
With CRO now consolidating under key resistance, the market is watching closely to see if it can stage a sustained comeback. Let’s explore the possible scenarios ahead.
Possible Scenarios
1. Bullish Breakout Toward $0.33 - $0.38
If CRO manages to reclaim $0.28 with rising volume, it could trigger a bullish continuation toward $0.33 and potentially $0.38, aligning with prior resistance zones.
Pro Tips:
Enter after confirmation of a breakout close above $0.28.
Scale out profits at $0.33 and $0.38.
Use stop-loss orders slightly below $0.25 to protect capital.
2. Range-Bound Consolidation $0.24–$0.28
CRO may continue to oscillate between support at $0.24 and resistance at $0.28, as traders wait for clearer market direction.
Pro Tips:
Buy near $0.24 support and sell close to $0.28 resistance.
Avoid overtrading in the middle of the range.
Watch volume shifts as a signal of an impending breakout.
3. Bearish Pullback Toward $0.15
If CRO fails to hold $0.24 on strong sell volume, the bearish trend could resume, sending price back toward $0.15, its support before recent rally.
Pro Tips:
Reduce exposure if $0.24 fails to hold with conviction.
Long-term investors may consider DCA at deeper supports ($0.12–$0.15).
Look for reversal signals like RSI divergence before re-entering.
Conclusion
CRO has rebounded strongly from its summer lows and is now consolidating in a key zone. With real utility across the Crypto.com ecosystem and the Cronos blockchain, it remains a token with strong long-term potential. Traders should keep an eye on the $0.28 breakout level and the $0.24 support zone to navigate the next move effectively. Whether CRO is on the verge of a sustained comeback or preparing for another test of support, disciplined strategies will be essential to capture opportunities.
🔥 Tips:
Armed Your Trading Arsenal with advanced tools like multiple watchlists, basket orders, and real-time strategy adjustments at Phemex. Our USDT-based scaled orders give you precise control over your risk, while iceberg orders provide stealthy execution.
Disclaimer: This is NOT financial or investment advice. Please conduct your own research (DYOR). Phemex is not responsible, directly or indirectly, for any damage or loss incurred or claimed to be caused by or in association with the use of or reliance on any content, goods, or services mentioned in this article.
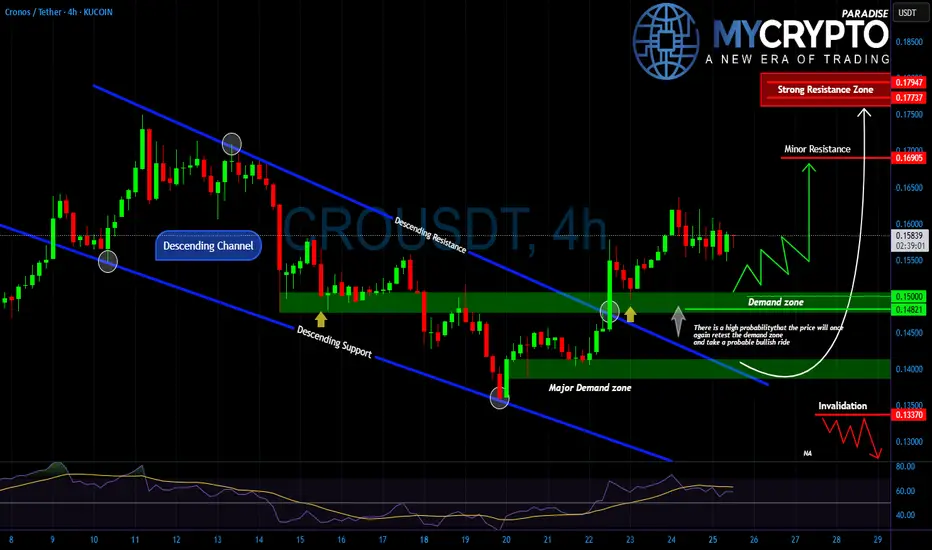
CROUSDT Ready for a Bullish Rebound or a Brutal Trap? Yello Paradisers, is #CROUSDT about to give us a clean bullish rebound from demand or is this just another setup to wipe out impatient buyers?
💎After a prolonged descent within a clear downward channel, #CRO finally broke out, reclaiming strength above the major demand zone around $0.1400–$0.1450. This level acted as a turning point, pushing price back toward the $0.1550–$0.1600 region. Currently, GETTEX:CRO is hovering above minor demand and showing signs of retesting the zone near 0.1500.
💎That region, however, represents a heavy resistance cluster where profit-taking could easily trigger sharp rejections.On the flip side, if demand fails to hold and price breaks below 0.1480, the invalidation level near 0.1330 comes into play. A breakdown into that zone would trap late buyers and likely fuel another wave of panic selling before any real recovery attempt.
💎The key here is patience. Price is at a crossroads where both traps and opportunities are equally possible. Only disciplined traders who wait for confirmation at demand or rejection from resistance will avoid getting caught in the whipsaw.
🎖Strive for consistency, not quick profits. Trade with patience, protect your capital, and let the market show you the highest probability setups. That is how you stay in the winner’s circle.
MyCryptoParadise
iFeel the success🌴
CRO - Very nice ROI, from $0.11 to $0.34Congratulations to those that followed along.
Its not done yet, expect some profit taking with some support / consolidation near $0.25, tiny at $0.25 but its there. Stronger support at $0.18-$0.20.
Careful if trading perps due to the bullish gaps getting filled. Dont get liquidated, watch and set tight stop losses and adjust those trailing stop losses and brackets carefully

$CRO price pumped hard after the big news:🚀 The price of CRYPTOCAP:CRO skyrocketed after major news:
SPAC-company Yorkville Acquisition Corp, TMTG, and Cryptocom signed a final merger agreement.
They are launching Trump Media Group CRO Strategy, Inc. — a new digital asset management firm focusing on acquiring #CRONOS.
💹 Key details:
▪️ Yorkville Acquisition Corp plans to file for listing Class A shares on Nasdaq under ticker MCGA
▪️ Charter capital:
• 6.3B #CRO (~19% of supply) ≈ $1B (avg. price $0.159)
• $200M in fiat
• $220M in warrants
• + $5B credit line
🤔 But here’s the catch…
As the old trader’s saying goes:
"Buy the rumor — sell the news"
OKX:CROUSDT is still far from ATH ($1), but the news already seems to be “priced in”.
So we may see a distribution phase coming… if it hasn’t started yet.
⚖️ And the key point:
the further CRYPTOCAP:CRO price moves from the $0.159 average set in the deal, the less appealing it looks to buy right now.
And next… 👇
🧠 DYOR | This is not financial advice, just thinking out loud.
______________
◆ Follow us ❤️ for daily crypto insights & updates!
🚀 Don’t miss out on important market moves

CRO/USDT 1W Chart📊 Current situation
• Price: ~ 0.2067 USDT (+33% per week).
• Trend: strong Breakout after a long consolidation.
• SMA:
• Short -term (red, ~ 0.1236 and 0.1592) was pierced → confirms the change of trend.
• Green (SMA #2) also below the price → bull signal.
• MacD: heavily growing histogram, MacD line above the signal → growth moment.
• RSI: ~ 70 → enters the purchase zone, but not yet extreme (no divergence).
⸻
📈 levels of support and resistance
• Support:
• 0.1592 (last Breakout Level).
• 0.1236 (strong zone of previous consolidation).
• resistance:
• 0.2347 (nearest resistance).
• 0.3374 (key resistance from higher intervals).
⸻
🧐 Interpretation
• We have a confirmed upward trend - the price has pierced the relegation line (yellow trend line) and the SMA broke.
• Momentum is growing (MacD, RSI, volume).
• However, RSI signals the possibility of short -term correction if the price hit 0.2347.
⸻
🔮 Scenarios
1. Bycza (more likely)
• If we keep it above 0.1592, possible attacks on:
• 0.2347 → Then even 0.3374.
• A good chance of continuing the trend within the average time.
2. Bear (correction)
• a decrease below 0.1592 → correction to 0.1236.
• Only a breakdown 0.1236 will negate the current upward trend.

$CRO Dominate the Market Epic TP/SL!KUCOIN:CROUSDT
CRYPTOCAP:CRO Dominate the Market with Entry at 0.20650 - 0.20750 & Epic TP/SL!
Entry Point: Marked at 1 0.20650 - 0.20750 USDT, indicating the price level to enter a long position.
Take Profit (TP) Levels:TP1: 0.7860 (0.19129 USDT)
TP2: 0.6180 (0.17935 USDT)
TP3: 0.5000 (0.17097 USDT)
TP4: 0.1354 (0.11354 USDT)
These levels suggest a descending target strategy, likely based on Fibonacci retracement or similar technical analysis.
Stop Loss (SL):Set at 1.272 (0.22583 USDT), above the entry to limit potential losses.
Dollar-Cost Averaging (DCA):Marked at 1.135 (0.21609 USDT), indicating an additional buy level if the price retraces.
Price Action:The chart shows a recent upward movement around the entry point (1 0.20650 - 0.20750 USDT), following a period of consolidation and a prior downtrend.
The candlestick pattern near the entry suggests a potential reversal or continuation, depending on the next few candles.
Relative Strength Index (RSI):
The RSI (bottom panel) is currently at 85 - 84, indicating overbought conditions (above 70). This suggests the price may be due for a pullback or consolidation unless strong bullish momentum continues.

Crypto.com (CRO)Cro usdt Daily analysis
Time frame daily
Risk rewards ratio >5.3 👈👌
Nothing to say
Chart is clear
Red line is historical support line

CRO Breakout Alert – Red Resistance Cleared! 🚨 GETTEX:CRO Breakout Alert – Red Resistance Cleared! 🔴✅
GETTEX:CRO has successfully broken out of the red resistance zone.
📈 Momentum is in play — next targets in focus:
🎯 First Target → Green line level 1
🎯 Second Target → Green line level 2
Strong breakout confirms buyer control — watching for continuation toward both targets.
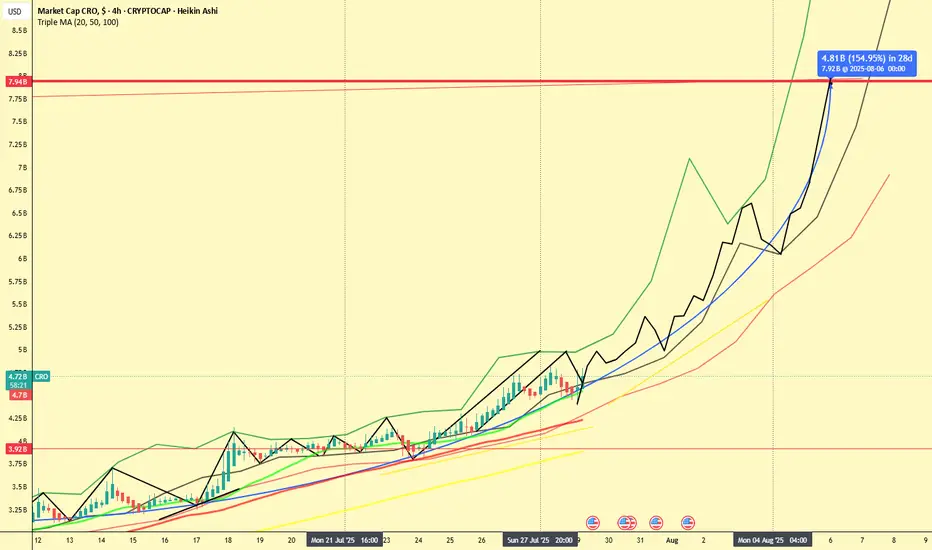
CRO 2x in 7 Days? Chart Hints at Explosive Move!📆 July 29, 2025
📍 CRO Market Cap (4H Heikin Ashi - Historical Projection Analysis)
If this chart doesn’t scream "Breakout Incoming", I don’t know what does.
CRO (Crypto.com) is showing signs of a massive 154% move incoming — and it might all happen within 7 days, according to the current market cap projection.
🔍 Chart Breakdown
The chart combines:
Heikin Ashi candles on 4H timeframe
Six SMAs (21 to 1000) showing steady incline
A historical path projection (green/black lines) based on earlier fractals
A measured move (blue arrow): from ~$3.9B to ~$7.92B by August 6th
This projection implies a 2x from current levels ($4.72B) — within just a week!
⚠️ 2 Healthy Corrections Already In
Let’s not forget: CRO already had two corrections within this structure — visible in the black zig-zag overlay:
End of July: Quick dip into the SMA cluster
Start of August: Second pullback before resuming trend
These retracements build confidence, as they typically reset indicators before major continuation.
📈 Momentum is Building
Price is respecting all major SMAs (21, 50, 100, 200, 300, 1000)
We’ve re-entered the aggressive uptrend channel
No significant resistance seen until the $7.9B area
🧠 Final Thoughts
Could CRO really double in a week?
If it follows the trajectory mapped by the historical fractal pattern, the odds aren’t as crazy as they seem.
Stay sharp. These setups don't come around often.
💬 Agree or disagree? Drop your thoughts and let's chart it together.
📊 #CRO #CryptoCom #Altseason #FractalAnalysis #HeikinAshi #TradingView
CRO (Crypto.com) $3 Target! Don't Miss This Move🪙 Ticker: OKX:CROUSDT
🕰 Chart: 1D (Heikin Ashi)
🔧 Tools Used: Fibonacci Extension, Fundamental News (ETF Filing)
🔍 Chart Analysis: Fibonacci Extension Targeting $3+
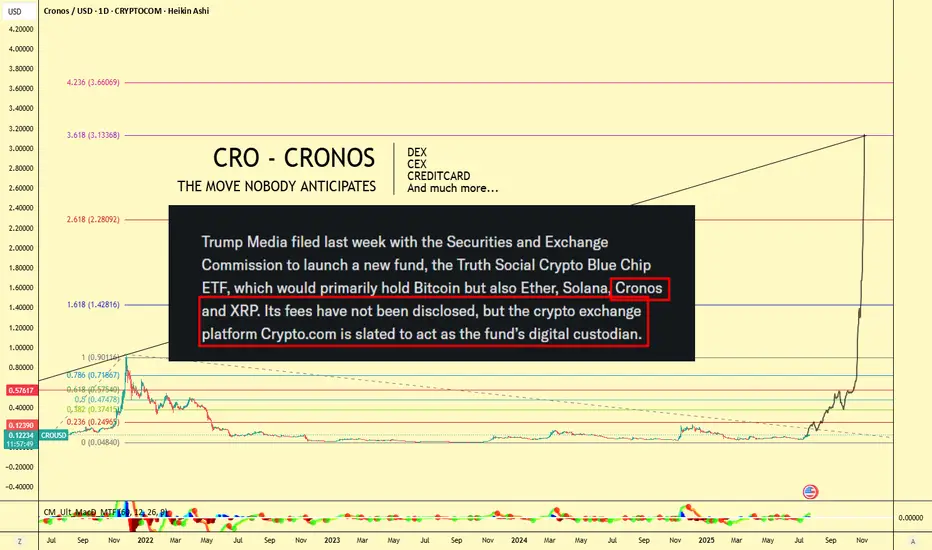
The Fibonacci Extension tool has been applied to the major CRO impulse wave from its peak near $0.90 (late 2021) to the 2022–2023 bottom at $0.0484, confirming a multi-year retracement and consolidation period.
Let’s break down the major Fib levels:
Extension Level Price Target
0.236 $0.2495
0.382 $0.3741
0.618 $0.5745
1.0 $0.9011
1.618 $1.4281
2.618 $2.2809
3.618 $3.1336
📌 Current Price: ~$0.12
🔥 Upside Potential to $3.13+ — a 25x move from current levels if full extension plays out!
📣 Fundamental Catalyst: CRO in Trump Media ETF
According to the chart note (sourced from SEC-related headlines):
"Trump Media filed with the SEC to launch a new ETF, the Truth Social Crypto Blue Chip ETF, which would primarily hold Bitcoin, but also Ether, Solana, Cronos (CRO), and XRP."
Even more important:
"Crypto.com is slated to act as the fund’s digital custodian."
This is massive fundamental validation for CRO — not just as a token, but as an ecosystem and financial infrastructure provider.
🌐 Why Crypto.com Matters: Utility, Ecosystem, Adoption
Crypto.com isn't just an exchange — it's a comprehensive Web3 ecosystem, which includes:
🔁 CEX (Centralized Exchange):
Buy, sell, stake, and trade hundreds of cryptocurrencies with high liquidity and low fees.
🔄 DEX (Decentralized Exchange):
Cronos Chain supports decentralized trading and DeFi apps — with low gas fees and EVM compatibility.
💳 Visa Credit Card Integration:
Crypto.com offers one of the most popular crypto Visa debit cards — earn cashback in CRO and enjoy perks like Spotify/Netflix rebates.
📱 Mobile Super App:
Buy/sell/stake/farm on-the-go with a seamless user interface.
📈 Earn & Lending Services:
Stake CRO or other assets for up to double-digit yields.
🤝 Strategic Partnerships
Crypto.com has been aggressively investing in brand and adoption:
🏟 Official partner of UFC, FIFA World Cup, and Formula 1
🏀 NBA’s Los Angeles Lakers Arena naming rights (Crypto.com Arena)
💼 Member of Singapore's regulated exchanges
🔐 ISO/IEC 27701:2019, PCI:DSS 3.2.1, and SOC 2 compliance — one of the most secure platforms in the industry
🧠 Conclusion: The Perfect Blend of TA + FA
With CRO being included in a potential U.S.-regulated ETF, the Crypto.com ecosystem booming, and technical patterns pointing to a Fib-based target above $3, CRO might be the sleeper play of the next bull run.
"The move nobody anticipates" might just be the most explosive one.
🎯 Short-Term Targets:
$0.25
$0.37
$0.57
🎯 Mid-Term Bull Targets:
$0.90 (prior ATH)
$1.42
$2.28
🎯 Full Cycle Extension:
$3.13
📢 Let me know in the comments:
Are you holding GETTEX:CRO ? What do you think about its inclusion in the ETF?
#CRO #CryptoCom #ETF #TrumpMedia #Altcoins #Bullrun #CryptoTrading #DeFi #FibTargets #CronosChain
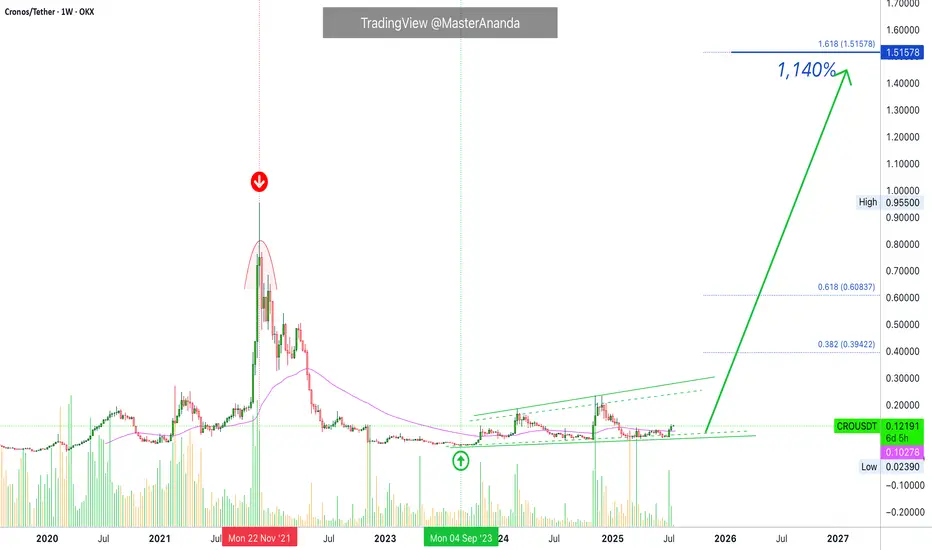
Cronos 2025/26 New All-Time High Revealed · PP: 1,140%Cronos has all the classic signals ready, confirmed and combined. RCC. And this opens the doors for a major advance which will not be shown fully on this chart. That is because I am using the linear chart for perspective but the log chart is needed to see all the major targets. Just trust, it is going to move very high in this bullish cycle run.
Good afternoon my fellow Cryptocurrency trader, I hope you are having a wonderful day.
Didn't I told you that you would see so much growth, that you will become complacent at some point? We are not there yet, but we will get there and you will have new challenges to face. Believe it or not, taking profits, using your earnings, will be one of the hardest things to do but the only right choice. A win is only a win when you close when prices are up.
Just as you cannot incur a loss unless you sell when prices are down; you cannot secure a win unless you sell when prices are up. When a pair grows 1,000%, you should take profits, period. When a pair growths 500%, it is wise to secure, 10%, 20%, etc. A plan is needed to achieve maximum success.
How you approach the market will depend on your goals, your capital, your trading style, which projects are available to you in your home-country, and so on.
A long-term investor does not need to sell, can continue to buy, accumulate and hold for a decade or more. Can you see? Each strategy is dependent on the person behind it.
CROUSDT · Trading weekly above EMA55 while still near the bottom. The bottom is revealed when we compare current candles size and location to the 2021 high price.
Last but not least, notice how each time there is a strong increase in trading volume the weekly session ends up closing green. Bullish volume is dominating this chart. A long-term accumulation phase.
Without further ado, the next and easy all-time high target is $1.51 but it can go much higher. Total profits reaching 1,140%.
Thank you for reading.
Namaste.
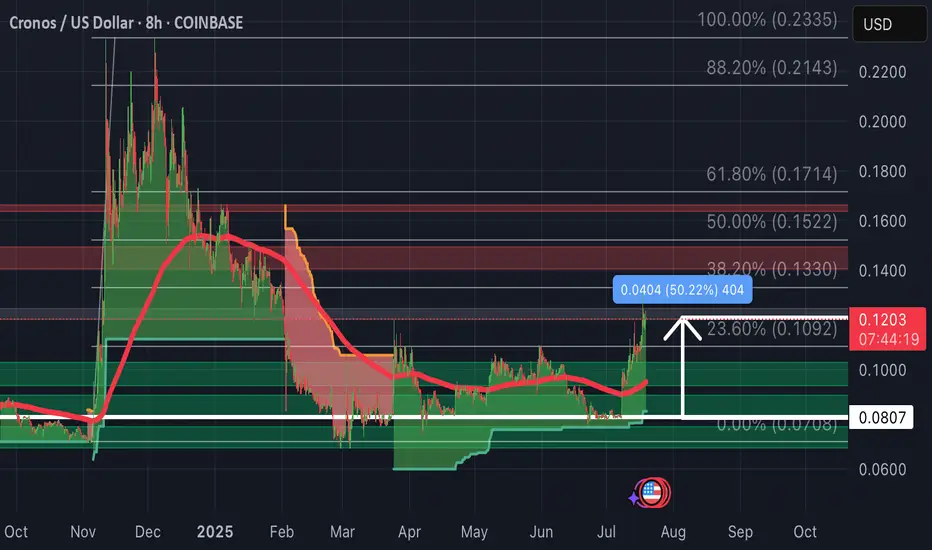
CRO-Update: Up 50% so far from February postThe took 5 months but we are up 50% so far.
Patience has paid off as price action breaks through resistance as it retest Fibonacci levels back towards 100% Fib Correction.
CRO surged after Trump Media & Technology Group filed for a “Crypto Blue Chip ETF” on July 8, allocating 5% to CRO. The ETF would track BTC (70%), ETH (15%), SOL (8%), XRP (2%), and CRO, with Crypto.com’s custodial arm securing assets. Approval would funnel passive institutional flows into CRO, driving demand.
Institutional tailwinds: SEC closed its Crypto.com review, boosting confidence.
$CROUSDT Just Broke Out, Is a 130% Pump Coming?GETTEX:CRO has broken out above a long-term descending trendline and reclaimed the 100-day moving average, a bullish signal.
If it holds above this zone, the next targets are $0.1079, $0.1498, and potentially $0.2155, offering up to 132% upside.
Watch for a successful retest to confirm momentum.
DYOR, NFA

$BONK Breakout ConfirmedSEED_DONKEYDAN_MARKET_CAP:BONK Breakout Confirmed
The $1000BONKUSDT 1D chart shows a breakout from a long-term downtrend followed by a successful retest of the key support zone around $0.016390.
This area, previously resistant, is now acting as strong support.
If it holds, BONK could rally up to $0.040830, a potential 150% upside.
Invalidation occurs on a clean break below the support zone. Structure remains bullish for now.
DYRO, NFA

$USDT.D Rejeccted Again Altseason SignalCRYPTOCAP:USDT.D Rejected Again Altseason Signal
USDT Dominance is showing a clear rejection from the descending trendline and 200 MA, similar to the previous 16% drop.
The RSI is turning down from the overbought zone, signalling potential downside.
If this move plays out, we could see USDT.D fall toward the 4.0% zone, which is bullish for Altcoins.
DYRO, NFA

$CRO Breakout ConfirmedGETTEX:CRO Breakout Confirmed
OKX:CROUSDT has broken out of a symmetrical triangle after weeks of consolidation. A bullish MACD crossover and a reclaim of the 50-day EMA support the breakout. A potential 125% move is in play, targeting the $0.235 zone.
The chart shows that strong momentum is building.
DYRO, NFA

CROUSDT 1D AnalysisCRO ~ 1D Analysis
#CRO Buy gradually after successfully breaking through this resistance line with a short-term target of at least 10%++.

Cronos is on the move, Could we see it hit $1 soon?The chart is a weekly candlestick chart of CRONOS (CRO) against USD on TradingView, showing price action from late 2023 to a projected point in 2025. Let’s break down the key elements:
Price Movement and Trend:
CRONOS experienced a notable peak around mid-2024, reaching approximately $0.24000, followed by a sharp decline.
After the peak, the price entered a downtrend, forming a descending triangle pattern, which is typically bearish but can lead to a breakout in either direction.
The price has since stabilized in an "Accumulation Zone" between $0.07197 and $0.08925, with the current price at $0.08925 as of April 1, 2025.
Descending Triangle Pattern:
The descending triangle is defined by a downward-sloping resistance line (yellow) and a horizontal support line around $0.08925.
This pattern often signals a potential breakout. A break above the resistance could indicate a bullish reversal, while a break below support might lead to further downside.
The resistance line is currently around $0.13000 to $0.15000, based on the slope.
Accumulation Zone:
The price is in an "Accumulation Zone" between $0.07197 and $0.08925, suggesting that buyers are holding this level and potentially accumulating positions.
Multiple tests of this support level indicate strong buying interest, which could set the stage for a breakout if bullish momentum builds.
Target Projection (TG 1S):
The chart projects a target labeled "TG 1S" at $0.42000, a significant increase from the current price.
This target is likely based on the height of the descending triangle pattern added to the breakout point, a common technical analysis method.
However, reaching $1 (as requested) would require a much larger move, approximately an 11x increase from the current price of $0.08925.
Support and Resistance Levels:
Key support is at $0.07197, with the current price at $0.08925.
Resistance from the descending triangle is around $0.13000 to $0.15000, with a previous high at $0.17018.
A break above $0.17018 could open the door to higher levels, but reaching $1 would require sustained momentum and likely strong fundamental catalysts.
Historical Context and Feasibility of $1:
CRONOS reached an all-time high of around $0.96 in November 2021 during a crypto bull market, so $1 is within historical precedent.
However, the current market environment (as of April 2025) would need to see significant bullish momentum, possibly driven by broader crypto market trends, adoption of the Cronos ecosystem, or major developments in the Crypto.com platform (which CRONOS is tied to).
The $0.42000 target is a more immediate goal, but $1 would require an extraordinary rally, likely over a longer timeframe.
Timeframe:
The chart extends into mid-2025, and the $0.42000 target appears to be a medium-term projection.
Reaching $1 might take longer, potentially into late 2025 or beyond, depending on market conditions.
