The Contango Conundrum: Why Crude’s Price Power WanesThe global crude oil market is signaling sustained weakness. A clear sign is the Contango in the West Texas Intermediate (WTI) futures curve for most of 2026. This structure prices future oil deliveries higher than immediate ones, strongly indicating a global supply glut. Major forecasting bodies like the International Energy Agency (IEA) and the Organization of the Petroleum Exporting Countries (OPEC) now confirm a record surplus looms in 2026, reversing previous tight market expectations. Understanding this decline requires a multidisciplinary lens, examining supply resilience against sluggish demand across several domains.
Geostrategy and Geopolitics: Production Over Protocol
Geopolitical decisions, paradoxically, contribute to oversupply. OPEC+ members are gradually unwinding previous voluntary production cuts, adding millions of barrels back to the market. This production boost, formalized in their latest agreements, increases supply visibility and dampens price spikes. Simultaneously, sustained geopolitical tensions between major powers often lead key consumers like China to ramp up Strategic Petroleum Reserves (SPR) , effectively soaking up immediate surplus but reducing future demand visibility. This policy-driven stockpiling mitigates immediate price falls, but structural oversupply persists.
Macroeconomics and Economics: Slowdown Meets Resilience
A deceleration in global oil demand growth meets unexpectedly resilient supply . Macroeconomic headwinds, including trade tensions and a sluggish global economic outlook, suppress consumption growth below historical trends. This tepid demand environment is exacerbated by expanding production from non-OPEC+ nations. Crucially, the United States, Brazil, Canada, and Guyana lead this non-OPEC+ supply expansion, challenging the cartel’s market dominance. The resulting imbalance, production exceeding demand, creates the chronic oversupply driving WTI into contango.
Technology and High-Tech: Efficiency Enhances Supply
Advancements in extraction technology dramatically boosted supply, particularly within the US shale sector. Continuous innovations in horizontal drilling and hydraulic fracturing sustain high US output, even as prices soften. Furthermore, the rapid expansion of Electric Vehicle (EV) sales and increasing vehicle fuel efficiencies represent a major technological headwind for transportation fuel demand. This shift, supported by global patent activity in battery and wave energy technology, structurally limits long-term oil consumption growth.
Patent and Science Analysis: The Energy Transition
Patent activity confirms the directional shift away from fossil fuels. While patents related to downhole completion systems and drilling fluid prediction remain, increased patenting in Carbon Capture and Sequestration (CCS) [/b and Green Hydrogen signals the industry's necessary pivot. The science of energy transition, focusing on low-carbon solutions, suggests a future where oil remains a critical input but faces mounting competition from technological substitutes. This long-term displacement risk pressures oil prices, even if demand remains firm in the short run.
Cyber and Strategic Risk: Supply Chain Security
The increasing reliance on complex digital infrastructure across the oil value chain introduces cyber risk . Successful attacks on pipeline operators or refineries can cause temporary supply disruptions and price spikes. However, the market currently views such disruptions as temporary events rather than long-term structural issues affecting the overall supply-demand balance. The oversupply acts as a buffer, with floating storage and ample inventory mitigating the impact of short-term, localized outages.
Investment Outlook: Watching Spreads
The market signals clearly indicate supply strength and demand vulnerability. The widening WTI contango structure provides a clear arbitrage opportunity for traders willing to finance storage. Investors should closely monitor the Brent-Dubai Exchange of Futures for Swaps (EFS), which is turning negative, underscoring specific weakening in the Atlantic Basin. Barring a sharp, coordinated OPEC+ cut or an unexpected large-scale geopolitical conflict, pricing pressure should persist into 2026. Traders must prioritize futures spread analysis over simple outright price forecasting.
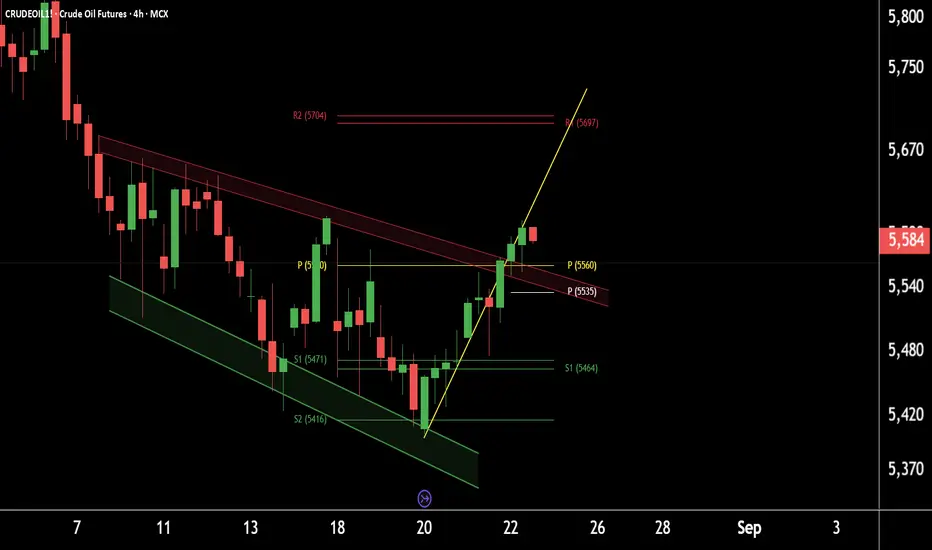
Crudoil

Crude Oil breaks out of falling channel –Watch for higher level.This is the 4-hour timeframe chart of CrudeOil1!.
The price has been moving within a well-defined falling channel and has now given a breakout. A possible retest of the breakout level around 5560 may occur, after which CrudeOil could move towards the falling channel completion target near 5700.
Weekly pivot support is also placed around the 5400–5450 zone and resistance around 5700.
If this level is sustained, we may see higher prices in CrudeOil1!
Thank You !!
CRUDOIL OMG OIL in many cases is used to maximize the profits of countries that are
producers or have important stocks to have easy income at the expense of an energy inflation and therefore that destroys the real economy.
If scenario '' a) '' were confirmed, we would be faced with a historic oil record with unprecedented damage to the real economy. $ 175 / $ 200
Please tell me that's not true ...
However, we remain hopeful in option '' b '' a controlled return to acceptable prices despite an energy crisis
$ 85 / $ 80
We will follow the developments.
For more informacion contact us on private
LPI.sa

Crude oil goal: 15MIN AnalysisThe probability of what I analyzing, is to be true unless the opposite is proven
Feel free dear trader to share with me your opinion, and also your analysis & Keep Watching
USOIL TP: $110

Crude Oil Looking Bullish!Where do we begin?
first, let's talk momentum.
Monthly - bullish
Weekly - turning bullish
Daily - bullish and increasing
4 Hr - so bullish
well, it seems like Crude will be revisiting $64.20 (target). There may be some turbulence along the way with the daily downtrend line but.. it's likely going to break. 🙄
Happy Trading folks!
Cheers!

CL daily analysis Hi friends
the daily chart of this market shows that it will experience an uptrend but also it is better to be vigilant of the change of this market towards the opposite direction
thank you for subscribing to have more analyzes


NATGAS THIS AREA IS GOOD TO BUYNATGASUSD just touching the descending trend line, rebound to Fibo. 38.2%

Short Oil @ 59.60 - 60.00 area Fib 0.50 line. Oil has had a nice bounce from the Jan 2019 lows, and I believe it's time for a little pullback. This 59.60 - 60.00 area is an important pivot point, exactly sitting at the Fib 0.50 line, which will prove very hard to be broken. We consolidated in this region back in 2015 and fell hard. Remember that we are in a secular bear market, and this up movement from the Jan lows could be seen as a bear flag. First price target is 55.5, and then a second, a little aggressive price target would be 50.5. Given that the general equity market fundamentals point to a pull-back, shorting oil will be high probabilty trade. Enjoy the profits!!!

usoil range to 30 aug 2017reasons to buy oil: storm harvey, venesuella storm, decreasing numbers of rigs, good inventories data
reasons to sell: all time high production, not so bulling report last week, i am expecting weaker report next week.

CL - Crude Oil Zoom & Test and here comes another short target:This one is classic.
Zoom, test and a potential re-test.
However, the target is the lower medianline parallel.
If we close above the centerline, then chances are very high for a pullback to the upside.
P!

CL - Crude with three potential targetsThis is a wild ride, but we are not unhappy don't we ;-)
The prior LT chart gave us a great indication about the fall.
A closer looks reveal that the drop from above is the logical swing that markets do.
Targets?
Well, we have a couple of them as you see on the chart.
See the circles? One at the A/R-Shift, and two other ones at the different centerlnes.
First I even expect a pullback, since markets swing.
The yellow, thin down sloping mini Forks centerline is key!
If price jumps above it, we can expect a bigger pullback.
If price just test/retest it, then another entry is praying to be taken.
So, let's be patient, ride the grumpy bear and see if we can load up some.
P!

CL - Crude on a very longterm view.The blue centerline was respected very good.
The white U-MLH is not bad too.
There is a high chance that price will meet the centerline...hoooly...how about below 25, or even 20?
Looks totally crazy, yes, to me too ;-)
But hey, we follow the path of price & forks.
We act upon what we see, not what we wish to see...veeery hard sometimes hehe...
Put context around it - it makes charts & price action more clear.
P!

CL - Crude on a test/retest bevor the breakdown?Here we have it picture perfect!
On the left side, you can see the big sine-wave-swing.
These sine-wave swings often get broken fist, before
a further movement in the original direction.
And so it happened.
Price was not able to move further north.
Oil organisations did all to keep price up - even manipulating in the news...
As I wrote in the previous post: The market makes the price, not a organisation and not even a talking head. We must understand that the value of everything is determined by the trust and distrust of us, the people, the consumer, the markets!
In my last posts you could (and thanks to TradingView you still can) follow my analysis and see how it evolved. It's not about my analysis - it's about the framework I use to be able to make such projections and forecasts. Everyone can do this by learning it...
Back to the chart:
So, we broke the big white centerline.
As the framework dictates, price comes back to where it broke out and test/retest the centerline again.
If price fails to jump back above the centerline, then we have a very high chance to go down to the next line, the L-MLH.
If you are interested in more information about the Fork Trading Framework and how to apply it to the markets, just drop me a private message. I keep you informed about my new course material, coaching and services.
Peace!


USOIL WAS OUT ALL DAY WASNT ABLE TO PUBLISH THIS IDEA BUT BEEN LONG ON USOIL TODAY HOLDING POSITIONS TILL STOPPED OUT OR TP HITS
