Divergence and Break in 1h chart in APEYou can see the divergence of the peak in the chart compared to the RSI , and its complement is the break of the downward trendline, which you must pay attention to. Be aware.
Be profitable.
Follow me! Copy my trade!
TradeSetup_Reza
Cryoptocurrency

CRO ready for big pumpHello Traders, here is the full analysis for CRO , let me know in the comment section below if you have any questions.
The ellipse could represent a possible zone with good risk/reward to accumulate long position.
Please note that all the information and publications here are not meant to be, and do not constitute, financial, investment, trading, or other types of advice or recommendations.

Bitcoin Elliot Wave Suggest 12K Will be the BottomElliot Wave analysis of #Crypto Market suggests that we are in Wave-4 Retracement and this wave will complete near 25K. Thereafter Bitcoin may fall upto 12K

BTC, Two Bearish divergence warnings !BTC shows two different scale bearish divergences when it is at major resistance ! It is a clear warning.
Mentioned divergences have been shown on the chart. First is major one and second one is minor but both are clear and beautiful.
RSI is making a clear divergence with price : Last established lower high and possible next lower high (Connected by a thick red line on the chart) show different trend (Thick green line) on RSI indicator.
MACD is also showing a bearish divergence with price in step like recent moves. We have minor higher highs on price chart (Thin green line ) with different trend on MACD ( Thin red line ).
Please note possible divergences are important at resistances and as I showed in my latest published BTC idea, Bitcoin is currently fighting with 4 resistances (See related idea for detail ).
Is BTC able to break all the resistances and escape from bearish divergences? Many may be optimistic about this but as my exprience says : Cautious is needed in these situations.
Good luck everyone.

BTC in a leading diagonal could also end up being a leading diagonal making to wave 2 just to give bears right then move all the way to wave 5 (bear rally( to take all the liquidity away from retail before a bigger correction

KEY LEVEL FOR BTC Hello friends
As you can see, in the daily time frame, we have hit the resistance line of the descending channel, and the bulls and bears have been fighting in this area for three days. The future of the market depends on how Bitcoin reacts to this line. I saw that in some analysis it is mentioned that USDT.D has come below the 100 day resistance in the weekly time frame and if it stabilizes there today, we will see Bitcoin rise. But I still do not see this as a convincing reason. I would rather see the bitcoin candles in the next two days and then make a decision.
be profitable

Hey take a look :DIn my desicion up or down trends generally target 1.618 and 2.618 fibo levels and i think Bitcoin reached that goal in its latest bullish wave starts from 18.900$.
Watch out MACD may be in the overbought zone, can give a sell signal at any time.
* None of what i write here is not an investment advice. Please do your own research before investing in any digital asset.
* Never take my personal opinions as investment advice, you may lose your money.

FIL MAY TARGET 1,618 FIBO LEVEL* None of what i write here is not an investment advice. Please do your own research before investing in any digital asset.
* Never take my personal opinions as investment advice, you may lose your money.

3 to 1 short BTC trade idea for today, 24 June 2022Risk is 3 times the reward on this short Bitcoin trade idea. Keep it simple.


AUTO HUGE VOLUMEHuge volume, bullish divergence on Relative Strengh Index, Squeeze and Directional Movement Index going upwards. Moon time...

BTC breaks above the triangle. Next target is above $32000BTC breaks above the triangle and created a chance to test $32000.
Right now market suck in its near term resistance level of $30767. SO, technically it may go in some downward correction. But, market seems very strong buy momentum. So, if BTC breaks above its near-term resistance level of $30767 we can buy instant and one kore buy limit order at its near term trendline support zone of $29600 price zone.
If market breaks above the $30767 our second target will be $32000. And stop loss should be below the $28000.

BITCOIN (BTC/USD): The Eiffel Tower pattern. $20k approaching?Living in Paris and seeing this absolutely stunning creation of Gustave Eiffel almost everyday, and being a huge fan of sacred geometry makes it really easy for you to differentiate some patterns looking at graphical illustrations of various securities.
Taking a look at the Monthly timeframe chart of Bitcoin, we can notice that the massive bullish run that took place from October 2020 to April 2021 perfectly lines up with the left curve of the Eiffel Tower. The top of the tower, the place where you have all the souvenir shops and people posing for Instagram nicely captures the longs wicks that are spiking to the upside but being unable to break above. At the very moment, we can see how nicely the current bearish wave corresponds to the right curve of the tower. Although we believe that there is a potential for the price to drop even deeper down, we are setting our initial target at the Monthly zone of support of $20k, which in fact perfectly aligns with the reverse "U" curve of the Eiffel Tower.
Disclaimer: The purpose of this post is neither advertising Paris and nor offering a financial advice. Use this idea both for educational and entertainment purposes!
Happy trading, dear wizards!


Bitcoin will retest levels below $26k before finding a bottomI warned that Bitcoin would not find support until it reached $26k or lower many weeks ago.
Now, I believe Bitcoin will attempt to move below $26k again - to FLUSH OUT new lows. This could mean a move below $22k or $21k - possibly bottoming below $20k on deep selling.
The markets are looking for a bottom, but the unwinding of the speculative phase (over the past 5+ years) is going to take time. As traders and investors shift expectations, I'm expecting a much deeper unwinding process for Cryptos and Bitcoin. Ultimately, the $16k level may come into play again. But technically, the trend is Bearish and I believe this is the first downside wave of a bigger FLUSH OUT price move.
Everyone will be saying "this is the bottom".. I don't believe we've seen the bottom for Bitcoin yet. Stay cautious.

#BTC/USDT DAILY UPDATE BY CRYPTOSANDES. Hello, members and welcome to this BTC /USDT quick chart analysis.
As I mentioned in my previous chart that is Nothing much change to see at this daily time frame BTC is still trading above the support zone which is $29k - $29.5k.
This is not a piece of financial advice.
Then, hit the like button and share your chart in the comment section if you like it.
thank you.


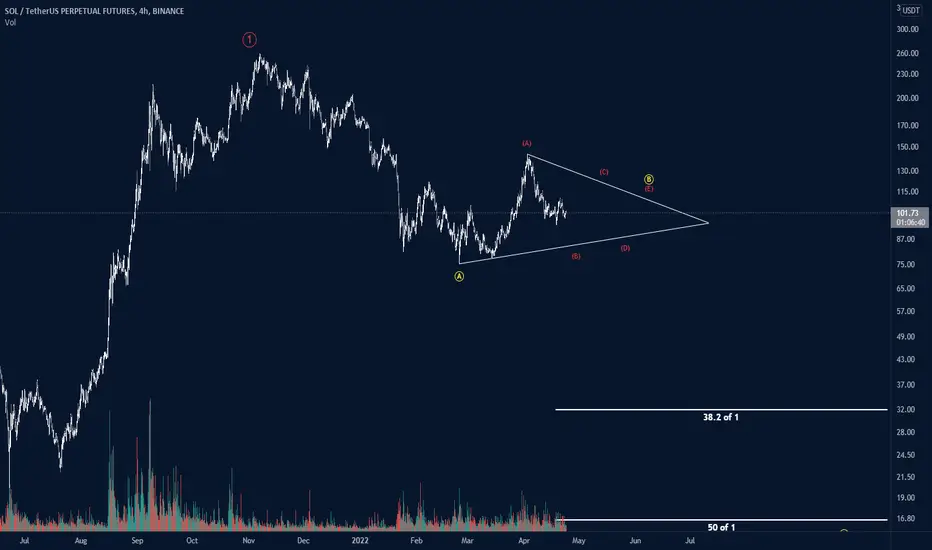
solana correctionjust trying to predict where Solana might be heading. My idea for a triangle is that as it is coming down there is no increase in bearish volume.

bitcoin is moving on opposite side after breaking flag patternBTC is moving on opposite side after breaking flag pattern. We can see the unusual ups and downs from 4-5 days which are unexpected.
That's why it is confusing. So it's better to avoid from trading.. because BTC is not crossing resistance as well as support zone properly.
If you take any trade use low fund margin.
Best of luck to all🥰

thank god i didnt los this longi think you all know what is this mean ,ich think jam is a god projekt

BTC / BITCOIN Outlook April 25, 2022the same chart pattern ? if it is true the possibility of btc will be 44k

BTC LONG | Decision pointPrice action feel bit weak but there is some buying setup is formulation on day chart.
