BTCUSD: Bulls Aim for Recovery Toward $92,000 Resistance ZoneHello everyone, here is my breakdown of the current Bitcoin setup.
Market Analysis
BTCUSD continues to move within a clearly defined Downward Channel, respecting both the descending resistance line and the lower support boundary. After a prolonged bearish continuation from the major Range structure seen earlier, Bitcoin broke several intermediate support levels before reaching the Support Zone around $84,000, where strong buyers stepped in. A Fake Breakout below the channel support triggered aggressive buying activity, sending the price back above the Support Zone and forming a short-term recovery structure. From this point, BTCUSD made a corrective bounce and even managed to break above a minor descending resistance, confirming a temporary shift in momentum.
Currently, price is approaching the Resistance Zone near $88,000–$90,000, which aligns with the upper boundary of the Downward Channel. This area has previously generated strong sell-offs and remains the key obstacle for buyers. A clean breakout above $90,000 would signal bullish continuation and may lead to a deeper recovery toward the next liquidity cluster near $92,000–$94,000. As long as BTCUSD holds above the $84,000 Support Zone, the short-term structure supports a bullish correction. However, if price gets rejected from the $90,000 resistance and fails to stay above support, sellers may regain control and push the market back toward the lower channel boundary.
My Scenario & Strategy
From my perspective, BTCUSD maintains a bullish corrective outlook while respecting the Support Zone around $84,000. The first target remains the $90,000 Resistance Zone, which matches both horizontal resistance and the channel’s upper boundary. A confirmed breakout above $90,000 would open the path toward $92,000–$94,000, where the next reaction levels are located. I will look for long opportunities during pullbacks toward the Support Zone or along the rising minor trendline that formed after the fake breakout.
If BTCUSD breaks back below $84,000, the bullish scenario becomes invalid, and a continuation of the major downward trend may follow. For now, price action supports a bullish recovery setup as long as buyers defend the Support Zone.
That's the setup I'm tracking. Thank you for your attention, and always manage your risk.
Crypto-analysis

BTCUSD Channel Support Holds as Price Targets $85K PullbackHello traders! Let’s break down the current BTCUSD market structure. Bitcoin is trading inside a well-defined descending channel, forming consistent lower highs and lower lows. This structure confirms that the market is still moving within a broader bearish trend. Earlier, BTC created a large range phase on the left side of the chart, showing indecision before breaking down and starting the current downtrend. Each approach to the upper trendline (Resistance Line) resulted in a clear turnaround, proving that sellers continue to defend this zone aggressively. During the recent decline, BTC made multiple corrections inside the channel, but every upward move was short-lived and rejected by the descending resistance. A recent breakout attempt failed, and price quickly returned back into the channel, signaling that bullish momentum remains weak. Currently, Bitcoin is testing the Support Line of the descending channel near the $81,400–$82,000 zone. This level has acted as a key demand area within the trend. A short-term bounce from support is possible, and the chart shows a projected move toward TP1 near $85,000, which aligns with a minor internal resistance level. However, as long as BTC trades below the major Resistance Level around $94,000 and within the descending channel, the market maintains a bearish bias. Any bullish recovery is likely to be limited unless price can break above the channel and secure structure above $94,000. Please share this idea with your friends and click Boost 🚀

BTCUSD Short: Descending Channel Targets $89,000 Demand ZoneHello traders! BTCUSD continues to trade within a clear descending channel, maintaining a strong bearish structure characterized by consecutive lower highs and lower lows. The price action repeatedly respected the channel boundaries, confirming solid seller control throughout the recent decline. Each time Bitcoin reached the upper boundary of the channel, it formed a pivot point, initiating another downward wave. Before the latest drop, BTCUSD spent some time moving sideways inside a Range Zone, showing temporary accumulation before sellers regained dominance. The bearish continuation led to another pivot formation near the channel’s resistance, triggering a fresh leg to the downside.
Currently, price has now approached the $89,000 Demand Zone, which aligns with the lower boundary of the descending channel. This level has acted as a significant reaction point, generating short-term bounces in previous price swings. The current positioning suggests that buyers may once again attempt to defend this zone. While below the $96,000 Supply Zone and the channel resistance, the broader trend remains bearish. BTCUSD is likely to experience a short-term corrective rebound from the demand area, aiming toward the $92,000–$93,500 region — a previous reaction cluster and local resistance.
My scenario is targeting the $89,000 level. However, if Bitcoin breaks below the $89,000 Demand Zone, it may trigger a deeper bearish continuation toward the lower liquidity areas around $88,000 or even lower. A confirmed breakout above $96,000 would be required to invalidate the bearish structure and signal a potential shift in momentum. For now, BTCUSD remains bearish, with a potential short-term correction from demand before further direction becomes clearer. Manage your risk!

BTCUSD Long: Short-Term Correction Eyes $97,500 ResistanceHello traders! BTCUSD continues to trade within a well-defined descending channel, maintaining a broader bearish structure while forming a series of lower highs and lower lows. Throughout the move, the price has created multiple pivot points along both the upper and lower channel boundaries, confirming the strength of this trend. Inside the channel, Bitcoin developed two notable range phases, each reflecting temporary consolidation before continuing downward. A key formation on the chart is the Rounding Top Pattern, which developed near the mid-channel area. This structure signaled weakening bullish pressure and preceded a sharp decline back toward the channel’s lower boundary. After the breakdown, BTC attempted a small recovery, but price failed at the Supply Zone, creating a rejection that aligned with a bearish breakout confirmation.
Currently, the price is approaching the $97,500 short-term target, which sits close to the lower edge of the Supply Zone. This level has acted as a significant reaction area several times, and the market may retest it before deciding the next direction. As long as BTC trades within the descending channel, the broader trend remains bearish, but short-term corrective moves to the upside are possible due to the strong reaction from demand.
My scenario as long as BTCUSD holds above the Demand Zone ($94,000–$94,500) and shows continued strength, a corrective move toward $97,500 remains likely. This level represents the nearest resistance and aligns with previous supply reactions. A clean breakout above $97,500 would open the way for a deeper correction toward the channel’s mid-line or even the upper boundary. However, if price gets rejected at the supply zone again, sellers may regain control and attempt another push back toward the demand area. A confirmed break below the Demand Zone would invalidate the bullish recovery setup and could trigger continuation of the broader downtrend. For now, the structure supports short-term bullish correction, but overall trend remains bearish until the descending channel is broken. Manage your risk!

RESOLV Hello my friends 😍
Is the end of the bullish trend of the RESOLV cryptocurrency near? 🤔
The RESOLV cryptocurrency seems to have reached the end of the uptrend and should change direction soon
⚠️ The question is, should I enter a short position at this point?
💁♂️ Absolutely not!
🤔 When should we enter a trade?
💁♂️ When we see a logical structure with a trigger in this area
⚠️ If I don't see a structure and a trigger in this area, I won't enter a trade
The analysis targets will be the lower orange areas
⚠️The analysis may not reach the final target, so at each target, if you make a good profit and see signs of a trend change, you can exit the trade or manage your capital.
⚠️ None of the analysis is a recommendation to buy or sell, but simply my personal opinions on the charts. You can use the charts and choose any that interest you and take a position if you wish.
To support me, I would appreciate it if you boost the analysis and share it with your friends so that I can analyze it with more energy for you, my dears. Thank you all. ❤️

BTCUSD Short: Targeting 108,000 Demand ZoneHello, traders! Bitcoin (BTCUSD) has recently transitioned from a prolonged bullish structure into a corrective phase after facing strong rejection from the 116,000 Supply Zone. The market previously traded inside a well-defined Ascending Channel, forming a steady sequence of higher highs and higher lows — a classic bullish formation.However, after testing the upper boundary of the channel and the Pivot Point, BTC failed to sustain bullish momentum. The breakout attempts above the supply zone turned out to be fake breakouts, showing exhaustion among buyers. Since then, the market has shifted its tone and started to form a descending structure, moving below the Supply Line that now acts as dynamic resistance.
Currently, the price is pushing lower from the mid-range of the channel toward the Demand Zone, located between 108,000 and 107,700. This area has previously served as a strong support base that triggered impulsive bullish reversals in the past.
In my opinion, BTC is likely to extend its bearish correction toward the 108,000–107,700 demand area. A successful test and strong reaction from this zone could mark a potential bullish reversal, confirming demand absorption and the end of the correction phase. However, if sellers maintain control and manage to break decisively below 107,700, the market may open the way for a deeper decline toward the 106,000 level. As long as the price remains below the Supply Line, short-term bearish pressure prevails. I’m currently bearish to neutral, looking for price action signals around the demand area to confirm whether a new upward impulse is about to begin. Manage your risk!

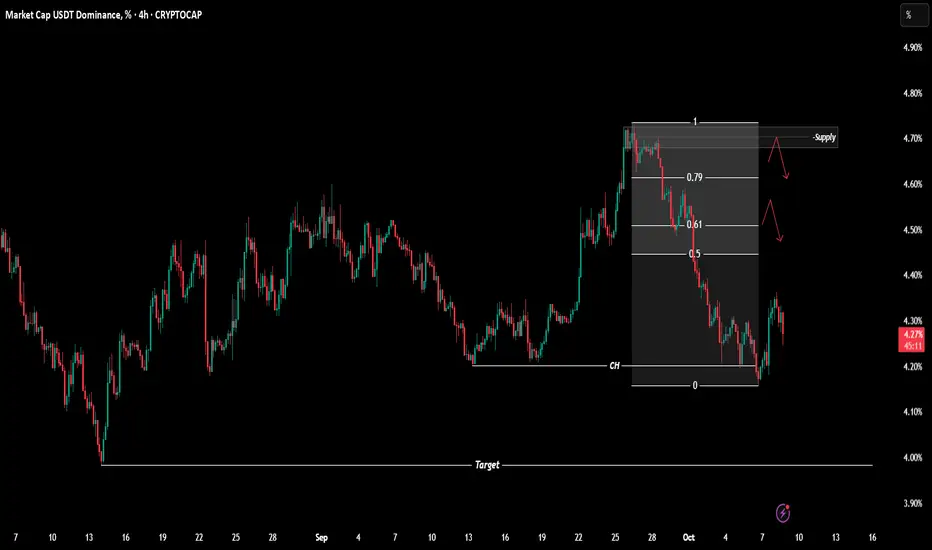
$USDT.D Analysis - Oct 8 | 4H Time FrameCRYPTOCAP:USDT.D Analysis - 4H
Hello and welcome to another analysis from the Satoshi Frame team!
I’m Abolfazl, and today we’re going to analyze Bitcoin on the 4-hour timeframe.
USDT dominance has shown a trend reversal on the 4-hour timeframe and has turned bearish.
The OTE zone and the marked supply area could act as potential rejection zones if dominance makes a short-term pullback upward.
On the other hand, we could also see another drop from the current level, moving toward the lower support area near the recent low.
The main target (4%) is already marked on the chart.
See you in the next analyses!
Stay tuned with the Satoshi Frame team...
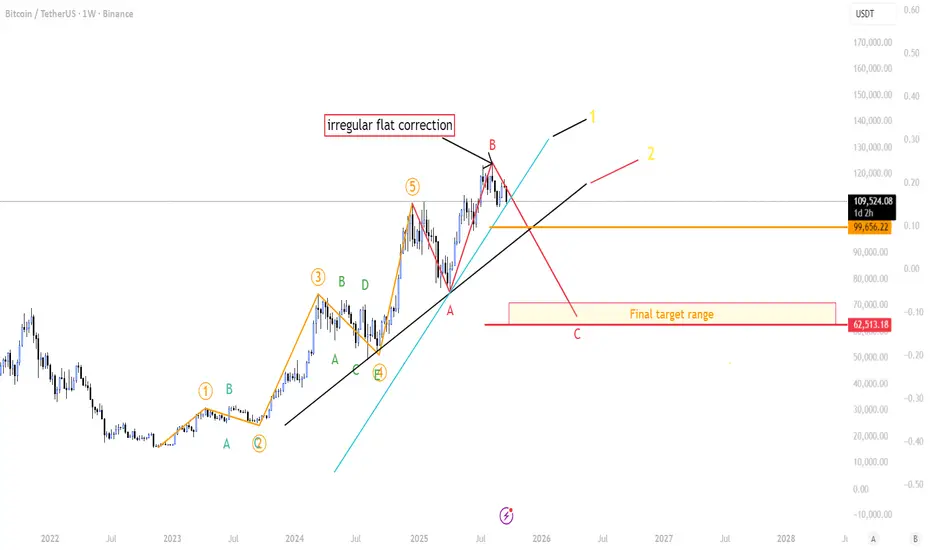
BTC at a Crossroad: Path to 62.5k Is Conditional-Pick Your PlayI’m sharing a possible irregular flat correction that could pull BTC toward ~62,513—only if two key trend supports break.
Note: This Elliott count differs from my main count. It’s my secondary scenario—lower conviction, but it deserves close attention because the structure is developing cleanly. This does not mean BTC is going down (it's just a watch out scenario)
The story so far
From the Nov 22, 2022 low, BTC ran a full 5-wave impulse.
Wave 3 was the extended one.
Wave 4 formed a triangle.
Wave 5 ran hotter than expected (roughly the size of Wave 3). That’s unusual, likely fueled by extreme Bollinger Band Width compression before the final push.
Why this matters: when Wave 3 extends, Wave 5 is usually shorter. It isn’t a hard rule—just a guideline—so this count stays on the board, but it’s not a high-conviction setup.
What I think is happening now
The drop and bounce look like an expanded (irregular) flat: (A) down, (B) up which was our All time high, C down.
If the pattern completes, C could target ~62,513.
Quick pattern note (irregular flat): It’s a 3–3–5 structure — A = 3 waves, B = 3 waves (often pokes above the prior high), and C = 5 waves. On this chart, A and B already printed as 3 + 3. The setup isn’t confirmed until we see C unfold as a clear 5-wave move (1-2-3-4-5). No five-wave C = no completed irregular flat.
What would confirm it (the “if/then”)
Lose the first rising trend support (≈ 109k).
Then lose the second, deeper trend support.
If both break, the path toward ~62.5k could be opening up.
Between those two lines: BTC can go sideways for a weeks—that “range box” is important.
Why the range box matters (Altseason meter)
Altcoins usually need steady BTC to fly:
BTC sideways (not spiking up or dumping).
TOTAL2 (alt mkt cap) breaks ATH.
BTC.D rolls over (dominance falls).
If these three line up, we’ve got a real altseason setup. If not, it’s noise.
Bottom line
This is a watchlist scenario, not gospel.
I’ll respect the levels: no break = no bear target.
If we range between supports, I’ll look for alt strength while BTC stays calm.
BTCUSD Short: Dump Of Supply ZoneHello, traders! The price auction for BTC has been operating within a large ascending channel, a structure defined by key pivot points that have established the 109500 demand area as support and the 113200 supply area as resistance. This bullish framework has guided the price through a series of higher highs and higher lows, confirming the buyer's initiative and the strength of the current uptrend.
Currently, the auction is at a critical inflection point at the top of this channel. The price has rallied to directly test the channel's ascending supply line, which forms a confluence of resistance with the horizontal 113200 - 113600 supply zone. This is a key area where sellers are expected to become active and challenge the prevailing bullish momentum.
The primary scenario anticipates a corrective move from these highs. The expectation is that sellers will defend the supply zone and reject the price, initiating a downward rotation back towards the channel's support line. A failure to break out higher would confirm a short-term correction is underway. The take-profit for this rotational play is therefore set at 110100 points, targeting a key liquidity area above the primary demand zone. Manage your risk!

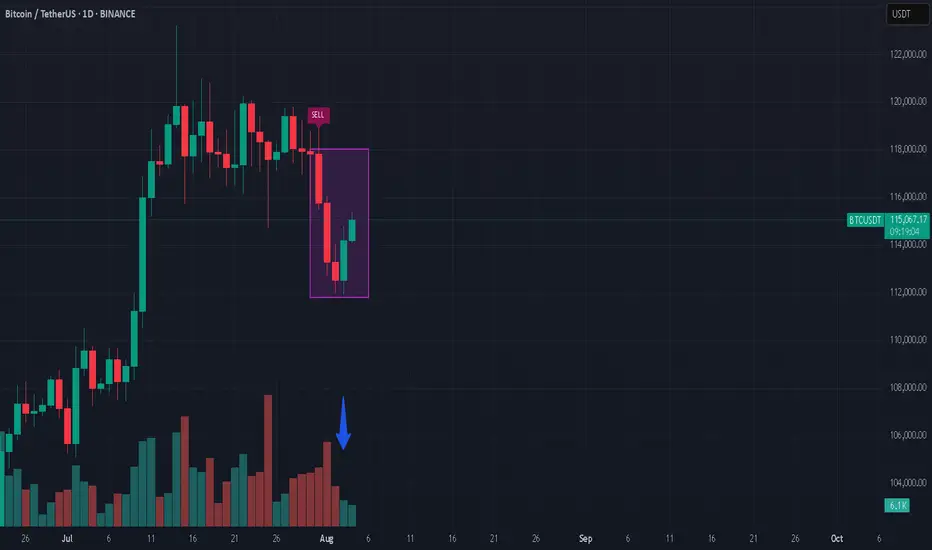
Shorting Bitcoin??Bitcoin had a huge drop, and suddenly shows strength? Well, in my opinion, if you look at the volume, there’s not much strength. I believe it’s going even lower in the short run.
*not investment advice
#bitcoin #crypto #trading
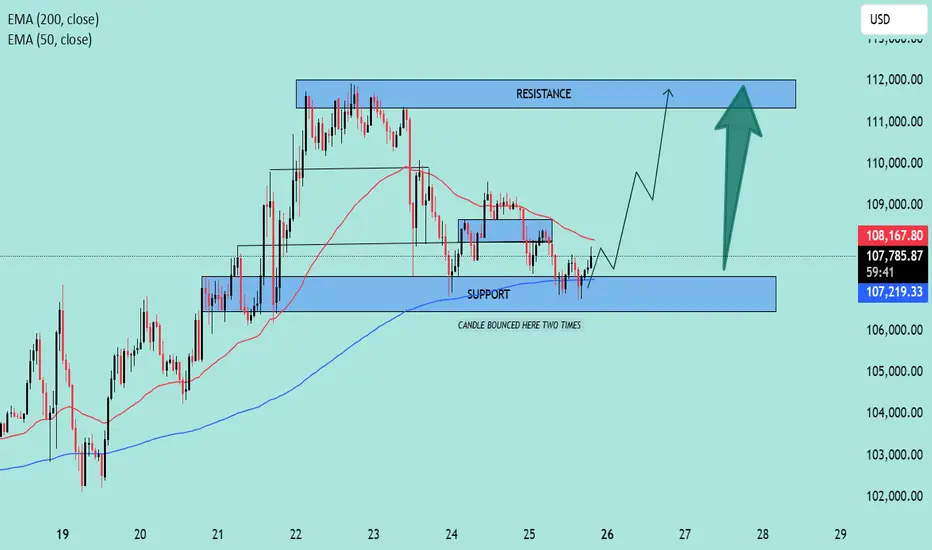
BTC/USD Rebound in Play! | Key Support Holding, Eyes on $112K📊 BTC/USD Technical Analysis
🗓️ Chart Date: May 25, 2025
🔍 Key Levels:
🔵 Support Zone: $106,800 – $107,300
Notably, price bounced twice in this region, indicating strong buying interest.
This area aligns closely with the 200 EMA (currently at $107,213.51), adding further confluence as dynamic support.
🔴 Resistance Zone: $111,800 – $112,300
Previous highs and consolidation make this a significant area where sellers may re-enter the market.
📈 Indicators:
🔵 EMA 200 (Blue): $107,213.51
Acts as a strong dynamic support; price bounced off it recently.
🔴 EMA 50 (Red): $108,182.91
Price is currently below the 50 EMA, suggesting short-term bearish pressure remains until this level is reclaimed.
🧠 Market Structure & Price Action:
After a sharp drop from the resistance zone, price found solid footing at the support zone.
Recent candles show rejection wicks from the downside, hinting at potential bullish reversal.
A breakout above minor consolidation and 50 EMA could trigger a bullish continuation toward the resistance.
📌 Forecast:
✅ If the price holds above the support zone and breaks above $108,200, we can expect a bullish move toward $112,000.
⚠️ However, a failure to break above the 50 EMA could lead to a retest of the support zone.
🧭 Trade Idea (Not Financial Advice):
📥 Long Bias:
Entry: On confirmed breakout above $108,200
SL: Below $107,000
TP: $111,800 – $112,300
📌 Conclusion:
The chart setup suggests a potential bullish reversal 📈 from a key support zone, supported by EMA 200. Watch for a break above the 50 EMA for momentum confirmation.
🧠 Always confirm with volume and wait for confirmation before entering a position.
ETHUSDT pair has formed a set of Equal Highs!Currently, the ETHUSDT pair has formed a set of Equal Highs (EQ Highs) on the chart, indicating the presence of potential liquidity resting above that level. At the same time, there’s some price structure visible on the lower side, suggesting that the market may have created liquidity pools both above and below the current price range. This kind of setup often precedes a significant move.
Recently, the market executed what appears to be a 'Turtle Soup' pattern — a common liquidity grab strategy in which price breaks below a key support or above resistance to trap breakout traders, only to quickly reverse and pump in the opposite direction. Following this pattern, ETHUSDT saw a sharp upward movement, indicating that smart money may have manipulated liquidity to fuel this breakout.
Now , patience is essential. The market has created a visible trendline, and typically, such trendlines attract retail traders who treat them as dynamic support or resistance. However, what often happens is that liquidity builds up around these trendlines, and institutional players later push the price through them to trigger stop-losses or induce panic. It’s likely the market will take out (or 'kill') the liquidity lying along that trendline.
After that liquidity sweep, we’re watching for price to move into a marked Fair Value Gap (FVG) — an imbalance left by a strong move where price didn’t fully fill in. Once the price taps into that FVG, we need to wait for additional confirmation. Ideally, we’d like to see a Market Structure Shift (MSS) or a Change of Character (CHoCH), both of which are strong indicators that the trend may be reversing or forming.
Only after those confirmations should we start considering entering a long position. We can further validate the setup using refined models such as the Unicorn Model, or other entry confirmations like a refined FVG entry, a bullish order block (OB), or breaker block. The goal is to enter the trade when there is a high-probability confluence of signals, not just based on a single indicator.
Once a solid entry setup is confirmed, our targets can be the Equal Highs formed earlier, as they represent resting liquidity which price often seeks. However, it’s crucial not to blindly follow the setup. Observe how the market reacts at each critical level, manage risk properly, and most importantly DYOR (Do Your Own Research) before making any trading decision.

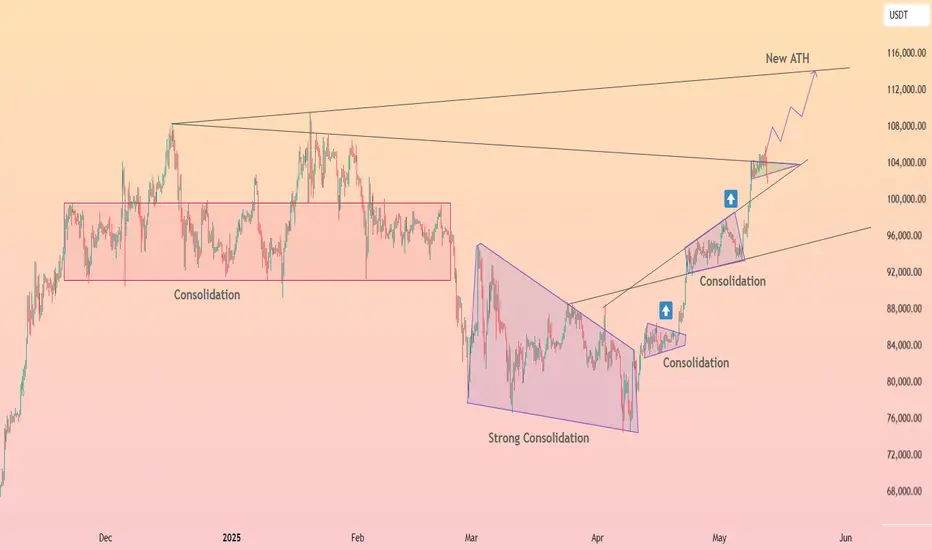
HolderStat┆BTCUSD retest $100 000 level🚀 After a grueling multi‑month consolidation boxed between mid‑90 k and 100 k, BTC finally sliced through its ceiling, confirming a textbook breakout from the rising wedge that grew out of March’s strong consolidation pennant. Price is stair‑stepping higher inside a fresh ascending channel, using 96 k as intraday support and chewing through 100 k supply. As long as this channel stays intact, traders can focus on the mapped path toward the projected new ATH near 115 k.
ETH - When will this downtrend finally stop?Ethereum (ETH) has been stuck in a prolonged downtrend, and the bearish scenario is now playing out. On the 4-hour chart, ETH recently broke below its rising trend line after forming a rising wedge that typically signals further downside. This breakdown confirms the potential for further downside.
At the same time, on the weekly timeframe, ETH has perfectly retested its resistance and failed to push higher, reinforcing overall market weakness. With failing to break resistance it is likely that ETH could face continued weakness and move towards the weekly support area at 1500.
Thanks for your support.
- Make sure to follow me so you don't miss out on the next analysis!
- Drop a like and leave a comment!

$TRUMP Market Update📊 $TRUMP/USDT Market Update
Welcome to today's analysis! Let’s break down the current price action on $TRUMP and what to expect next.
🌐 Overview: $TRUMP Approaching Key Resistance
📉 $TRUMP was in a downtrend after breaking a key support level. Now, the price is approaching the red resistance zone, which was previously a support level before the strong breakdown.
🔄 Current Scenario:
The red resistance zone is a critical level that needs to be broken for a trend shift to bullish.
If $TRUMP successfully breaks above this resistance, it could confirm a bullish trend, with the next target being the blue line level.
However, if price gets rejected, we could see another pullback or consolidation before another breakout attempt.
🔑 Key Levels to Watch
🔴 Resistance Zone: Red Level (Needs breakout to confirm bullish momentum)
🔵 Target Level: Blue Line (If breakout is successful)
🛠️ Trade Scenarios
📌 Bullish Scenario (Breakout Above Red Resistance)
If $TRUMP breaks and holds above the red resistance zone, this would confirm bullish momentum and a potential move toward the blue line target.
📌 Bearish Scenario (Rejection at Resistance)
If $TRUMP fails to break out, we could see a pullback or consolidation, meaning the downtrend could still continue.
📌 Conclusion
$TRUMP is at a key resistance zone—a breakout could confirm a bullish trend, targeting the blue line level, while a rejection may lead to further downside movement. Traders should watch for confirmation before making a move.

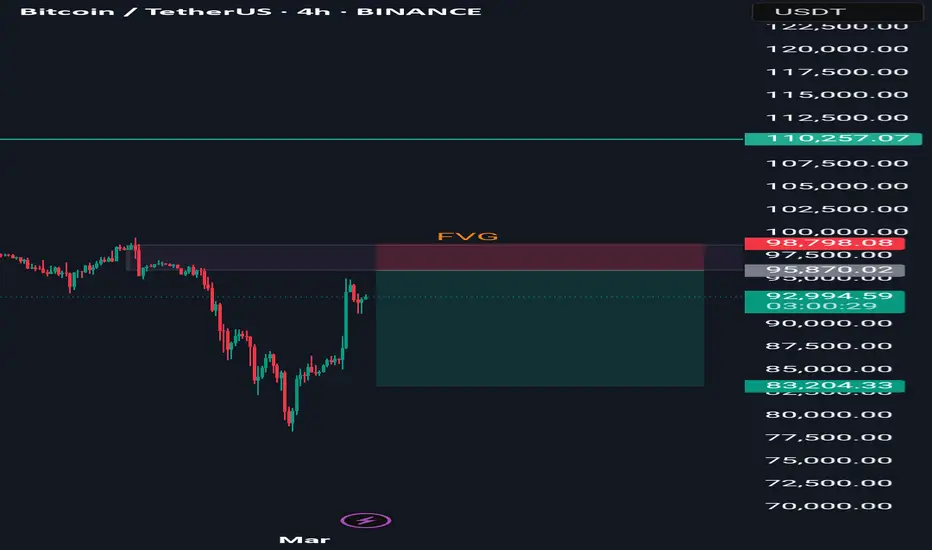
#BTC Short idea, #FVGIn this selling trend, it's a great opportunity to try short from this FVG I have noticed.
I'm going to try with minimum risk. 1:4 RR
Let's see.
COQUSDT: The Market Squeeze—Reversal or Breakdown?COQUSDT at a Turning Point: Is the Bottom in?
COQUSDT is sitting at a critical juncture, hovering near $0.007427, a level that’s still 56% above its all-time low but nearly 89% off its peak. After weeks of sideways action, buy volumes have surged at key points, hinting at possible accumulation. But with RSI (14) at 35.6, are we witnessing the final stages of oversold conditions, or is there more downside ahead?
The 200-day MA looms at $0.010096, far above the current price, showing just how deeply this asset has been discounted. Momentum indicators suggest that COQUSDT is battling heavy resistance at $0.008245, a level that could determine the next leg of movement. The question is: Are bulls strong enough to flip this level into support, or will bears force a retest of the lower range?
With a mix of increased buy-side activity and lingering bearish pressure, the market is at a crucial decision point. Will we see a breakout to test the 100-day MA at $0.009132, or is another sell-off lurking around the corner? Buckle up—this could be the moment traders have been waiting for.
Roadmap: COQUSDT’s Recent Patterns – Are We Seeing a Reversal?
The market never lies—price action is the ultimate storyteller. Over the past few sessions, COQUSDT has been flashing some intriguing signals. Let's break down the key patterns that played out, separating the noise from the real moves.
February 21, 20:00 UTC – Buy Volumes Surge
A major Buy Volumes pattern kicked in as COQUSDT opened at $0.008589 and closed higher at $0.008975, testing resistance near $0.009193. The setup suggested an upward continuation, but was it enough?
February 21, 21:00 UTC – Confirmation of Strength
Bulls doubled down with another Increased Buy Volumes pattern, pushing the close up to $0.009475, hitting a session high of $0.009639. This confirmed the previous signal—buyers were stepping in aggressively.
February 22, 08:00 UTC – VSA Buy Pattern 4 Appears
The formation of a VSA Manipulation Buy Pattern 4th hinted at accumulation. The price action showed a minor retrace before stabilizing at $0.009158. However, the real test was ahead: Would buyers maintain control?
February 23, 13:00 UTC – A Battle at Resistance
A powerful VSA Manipulation Buy Pattern 3rd formed, keeping the buy-side momentum alive. The asset climbed further, closing at $0.009186—almost a direct follow-through from the prior pattern.
February 23, 16:00 UTC – Bears Strike Back
A major shift came as a Sell Volumes Max pattern emerged. The price reversed hard, closing down at $0.008515, marking the first sign of bearish dominance since the rally began.
February 24, 15:00 UTC – Sell Pressure Increases
Following the sell-off, the next candle confirmed more downside pressure with an Increased Sell Volumes pattern. The close at $0.007824 meant the bulls had officially lost their grip—momentum had shifted.
February 24, 16:00 UTC – Buyers Attempt a Comeback
Just when things looked bleak, a Buy Volumes Max pattern emerged. The asset rebounded slightly, closing at $0.007895, attempting to reclaim lost ground.
The takeaway? The buy-side momentum played out correctly up until February 23, proving that the earlier bullish patterns were accurate indicators of the rally. However, the sell signals on February 23-24 completely flipped the script, showing how fast sentiment can shift.
What’s Next? If buy volumes continue to build, we could see another attempt at breaking resistance around $0.008245. But if the sellers maintain control, expect further downside pressure. Stay sharp—this market is moving fast.
Technical & Price Action Analysis: Key Levels to Watch
Levels don’t lie—price respects structure, and smart money knows where liquidity is stacked. Here’s the real deal on support and resistance for COQUSDT. If a level doesn’t hold, expect it to flip into a new battlefield for bulls and bears.
Support Levels:
$0.005691 – First line of defense. If buyers don’t step in, we could see a deeper dive.
$0.00551 – The last standard support before things get ugly. A break below could open up a liquidity grab.
Resistance Levels:
$0.008245 – Immediate ceiling. Needs a strong push to flip bullish.
$0.009099 – A key decision point. Rejection here and sellers will pile in.
$0.010465 – A major pivot area. Break and hold above? We’re talking trend shift.
$0.011432 – Bulls need to own this level for sustained momentum.
$0.012347 – The breakout zone. If we see clean closes above, the game changes.
Powerful Support Levels:
$0.01302 – The fortress. If COQUSDT ever gets back above this, it’s game on for bulls.
Remember: If these supports fail, they become resistance. That’s how price action works—liquidity zones shift, and traders reposition. Watch the reactions, manage risk, and don’t get caught on the wrong side of the play.
Trading Strategies Using Fibonacci Rays
Understanding price action means reacting to movement, not predicting levels. My proprietary Fibonacci Rays method helps identify dynamic zones where price interacts before making its next big move. Each ray serves as a pivot, defining whether price rejects or continues.
These rays are already drawn on your chart, intersecting with VSA patterns and Moving Averages, giving you a structured roadmap for trades. Let’s break down the possible scenarios:
Optimistic Scenario: Breakout & Trend Continuation
If COQUSDT interacts with a key ray and confirms bullish movement, we ride the trend from one ray to the next, securing targets along the way.
Long Entry: Above $0.008245 (First Resistance)
Target 1: $0.009099
Target 2: $0.010465
Target 3: $0.011432 (Major trend shift)
Invalidation: Below $0.008000 (Rejection from ray)
Aggressive Long: If price reclaims MA50 ($0.008452)
Target 1: $0.009132 (MA100)
Target 2: $0.010096 (MA200)
Invalidation: Close below MA50 with volume spike
Pessimistic Scenario: Rejection & Trend Weakness
If price interacts with a ray but fails to confirm strength, we look for short opportunities targeting the next dynamic level.
Short Entry: Below $0.008245 (Failed breakout)
Target 1: $0.007427 (Current support)
Target 2: $0.005691 (Deeper correction zone)
Invalidation: Close above $0.008500 with strong momentum
Breakdown Short: If price loses MA50 and MA100 together
Target 1: $0.00551 (Final major support)
Invalidation: Price reclaims MA100 & MA50 with buy volume
💡 Key Takeaway: Positions should be taken only after price interacts with a ray and confirms movement. No blind entries—wait for market structure to guide you. Every ray crossover is a checkpoint, where price moves from one level to the next, giving traders a clear trade flow.
What’s Next? Let’s Talk Strategy!
Trading is all about understanding key reaction zones—that’s why I lay everything out before price makes its move. If you found this breakdown useful, make sure to Boost this idea and save it—check back later and see how price respects the levels. That’s how you sharpen your edge in the market.
Got questions? Drop them in the comments! I always check and reply when I can. Let’s discuss setups, levels, or anything that needs clarification.
My Fibonacci Rays indicator does all the heavy lifting—mapping levels and rays automatically. It’s Private, but if you’re interested in using it, shoot me a DM.
Want a breakdown for your favorite asset? I can analyze any chart—some ideas I post for free, while others we can discuss privately. If you have something specific in mind, let’s talk!
And remember—these rays work on ANY asset. If you want me to chart a specific one, hit Boost and drop a comment—I’ll get to it when I can.
If you’re not following me yet, now’s the time. Stay ahead of the market with my latest updates right here on TradingView. 🚀

1000000MOG: Is This the Last Chance to Buy Before a Breakout?The Moment of Decision: 1000000MOGUSDT at a Pivotal Crossroad
The crypto market is never short on surprises, and 1000000MOGUSDT is now in the spotlight. After tumbling 81.6% from its all-time high of $4.0531, the asset is showing signs of an imminent shift. Currently trading at $0.7458, it hovers near key resistance at $0.7693—a critical level that could define its next big move.
Technically, RSI (14) sits at 42.18, hinting at a potential reversal from oversold conditions. Meanwhile, MFI (60) has risen to 58.03, signaling increasing buying pressure. But is it enough for a breakout?
Recent VSA Buy Patterns suggest institutional accumulation, while yesterday's sell-off exhausted downward momentum. The battle between bulls and bears is heating up, and the next few sessions could set the tone for the coming weeks.
Could this be the final dip before an explosive move? Or will bears push it deeper into uncertainty? The answer lies in the price action around $0.7693—a breakout could bring a swift rally toward $0.8465 and beyond. Are you ready for what comes next?
1000000MOGUSDT Roadmap: The Pattern Trail to a Breakout
The market never moves in a straight line—it’s a battle of bulls and bears, and 1000000MOGUSDT is no exception. Let’s break down the key patterns that have shaped the recent price action, focusing only on those that played out as expected.
Feb 21, 17:00 UTC – Sell Volumes Max (Main Direction: Sell)
The heavy sell-off at $0.7875, closing at $0.7571, set the stage for a bearish move. The next pattern confirmed this sentiment, as buyers failed to regain control, pushing the price further down.
Feb 22, 18:00 UTC – VSA Sell Pattern 4 (Main Direction: Sell)
The textbook bearish setup worked like a charm. The price opened at $0.7996, attempted a push higher to $0.8191, but ultimately closed lower at $0.7870. This confirmed sellers’ dominance, setting the tone for further downside.
Feb 23, 15:00 UTC – Increased Sell Volumes (Main Direction: Sell)
Sell pressure kept building, with the price opening at $0.7823 and dropping to $0.7539. This was another clean confirmation that sellers were running the show.
Feb 24, 04:00 UTC – Sell Volumes Max (Main Direction: Sell)
Another bearish wave sent the price down to $0.7429, hitting a low of $0.7350. At this point, the market was looking oversold, but without a strong reversal pattern, buyers had no reason to step in.
Feb 24, 05:00 UTC – Sell Volumes Take Over (Main Direction: Buy)
Finally, a shift. The market bounced from $0.7383 to $0.7663, marking the first real attempt by buyers to flip the script. This pattern suggested a potential trend reversal—but was it enough?
The verdict? The last confirmed buy signal indicates that 1000000MOGUSDT may have hit a local bottom. With resistance looming at $0.7693, a breakout above this level could trigger a trend reversal, bringing bulls back into the game.
Technical & Price Action Analysis
When it comes to 1000000MOGUSDT, the game is all about key levels. Respect them, and you ride the wave. Ignore them, and you're swimming against the current. Here's what matters right now:
Resistance Levels:
$0.7693 – First major barrier; a breakout here could confirm bullish strength.
$0.8465 – If buyers take control, this is the next checkpoint.
$1.0149 – A key psychological level, marking a major shift in momentum.
$1.4334 – If we get here, expect serious volatility.
$1.9514 – The final boss before reclaiming lost highs.
Powerful Resistance Levels:
$0.5326 – If the market tanks, this level flips to a strong resistance on any rebound attempt.
Support Levels:
Watch for potential bounces, but if these levels don’t hold, they turn into resistance real quick.
Powerful Support Levels:
$2.1798 – A level too far now, but if we ever reclaim it, the game changes entirely.
Bottom line: if $0.7693 gives way, $0.8465 is on the radar. But if we break down, $0.5326 could become a serious problem for any recovery. Stay sharp, follow the levels, and trade with conviction.
Trading Strategies Using Rays: Optimistic & Pessimistic Scenarios
Concept of Rays: The market is a living system, and price moves dynamically within it. My proprietary method uses Fibonacci-based rays, which create adaptive levels that predict interactions between price and key zones. These rays don’t provide a static price target but act as guides—once price interacts with a ray, we wait for dynamic confirmations (patterns, volumes, and price action) before making a trade. Each movement extends from one ray to another, forming a structured, mathematically predictable path.
Optimistic Scenario: Bullish Movement from Support
If price confirms support at a key level and interacts positively with a VSA ray, we look for a continuation upward:
Entry: Buy on a strong bounce from $0.7458 with confirmation from VSA patterns.
First Target: $0.7693 (first major resistance & ray intersection).
Second Target: $0.8465 (continuation if the first breakout holds).
Third Target: $1.0149 (strong psychological level, potential liquidity grab).
Dynamic Factors Supporting the Trade:
Moving Averages (MA50: 0.783, MA100: 0.7757, MA200: 0.7807) act as additional resistance points—watch for price interaction at these levels before continuation.
RSI (42.18) is still in a neutral zone but could flip bullish if price holds above MA100.
MFI (58.03) suggests growing demand, adding strength to a breakout.
Pessimistic Scenario: Bearish Breakdown Below Support
If price fails to hold key levels, sellers regain control, and we shift to a shorting mindset:
Entry: Short after rejection from $0.7693, confirming downward momentum.
First Target: $0.7458 (previous support turned resistance).
Second Target: $0.5326 (historical powerful resistance that could flip to strong support).
Third Target: $0.4999 (absolute low, potential liquidity hunt).
Dynamic Factors Confirming the Short Trade:
Failure to break MA100 and MA200 signals continued bearish trend.
RSI below 40 would confirm oversold conditions, increasing downside pressure.
If volume spikes on a breakdown, it suggests institutional distribution rather than weak hands selling.
Key Trading Playbook
Buy on confirmed interaction with a bullish ray at $0.7458, ride to $0.7693.
Sell if price rejects $0.7693 with weak volume—target $0.7458 or $0.5326.
Breakout trade: If $0.8465 is taken out with momentum, next stop is $1.0149.
Short if price collapses under $0.7458, aiming for $0.5326.
Bottom line: Every move starts with a ray and follows a ray. Let the price confirm the interaction, then ride the wave.
Call to Action: Let’s Talk Trading!
Alright, traders, now it’s your move! 🚀 If you have questions, insights, or just want to discuss the setup, drop a comment below—I read everything and respond when I can. Let’s break this market down together!
🔥 Hit that Boost and save this post to check back later—watch how price respects the levels and rays in real time. Trading is all about understanding key reaction zones, and if my analysis helps you see them clearer, that’s already a win.
My ray-based strategy automatically plots all key levels based on price action and Fibonacci principles. It’s available only in Private, but if you’re interested in using it, send me a direct message, and we’ll talk.
Need analysis on another asset? No problem. Some things I post publicly, others—if you prefer—stay private. Just let me know what you’re looking for, and we’ll figure it out.
My rays work on any asset, and price moves according to them—it’s just how the market flows. If you have a specific ticker you want mapped out, Boost this post and drop it in the comments—I’ll get to it as time allows.
And don’t forget to follow me here on TradingView—this is where I post my setups, updates, and market insights. Let’s trade smart. See you in the comments! 📈🔥

FWOGUSDT: Approaching the Turning Point – What’s Next?FWOGUSDT is trading at $0.12006, hovering just above its absolute low of $0.11783, established only hours ago. This marks a staggering -84.6% retreat from its absolute high of $0.78189, reached just 72 days prior. With RSI14 dipping to 29.42, the asset is entering oversold territory, raising the stakes for a potential reversal or a continuation of the bearish trend.
A surge in sell volume, as confirmed by recent VSA patterns, highlights increasing market activity amidst uncertainty. The asset is also testing critical resistance at $0.13946 while struggling to break above the 50-day moving average of $0.15193, emphasizing the importance of this consolidation phase.
Is the market setting the stage for a bullish rebound or bracing for deeper lows? With macroeconomic factors such as volatile liquidity conditions and heightened market sentiment, the next move could offer opportunities for both traders eyeing quick scalps and investors seeking long-term positioning.
The big question remains: Are you ready to seize the moment, or will this opportunity pass you by? Stay tuned as we dive deeper into the technicals and strategies for this critical juncture.
Roadmap: Tracing FWOGUSDT’s Path Through Pattern Dynamics
FWOGUSDT has had a whirlwind of activity in recent trading sessions, as highlighted by a sequence of critical patterns. Below, we’ve broken down the roadmap of these patterns in order of their emergence, filtering only the ones that delivered accurate directional moves based on the previous pattern’s main direction.
Pattern 1: Increased Sell Volumes (Jan 21, 18:00 UTC)
The market initiated a significant sell wave, closing at $0.21192 after an open of $0.22732, marking a notable drop. The main direction was clearly bearish, and this pattern laid the groundwork for subsequent sell-offs.
Pattern 2: Buy Volumes Takeover (Jan 23, 20:00 UTC)
Despite a brief bullish attempt that pushed the price to a high of $0.16481, the market turned back to bearish territory, aligning with the previous sell-off. This confirms the direction set earlier, showing the strength of sellers.
Pattern 3: VSA Buy Pattern Extra 1st (Jan 25, 00:00 UTC)
Here, the market attempted a reversal, with a closing price of $0.12599 and a high of $0.13648. While buyers showed strength, the follow-through failed as the price closed lower in subsequent sessions. This indicates the struggle of bulls to reclaim control.
Pattern 4: Increased Sell Volumes (Jan 25, 02:00 UTC)
The most recent sell-off, aligning perfectly with the earlier bearish direction, confirms the dominance of sellers. With a low of $0.11783, FWOGUSDT reached its absolute bottom. This marks a critical juncture for traders.
Key Takeaways
The bearish trends dominated, with multiple sell patterns confirming the overall downtrend.
Bullish patterns showed potential but failed to break critical resistance, indicating weak momentum.
The most recent bearish breakout to $0.11783 highlights the market’s vulnerability at these levels.
What’s Next?
Investors and traders should watch for sustained price action at critical support zones. Will the bulls finally stage a comeback, or is more downside ahead? Follow the roadmap to stay in tune with the market's rhythm!
Technical & Price Action Analysis: Key Support and Resistance Levels
When it comes to navigating the FWOGUSDT price action, the key levels below are your bread and butter. Let’s break it down:
Support Levels
These zones are where buyers are likely to step in. If the market doesn’t respect these, expect them to flip into resistance faster than you can blink:
$0.11783 – This is the absolute low. If broken, we’re diving into uncharted waters.
$0.29444 – A strong psychological area to watch if prices stage a rally from current levels.
Resistance Levels
Here’s where sellers are holding their ground. Break these, and the bulls might just get the upper hand:
$0.13946 – The first line of fire for any upward push.
$0.19064 – A significant hurdle for medium-term bulls.
$0.23757 – Beyond here, the market might just start cooking.
$0.25695 – The final boss level for this structure.
Powerful Support Levels
These are your safety nets if the market wobbles. But if they give way, you’re looking at resistance zones in the making:
$0.29444 – Not just a level, but a fortress for the bulls to defend.
Powerful Resistance Levels
While none were detected in this cycle, keep an eye on the levels above as potential magnets for price.
Pro Tip: If these levels don’t play out, the market could be flipping the script, turning support into resistance or resistance into support. Keep your eyes peeled and trade smart!
Trading Strategies Using Rays: Optimistic and Pessimistic Scenarios
The "Rays from the Beginning of Movement" concept provides traders with dynamic levels derived from Fibonacci principles. These rays form a predictive framework, guiding price action from one ray to the next. Interactions between rays and moving averages (MAs) further confirm key market zones. Let’s dive into the strategy.
Concept Overview
Rays and Fibonacci: Rays are constructed at precise angles that correlate with the start of a trend.
Dynamic Levels: The rays adjust to new patterns, providing an updated roadmap for price movement.
Key Interaction Points: Trade entries are based on price reactions to rays, confirmed by interaction with MAs.
Directional Flow: Price moves from one ray to the next, making each ray a potential trade target.
Scenarios and Strategies
Optimistic Scenario
This assumes the price successfully interacts with a ray, confirming bullish momentum.
Initial Entry Point: Interaction at support ray near $0.11783 (absolute low).
First Target: $0.13946 (next ray and first resistance level).
Second Target: $0.19064 (medium-term ray resistance).
Confirmation Tools: Price above MA50 ($0.15193) signals upward momentum.
Pessimistic Scenario
In this scenario, the price interacts with a resistance ray and begins to reverse, confirming bearish sentiment.
Initial Entry Point: Rejection at resistance ray near $0.13946.
First Target: $0.11783 (absolute low and ray support).
Second Target: $0.29444 (long-term powerful support zone, now acting as resistance).
Confirmation Tools: Price below MA50 ($0.15193) reinforces a downward trend.
Suggested Trades
Bullish Trade Idea :
Enter long at $0.11783 after confirmation of ray support and MA interaction. First target $0.13946, with stop-loss below $0.11700.
Bearish Trade Idea :
Enter short at $0.13946 upon rejection. First target $0.11783, with stop-loss above $0.14000.
Scalp Trade Idea :
Trade between $0.13946 and $0.19064 for quick profits within the ray structure, confirming movement via the MA50.
Final Thoughts
Dynamic rays and MAs act as a dual system for identifying actionable trades. Always enter after a confirmed interaction and let the price move between rays for optimal profit opportunities. Adapt to new ray formations and keep an eye on volume surges for added confirmation. This strategy offers precision for both cautious and aggressive traders.
Your Feedback and Ideas Matter!
Hey traders, thanks for taking the time to explore this analysis! If you’ve got questions or ideas, don’t hesitate—drop them in the comments. I love seeing your thoughts and will do my best to respond to everyone.
If this idea resonates with you, hit Boost and save it to your favorites so you can revisit it later and track how the price moves along my levels. This is the cornerstone of successful trading—understanding the points where trades can be made with confidence.
For those curious about my indicator-strategy, it automatically plots all the rays and levels, simplifying your analysis. While it’s available privately, feel free to DM me if you’re interested in using it—I’m happy to share details.
Need a custom analysis for your favorite asset? Let me know in the comments! I’m open to doing some for free and posting them here, or working on something private if you’d prefer to keep your ideas exclusive. The rays work on any asset, and I can craft a personalized layout just for you.
And of course, if you’d like to see more of my work, follow me here on TradingView. This is where I post all my articles and strategies, so don’t miss out!
Trade smart, stay curious, and let’s keep the conversation going! 💬📊

NEARly all crypto charts look like this right nowI just looked at easily 50+ charts that all look pretty much identical to this chart. There is a good chance whatever one does, the others will follow mostly. If there is a break out, there should be systematically, dozens of breakouts that can be jumped on, all happening at varying times within a short time frame. Similarly, could be a pretty big broad market pull back where we should be hunting support lines to buy the dip. Here is general analysis on the chart.
Structure and Price Action:
Rising Wedge Breakdown:
The chart shows a clear rising wedge pattern that has broken down decisively. Rising wedges are bearish patterns, and this confirms further downside potential.
Downward Red Trendline:
A clear descending resistance line has now formed, rejecting price attempts to climb higher.
The recent price action shows consistent lower highs, reinforcing bearish momentum.
Consolidation Zone:
Price is currently consolidating near the $6.8 level, where it is testing both horizontal and diagonal support zones.
Support and Resistance:
Immediate Resistance: $6.9–7.0 (aligned with the descending red trendline and EMA resistance).
Key Support Levels:
$6.5: Current short-term support.
Below $6.5: Next support around $6.0 and $5.5, where historical levels exist.
Indicators:
Moving Averages (EMA 20/50/100/200):
Price is below the EMA 20 and EMA 50, which confirms short-term bearish sentiment.
The EMA 100 and 200 are flattening around $6.9–7.0 and acting as strong resistance.
Money Flow Index (MFI):
49.24 indicates neutral momentum, suggesting there’s room for a move either up or down, depending on breakout direction.
Stochastic RSI:
The Stoch RSI has just crossed upward from oversold territory, indicating a possible short-term bounce but not yet a reversal signal.
If price fails to reclaim higher levels, this could be a false signal.
Volume:
The volume during the most recent downward move remains relatively high, confirming bearish pressure.
Current low volume during the consolidation suggests indecision and potential for a breakout.
Pattern Analysis:
The combination of the rising wedge breakdown and the descending trendline suggests that bearish pressure is dominant.
Current price action resembles a bearish pennant or continuation pattern within the broader downtrend.
Probabilistic Outlook:
Bearish Continuation (Primary Scenario):
If price fails to reclaim $6.9–7.0 and breaks below $6.5, further downside is likely.
Key downside targets:
First Target: $6.0
Second Target: $5.5–5.3
Short-term Bounce (Less Probable):
If Stochastic RSI momentum and MFI push price above the descending trendline (~$7.0), a short-term recovery may occur.
Key upside targets:
First Resistance: $7.0–7.2
Second Resistance: $7.5
Key Signals to Watch:
A breakdown below $6.5 = Bearish confirmation.
A breakout above the descending red trendline (~$6.9–7.0) = Short-term bullish reversal.
Volume will confirm the breakout or breakdown direction.
Conclusion:
The chart remains bearish overall, with a high probability (~65–70%) of further downside unless price breaks the descending trendline with conviction.

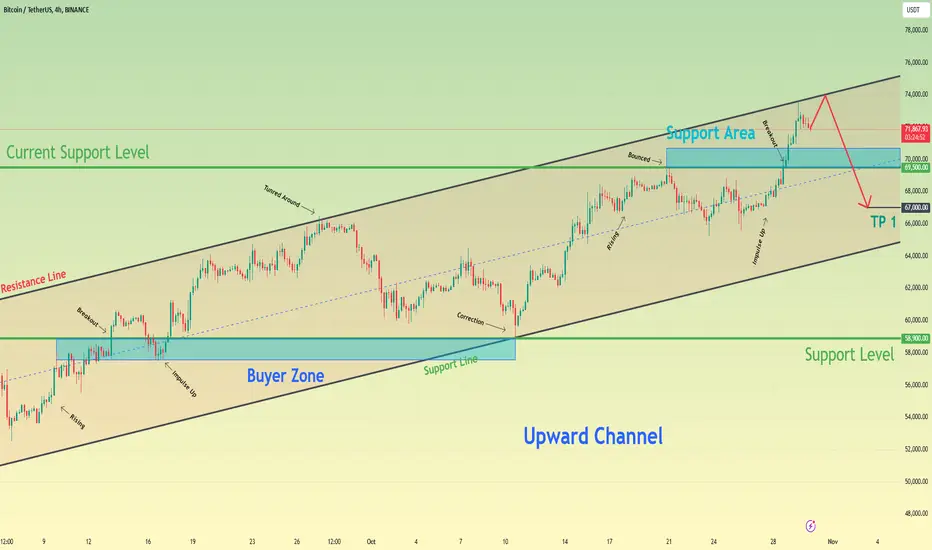
Bitcoin can reach resistance line of channel and start to fallHello traders, I want share with you my opinion about Bitcoin. Observing the chart, we can see how the price some days ago entered an upward channel, where at once it made little correction and then rose to a support level, which coincided with the buyer zone. Then BTC broke this level, after which made a correction to the buyer zone, and then BTC made an impulse up to the resistance line of the upward channel. After this movement, the price turned around from this line and then started to decline to the 58900 support level, which coincided with the support line of the channel. Later BTC rebounded and continued to move up inside the upward channel and some time later reached the current support level, which coincided with the support area. Price rebounded from this level and made a correction below, after which made an upward impulse to the resistance line of the channel, thereby breaking the 69500 level. But a not long time ago it started to decline, therefore I think that BTC can grow to the resistance line and then drop below a current support level, breaking it and continuing to decline. For this case, I set my TP at 67000 points. Please share this idea with your friends and click Boost 🚀
Litecoin to $2,200I believe Litecoin will reach $2,200, which is approximately a 22x increase. The chart shows a large triangle pattern, and I’m expecting significant growth.
- Dalin Anderson

BTC/USDT Daily Chart Analysis:!!
The chart shows that BTC/USDT is trading within a descending wedge pattern, with price action consistently testing the lower boundary of this pattern.
The price is currently sitting at a crucial support level of around $52,408, represented by the green trendline and the horizontal yellow line, which has served as a historical support area.
Support and Resistance Levels:
Immediate support is around $52,408. A break below this level could lead to a retest of lower support near the $50,000 psychological level or potentially lower.
The nearest resistance is the upper boundary of the descending wedge, followed by horizontal resistance around $66,000.
Possible Scenario:
A strong bounce off the current support level around $52,408, followed by a breakout above the upper boundary of the descending wedge, could signal a bullish reversal. A breakout above $66,000 would confirm a strong uptrend continuation.
If BTC fails to hold the support at $52,408, we could see increasing selling pressure, pushing the price down towards the next support level.
A head and shoulders pattern formation was completed earlier, indicating a bearish signal that appeared in the downward movement.
Currently, the descending wedge pattern is typically a bullish reversal pattern; thus, a breakout to the upside would align with the usual outcome of this pattern.
Monitoring volume is essential; a breakout with a strong volume would validate the move.
Oscillators such as the RSI and MACD would provide further confirmation; look for an oversold signal on the RSI or a bullish crossover on the MACD.
Manage risk with stop-loss levels below current support if bullish, or slightly above the upper boundary of the wedge if a continued bearish move is expected.
This analysis suggests that BTC is at a pivotal point, with significant upside potential depending on the integrity of the support level. Keep an eye on volume and price action near key levels for cues to the next major direction.
Disclaimer: This is not financial advice. Stay updated with market movements and adjust your trading strategy accordingly. Keep an eye out for further updates and analysis. Thank you!
