BTC/USDT Weekly Chart !!BTC/USDT Weekly Chart
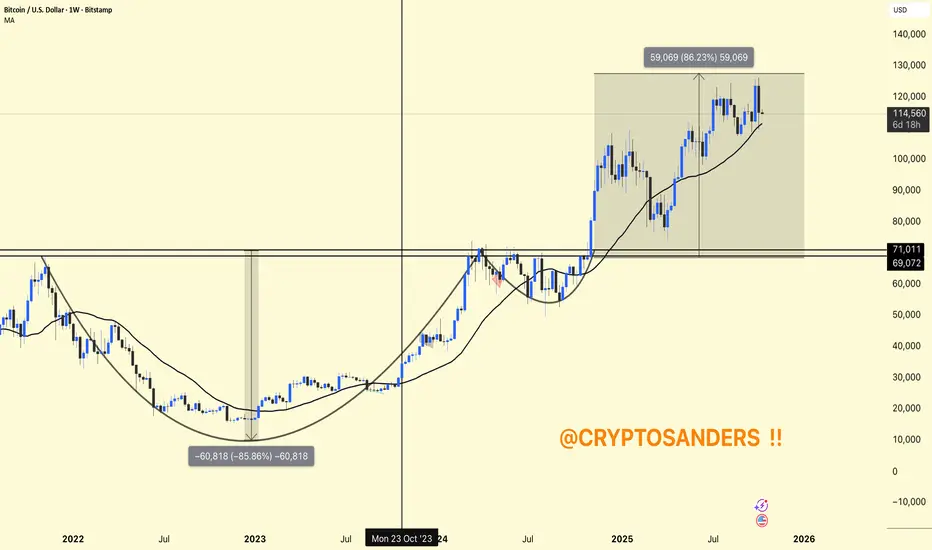
Structure: The chart shows a complete market cycle – a deep correction (approximately -85%), followed by a strong recovery and breakout.
Current Area: Bitcoin is trading around $114K–$115K, holding above the 111K weekly MA (support).
Previous Resistance: The $69K–$71K area (old ATH) has now turned into a strong support zone.
Upward Momentum: From the breakout point (~$71K) to the recent high (~$130K), BTC gained approximately +86%, indicating strong bullish momentum.
Perspective: As long as the price remains above the $111K MA and does not lose support at $100K, the overall trend will remain bullish, and a retest of $130K–$135K is possible.
DYOR | NFA