Bitcoin Daily, Something for the weekend Sir / Madame ?This will be the main chart and 3 indicators that could be telling us something.
Main chart is the Heiken Ashi. Each candle starts in the centre of the previous one and so we get rid of noise and get a good understanding of possible Trends.
And Right now, CALM is not the word ! Candles are getting smaller and smaller.
However, we do seem to be forming a bullish pennant with an Apex at the end of the month.
PA always reacts before the Apex.
Other things to note here is that we are now using the previous line of resistance as support. Look back to Dec 2024 to Feb 2025. It was this line that put as back down to 75K
We have tested this 4 times in a small way But not in a real Meaningful Way yet.
Do remain Cautious.......but that 2.518 Fib extension should hold us in place if we drop but there could be a much deeper drop.
But lets take this step by step as there are some Very Bullish signs to.
The ADX chart below shows us that Change is near.
Remember, ADX ( yellow ) NEVER shows trend direction, just trend strength. As you can see, it rarely drops much further below this point and does not spend to long here.
SO, current trend is Weak and a new trend is likely in the near future ( this could be tomorrow or in 3 weeks..near future is a wide window..but it is not 2 months or more)
The DI + ( orange ), positive Directional price Index, and the DI - ( red) , negative Directional price Index, are also low, showing no real price action.
This can happen for longer periods of time and it is impossible to say which will rise, However, as we can see, the price movements have not been huge and so to expect a sudden Massive Dive, as some are suggesting, is not really backed by anything.
But we should never say never. Be cautious
Accumulation / Distribution chart below
What is nice about this, is simply that Accumulation is still the MAJOR movement. The majority are still accumulating and so the idea that we maybe in a Bear market is almost Dismissed. People would not accumulate an asset that is about to Dive for a long eriod of time....Normally.
There has been distribution, as marked by the RED zones. This is heavier distribution and as you can see, this Stopped at the beginning of this month, having begun when we reached the high towards end of 2024.
So many thought that was cycle ATH
They have seen the error of their ways BUT, Again, remain Cautious till we see a bigger move higher.
And now my favorite, MACD
And for me, this is where we will see the decision being made. We are approaching the Neutral zone
Last time we bounced off this area was in October 2024 and we went from 70K to 109K
BUT remain cautious, we have every possibility that we may fall through the neutral zone for a while too....But we are in an area that could show us a time to move.
This is a LINEAR Bitcoin Daily chart
And those descending lines are FIB Circles and you can see how PA often runs along them.
You can also see how we are in a Pinch, a tight Squeeze right now ( arrow) with Horizontal line of support and the rejecting red 236 Fib circle.
That Apex is, again, at the end of the month.
So, to conclude, we are certainly heading towards a Move and possibly a new trend.
I like to think this will be Bullish but there are plenty f reasons for Caution.
I will remain with my Monthly charts that suggest June may be RED and that after than we will see more Green.
A Dip is possible and I have New Buy orders around 98K incase PA wicks down to them but there is NO guarantee this will happen...OR if it does, that it will stop there....
We just have to be prepared.
Stay safe
Cryptoanalysis

Litecoin Confronts $86.0 Resistance as Overbought Signals EmergeFenzoFx—Litecoin is testing $58.99, which aligns with a 4-hour bearish Fair Value Gap. Stochastic reads 84.0, suggesting overbought conditions.
If $85.99 resistance holds, a bearish move toward $84.19 and possibly $81.01 could follow.

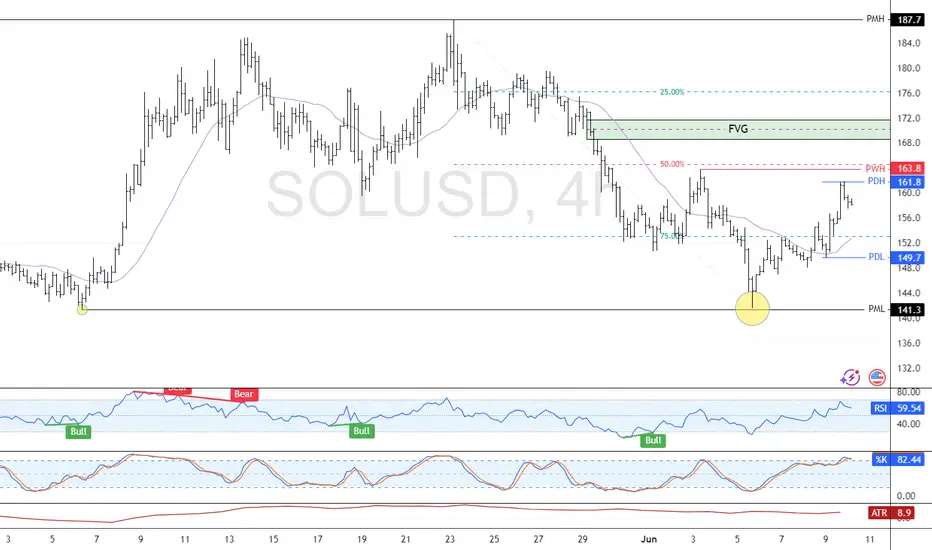
SOLANA Eyes Recovery After Retesting Monthly LowFenzoFx—Currently, SOL/USD trades at approximately $148.37, testing the previous monthly low, which aligns with a bullish fair value gap and is backed by a high-volume node area.
A close and stabilization above $149.3 can spark the uptrend. In this scenario, the next bullish target could be the $168.38 resistance.

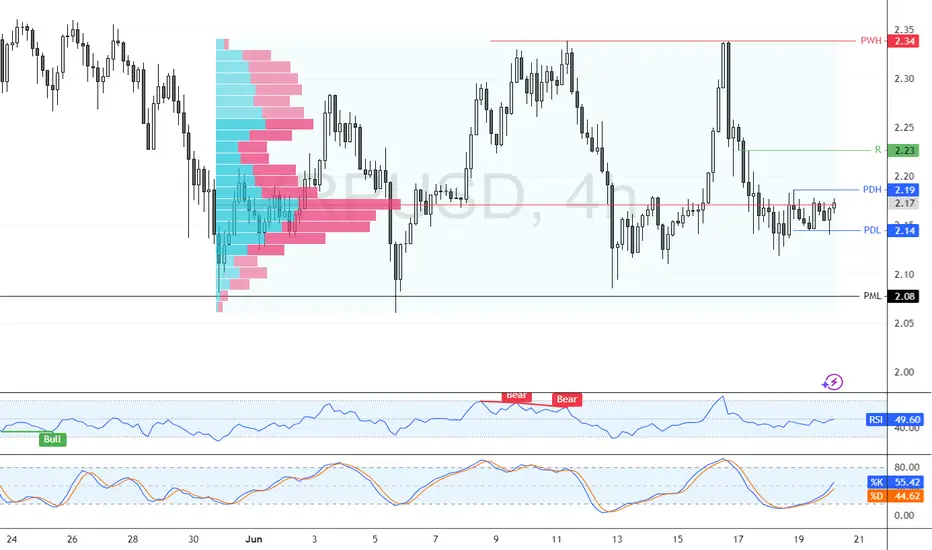
XRP Builds Bullish Outlook as $2.08 Support Holds StrongFenzoFx—XRP bounced from $2.14 and trades near $2.17, approaching resistance at $2.19. The market remains bullish above the $2.08 critical support. A close above $2.19 could lead to targets at $2.23 and $2.24.
The bullish outlook is invalidated if XRP/USD closes below $2.08.
Ethereum Rejected By Strong Resistance, A Bearish OutlookFenzoFx—Ethereum is consolidating around $2,525 after being rejected by the $2,813.0 resistance, a strong supply zone. Immediate support lies at $2,446.0. If ETH closes below this level, a move toward $2,080 is likely.
The bearish outlook is invalidated if ETH stabilizes above $2,813.0.

SUPER Long Setup – Confluence of Fibonacci and Major SupportSUPER has retraced into a strong confluence zone, aligning with the 61.8% Fibonacci level and a major support area. The $0.55–$0.58 range offers a solid opportunity to enter a long swing trade.
📌 Trade Setup:
• Entry Zone: $0.55 – $0.58
• Take Profit Targets:
o 🥇 $0.75 – $0.90
o 🥈 $1.05 – $1.20
• Stop Loss: Daily close below $0.50

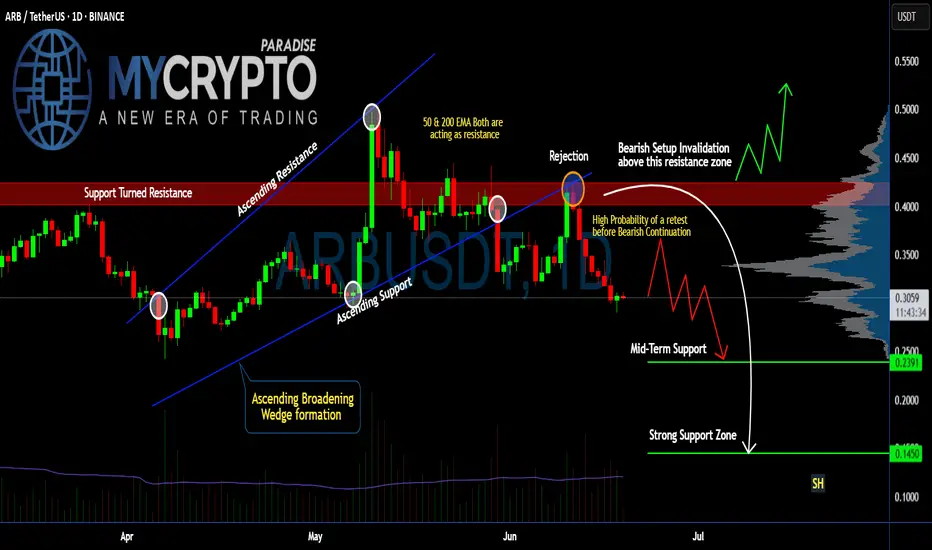
Is #ARB Ready For a Recovery or will it continue to Fall? Yello Paradisers! Are you watching #ARBUSDT closely or not? Let's look at the latest #Arbitrum trading setup and what could be next for it:
💎#ARB just completed a breakdown from an Ascending Broadening Wedge. This breakdown has made the previous support into the resistance after the price rejection. Currently, there is a high probability that #ARBUSD might do a retest before continuing downward.
💎After the wedge breakdown, price got rejected hard from the $0.39–$0.42 resistance zone, where both the 50 EMA and 200 EMA are now stacked against the bulls, acting as strong dynamic resistances. This confluence of resistance increases the probability that this level won't be reclaimed easily. The setup is clearly bearish unless invalidated above $0.42.
💎We’re seeing a lack of follow-through on the bounces, which signals hesitation and likely a trap for late buyers. As long as we remain below the resistance block, the next logical move is a retest of mid-term support at $0.2391.
💎But it doesn't stop there. If this mid-level gives in — and the structure suggests it might — the next area to watch is the $0.1450 zone, a strong historical support and the first place we expect real buyers to step in. This could be the level where a high-probability reversal finally sets up.
Trade smart, Paradisers. This setup will reward only the disciplined.
MyCryptoParadise
iFeel the success🌴
Bitcoin Cash Rebounds from $456 as RSI Shows Bullish DivergenceFenzoFx—Bitcoin Cash swept liquidity below $456.0 during NY midnight and is now rising around $464.0. RSI 14 signals bullish divergence, suggesting growing momentum. If BCH holds above $456.2, it could target $472.0 and potentially $481.2.
The bullish outlook is invalidated if BCH stabilizes below $456.0.

Bitcoin Bounced from a High-Volume Area at the 103,363 Support.FenzoFx—Bitcoin dipped to $105,175, creating a bearish fair value gap that highlights selling pressure. Immediate support is at $103,463, backed by high volume, while resistance stands at $107,792. If support holds, BTC/USD could rise toward $112,000.
A drop below $102,185 may accelerate the downtrend toward $93,363, the previous monthly low.

LTC/USD Consolidates—Key Levels to Watch FenzoFx—Litecoin consolidates near $85.0, with key support at $81.0, aligning with last week's low. If support holds, LTC/USD could target $90.4. A drop below $81.0 invalidates the bullish outlook.

Is #ETC Ready For a Breakdown or Will it Recover From Here? Yello Paradisers! Have you checked what’s unfolding on #ETCUSDT lately? Let's look at the latest moves of #EthereumClassic:
💎#ETC has been trading inside a descending triangle for weeks, and once again, it failed to break above its strong descending resistance line, with the 50 & 200 EMAs acting as a dynamic ceiling on every rally attempt. These two indicators are stacking against the bulls, reinforcing the overhead pressure and keeping ETC pinned below key resistance levels.
💎The red zone between $18.60 and $19.20 has been acting as a strong resistance area and that’s exactly where the last bounce got rejected. The setup is clear: as long as price remains below this red supply zone, any short-term bullish case is invalidated. Each rejection here only fuels further downside conviction.
💎Unless we see a high-volume breakout and hold above $19.20, the structure remains extremely vulnerable. This is the invalidation level for the bearish thesis. If bulls can't flip that, the current pattern suggests continuation to the downside.
💎#ETCUSD is currently hovering around $16.50, with short-term bounces being aggressively absorbed. The mid-term support zone around $12.49 is likely the first magnet for price, but don’t get too comfortable there. The real target lies deeper: the strong support zone around $10.78 is shaping up to be the key smart money reaccumulation area if the selling intensifies. This is where real interest may return—but only after retail gets flushed.
Trade smart, Paradisers. This setup will reward only the disciplined.
MyCryptoParadise
iFeel the success🌴

Bitcoin Cash Nears $485—Will BCH Hold Its Gains? FenzoFx—Bitcoin Cash remains bullish, nearing the previous monthly high at $485.0, though overbought conditions signal possible consolidation.
BCH/USD may stabilize around $431.0 before resuming its uptrend toward $485.0. A break above this level could pave the way for $568.0.
The bullish outlook holds as long as BCH stays above $349.0.

Ethereum Consolidates: A New Bearish Target Could Be on the HoriFenzoFx—Ethereum faced rejection at $2,813, triggering a downtrend before stabilizing near the bullish FVG. ETH/USD now trades at $2,566, recovering some losses.
Immediate resistance is at $2,395, but liquidity sweeps make it fragile. A rise toward $2,700 could precede another bearish wave.
If selling pressure persists, ETH may drop to $2,395 or further to $1,910.

Litecoin is Oversold—Is a Rebound Coming? FenzoFx—Litecoin swept liquidity below the previous week's low, aligning with the monthly low at $81.01, a strong support zone.
LTC trades near $83.70 with weak bullish sentiment. Stochastic at 11.00 signals an oversold market, suggesting potential consolidation or a rebound.
A bullish wave may emerge if LTC holds above $81.01, targeting $91.92. Closing below this level invalidates the bullish outlook.

#TRX Ready for a Recovery or Another Fall Ahead? Key LevelsYello Paradisers! Are you watching the #Tron's recent moves in the market? Let's look at the latest setup of #TRXUSDT to see what could be the next move:
💎After forming a textbook Ascending Channel over the past few months, #TRX just got rejected hard from the upper boundary near the $0.29–$0.30 zone. That rejection didn’t just happen anywhere—it came right at the major resistance zone, which has acted as a key reversal point since early May. This kind of rejection, especially after multiple touchpoints, isn't just noise—it's a sign of momentum exhaustion at the top.
💎From an Elliott Wave perspective, it’s very likely that the first major impulse wave (Wave 1) has just been completed with this recent peak, and what comes next could be the start of Wave 2—a corrective phase that typically retraces deep and fast before the market resumes its larger trend. That means any weakness below the channel support could mark the beginning of a more prolonged decline, trapping breakout buyers and squeezing late longs out of their positions.
💎Price is now hovering dangerously close to the lower boundary of the channel, trading at $0.274 at the time of writing. This is where things start to get interesting. A decisive breakdown from this ascending support would not only confirm a bearish structural shift but would also trigger a cascade effect—invalidating the bullish channel and opening the door for a larger move to the downside.
💎If that breakdown plays out, the first meaningful support sits at the $0.2433 level. But that’s just the beginning. The next major demand lies down around $0.2259—a level loaded with historical volume and likely to attract strong buying interest. Until then, any small bounce is just noise in what could become a significant trend reversal.
Trade smart, Paradisers. This setup will reward only the disciplined.
MyCryptoParadise
iFeel the success🌴

BTCUSDT – Strategy and Trend Probabilities for 2025In my opinion, Bitcoin (BTC) has become less interesting — there isn’t much room left for significant movement, and most of the “cream” has already been skimmed off. However, since it's essentially the index of the crypto market, I’m sharing this trading idea for context - to show where we currently are and what scenarios might unfold.
The price is globally moving within an ascending channel.
A secondary triangle pattern is forming.
Within this triangle, we can see the outlines of an inverse head and shoulders pattern - or possibly a cup and handle - both aligning with the channel’s resistance.
Potential scenarios:
a) Price breaks out of the triangle.
b) Price moves toward the triangle’s support, forming another wave inside it.
c) Price moves to retest the main ascending channel’s support.
d) Price fluctuates within the central range of the channel.
There aren't many options, and none of them would break the primary trend. Altcoin movements will largely depend on BTC’s behavior.
Therefore, it’s crucial to build a trading strategy that considers both the likely and less likely (but possible) outcomes.
Looking at the broader picture:
The previous minor altseason (winter 2024) was short and weak, except for a few coins.
There was no real secondary altseason in spring 2025.
Statistically, summer tends to be quiet - due to holidays and so on.
The first two points contradicted the expectations of most traders - so we’ll see how things play out with the third. If there's no altseason in summer either, then logically, winter might turn out to be quite aggressive.

XRP: Selling Pressure Could Push Price to $2.22FenzoFx—Ripple (XRP) is testing the $2.34 resistance zone, marked as a key level by the Volume Profile Indicator. RSI 14 shows bearish divergence, while the Stochastic oscillator remains in overbought territory, signaling potential selling pressure.
If $2.34 holds, a bearish wave could target $2.26, with further downside to $2.22 if selling pressure persists.

Ethereum's Monthly High Rejection: Is a Bearish Wave Coming?FenzoFx—Ethereum tested and swept the monthly highs at $2,813 but failed to sustain its bullish momentum. The 1-hour chart formed a bearish fair value gap, signaling increasing selling pressure.
Currently, Ethereum trades slightly below the monthly high at approximately $2,806, with immediate resistance at $2,813. If this level holds, ETH/USD could target the 50.0% retracement zone near $2,640.

BCH/USD Consolidates Eying $461.9FenzoFx—BCH (Bitcoin Cash) paused its uptrend near $448.1, a low-volume zone, suggesting the rally may resume after consolidation.
Technical indicators show overbought conditions, increasing the likelihood of a short-term dip. BCH/USD may consolidate near $430.0 before aiming for the next target at $461.0.

Solana: Bearish Outlook Between $163.8 and $170.FenzoFx—Solana formed a double bottom at $141.3, making this level a target. We are bearish on Solana between the $163.8 and $170.0 resistance.
The target is $149.7, followed by $141.3.
Litecoin Hits Key ResistanceFenzoFx—Litecoin took buy-side liquidity at the $91.02 resistance, aligning with monthly highs. A bearish FVG emerged, signaling selling pressure in Tokyo's session. The Stochastic Oscillator at 81.0 suggests a potential bearish wave.
A bearish trend may form if LTC stabilizes below $91.02, targeting $86.77. However, if Litecoin breaks above this level with a bullish engulfing candlestick, the bearish outlook is invalidated.

ICT Strategy Signals Bearish Outlook for LTCFenzoFx—Litecoin consolidates near 87.1 after Saturday’s price action, down 0.09% today. ICT analysis places LTC in the premium pricing area, favoring short positions.
Immediate resistance at 89.36 remains untested, while support lies at 86.61. Traders should wait for LTC to test resistance and watch for bearish signals like candlestick patterns and an inverted Fair Value Gap (FVG). If resistance holds, LTC could break below support, aiming for 85.17.
The bearish outlook remains valid as long as 91.02 holds as resistance.
>>> Trade LTC swap free at FenzoFx.

BTCUSD at Decision Point – Rejection or Breakout Ahead? (4H)Bitcoin is currently trading around $103,500, and the price action is presenting a textbook technical scenario with multiple confluences. This chart is rich in structure — from rejection zones and trendlines to channel breakdowns and historical support retests — making it a critical area for traders to observe.
🔍 1. Previous Reversal Zone
The chart shows that Bitcoin previously faced a strong rejection near the $110,500–111,000 level. This created the first lower high, signaling the end of bullish momentum and the start of a trend shift. Every subsequent touch of that zone resulted in rejection, confirming it as a major supply zone.
📉 2. Descending Trendline – Dynamic Resistance
After multiple failed attempts to break above, price has formed a clean descending trendline that is acting as dynamic resistance. Each touch along this trendline has led to a short-term selloff, and price is now approaching this line again, near the Next Reversal Zone.
📌 This confluence increases the probability of another rejection unless there's a strong bullish breakout with volume.
📊 3. Bearish Channel & Breakdown
Before the recent fall, Bitcoin was trading inside a small bearish channel. This type of consolidation often results in continuation — which we saw with the downside breakout. This breakdown also increased bearish momentum and pushed BTC into the major support area.
🧊 4. Major Support Zone – The Battle Ground
Marked around the $101,000–102,000 range, this zone has acted as a strong demand area multiple times. The most recent bounce suggests that buyers are still active here. This could be the last defense for bulls in the short term.
🧠 If this zone breaks, we could see price falling toward the psychological level of $100,000 or even lower.
🌀 5. Ellipse Zone – Accumulation Structure
Early on the chart, an ellipse highlights a horizontal accumulation zone where price moved sideways before breaking out upward. This shows how smart money often enters during quiet phases before explosive moves. Watching for similar signs can provide strong trade setups.
🔄 6. Next Reversal Zone – Watch Closely
Price is now approaching the Next Reversal Zone near $104,500–105,000, which aligns perfectly with the descending trendline. This is a high-probability rejection zone where traders should be watching for bearish confirmations like wicks, pin bars, or bearish engulfing candles.
📌 Two Possible Scenarios
🟥 Bearish Scenario (High Probability):
Price touches the Next Reversal Zone and gets rejected.
We could see a drop back to the Major Support Zone.
If support breaks, expect a move toward $100K–99K in the coming sessions.
🟩 Bullish Scenario (Low Probability Without Volume):
Price breaks and closes above the trendline with strong bullish candles and increased volume.
In that case, BTC could rally toward the $107K–108K resistance and potentially flip the trend bullish.
💡 Trading Insight:
Fridays usually have low volume, leading to unexpected wicks and false breakouts. That’s why it’s important to:
Use small lot sizes
Wait for confirmations
Avoid overtrading before weekend closes
🧠 Final Thoughts:
This is a classic setup — consolidation after trend, rejection zones, trendline resistance, and strong support areas all in one chart. Whether you’re a price action trader or a structure-based analyst, this chart offers a powerful decision point.
Stay patient. Let the market reveal its hand. The next few candles around this trendline will likely dictate the next 1–3 day direction for BTC.
