FHE/USDT ABOUT TO EXPLODE? This Setup Looks TOO CLEAN!After a long downtrend, FHE finally shows a strong reaction from a key support zone — and this is where things get interesting 👀
Smart money doesn’t buy highs… they position where risk is tight and structure starts to shift.
Price is now holding above support with a clear impulsive move, signaling potential trend reversal or continuation play 📈
As long as this base holds, upside expansion remains very attractive with a clean invalidation below.
This is the type of setup traders wait days — sometimes weeks — to catch.
Low risk, high reward, and very clear levels on the chart 🎯
I’ve mapped everything directly on the chart.
Now the only question is… will price respect the level or trap late sellers? 🤔
Not financial advice. Always manage your risk.
Drop your bias below — bullish or fake move?
If you like clean, no-nonsense price action & smart money setups, don’t forget to BOOST 🚀, LIKE 👍, and FOLLOW for more high-probability crypto ideas.
Let’s hunt the next big move together 💰🔥
#FHE #FHEUSDT #Perpetual #CryptoTrading #Altcoins #PriceAction
Cryptofutures

RIVERUSDT – Potential Short Reversal SetupRIVER experienced a strong impulsive move followed by a pullback into a key reaction zone. Price is currently stabilizing after the retracement, opening the possibility for a short-term recovery if buyers can hold this area.
RIVER/USDT (SHORT)
Leverage: CROSS 15x
Limit Entry: 15.08
Target: 13.9 - 12
Stop: 16.225
If price can maintain acceptance above the current level, a short-term bounce toward the upper zone remains valid. Failure to hold the level would invalidate the setup.

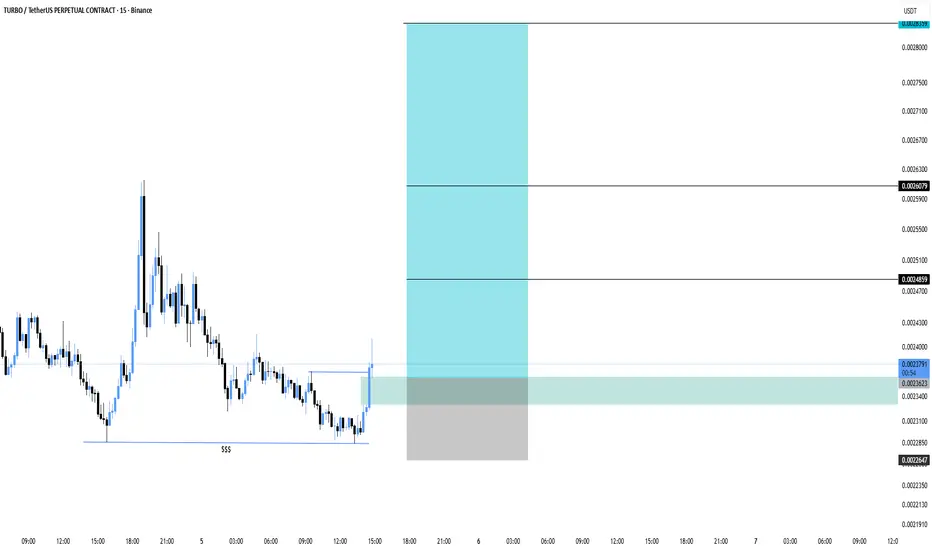
TURBO/USDT – Clean Long Setup After SweepPrice swept the liquidity (SSS) and instantly reacted with a strong bullish push. Structure is shifting short-term, giving a clean long opportunity as price taps the demand zone.
Entry: 0.0023623
Stop Loss: 0.0022647
TP1: 0.0024859
TP2: 0.0026079
Final TP: 0.0028359
#TURBO #TURBOUSDT #TURBOUSDTPERP
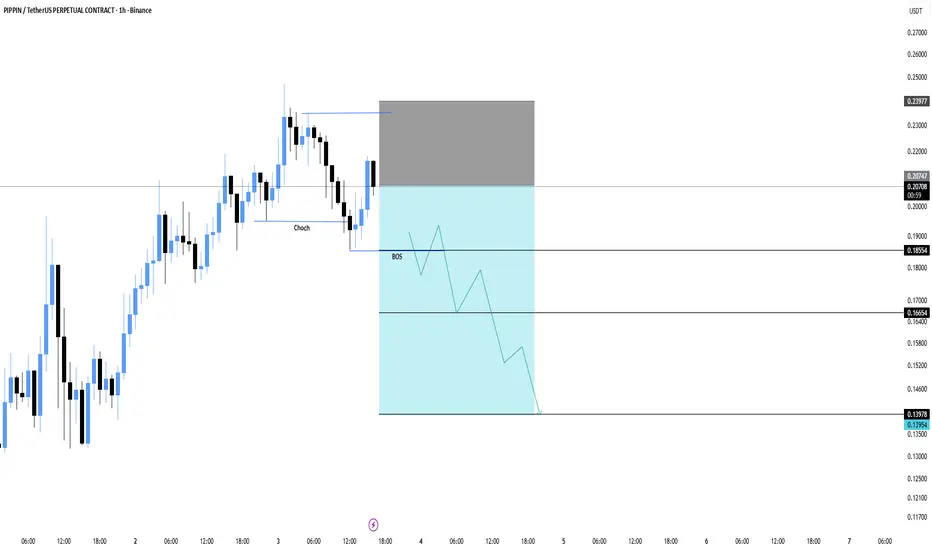
PIPPIN/USDT – Clean Short Setup, Dump Is coming!Price has shown a clear CHoCH followed by a BOS, confirming bearish structure. Current move is a retracement into the supply zone, giving a straightforward continuation-short opportunity.
Entry: 0.20747
Stop Loss: 0.23977
TP1: 0.18554
TP2: 0.16654
Final TP: 0.13978
FF looks Bearish (4H)It appears that we have an ABC pattern in which wave B formed a triangle, and the final leg of this triangle | wave e of B | has now completed. The price is entering a larger wave C, which is a bearish wave.
A 4-hour candle closing above the invalidation level will invalidate this analysis.
The targets are marked on the chart. These targets are for taking profit. Price can even move beyond the green zone, but since this is a volatile and newly listed coin, it’s better to take profit at each level and then move the stop-loss to breakeven.
For risk management, please don't forget stop loss and capital management
When we reach the first target, save some profit and then change the stop to entry
Comment if you have any questions
Thank You

BTCUSD BearishBitcoin has consolidation between 58150-60300 levels. Now bears control the market. 54800 level is bearish target.

BCHUSDT LongBitcoin cash H4 chart, consolidation between 433.5 _ 474 levels. Now price is at support level, if we find any buy signal on lower timeframe we can buy. Let's see!

Dogeusdt BullishDogecoin bullish outloock, we can identify strong bullish entry at 0.3180 level. If price breaks this zone than bears target will be 0.24 zone but hope this doesn't happen.

BEAT Analysis (1H)The reason for the recent pump in BEAT is the collection of a liquidity pool beneath the chart.
Given the series of lower highs and lower lows, a resistance zone has formed on the chart.
In this zone, we are looking for sell/short positions.
The targets are marked on the chart.
A 4-hour candle closing above the invalidation level will invalidate this analysis.
Do not enter the position without capital management and stop setting
Comment if you have any questions
thank you

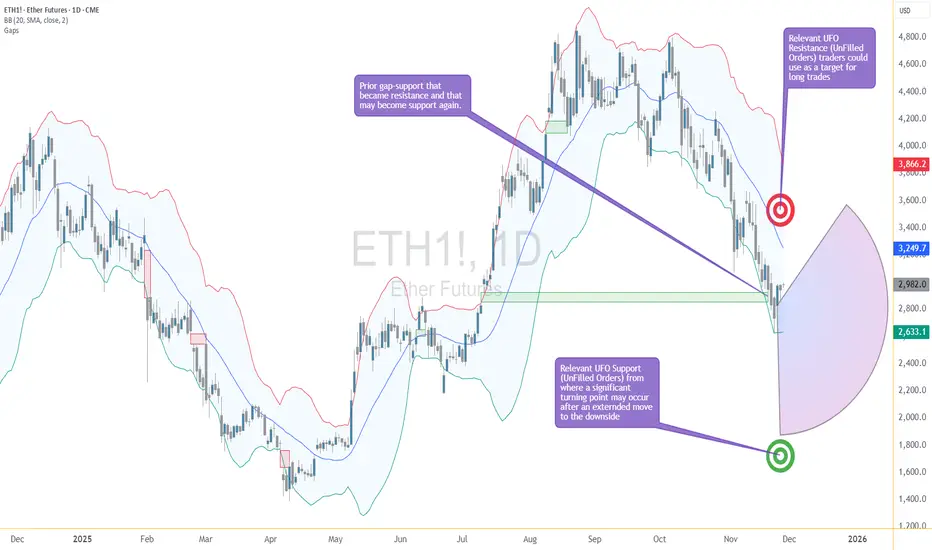
Ether Breaks the Ceiling: Is This the First Real Clue of a Turn?Ether Futures just pulled an interesting move — it finally pushed above the upper edge of the stubborn gap that has been capping price below 2853.5.
For a while, ETH was sliding down the lower Bollinger Band like a chilled skier who forgot how to turn. Now? It just jumped over the fence.
This changes things. A gap break doesn’t guarantee a trend reversal, but it’s the market’s way of saying:
“Hey, sellers… your seat might not be reserved anymore.”
The Old Barrier Is Now the New Test
That closed gap was acting like a reinforced ceiling. Buyers hitting their heads on it didn’t get far — until now. Trading above 2853.5 means the market is testing whether:
Sellers still have ammunition
Buyers can hold the reclaimed turf
Momentum is finally shifting gears
A close and hold above this zone is usually where early reversal logic starts to form.
Next Target: UFO Resistance at 3376.5
If buyers keep control, the next structural “magnet” is near 3376.5, where a cluster of unfilled sell orders waits. Markets love revisiting old unfinished business, and this is the next shelf of potential friction.
It’s not a prediction — it’s just where the roadmap naturally leads once the gap breaks.
Support Below: The New Battleground
What used to be resistance is now a potential support zone. If price pulls back toward the gap’s top edge and stabilizes, it would confirm that buyers have actually taken the wheel.
If price slips back into the gap, then this “break” was just a false alarm — the chart equivalent of stepping on a stair that wasn’t actually there.
Two Quick Read-Through Scenarios
Scenario 1 — Reversal Gains Traction
ETH stays above 2853.5
Buyers defend the reclaimed gap
Market may gravitate toward 3376.5
This would suggest the downtrend is losing its grip.
Scenario 2 — Rejection Back Into the Gap
ETH falls back below the gap ceiling
Sellers reclaim control
Market may return to prior support zones
This would keep Ether in a broader corrective environment.
The key here is not guessing — it’s waiting to see whether the breakout holds.
Futures Traders Have Two Contract Sizes to Play With
Ether Futures (ETH) are the big, fast movers.
Micro Ether Futures (MET) offer the same chart logic, but at 1/500th the size, which makes scaling more controlled.
Whether large or micro, the structure is the same — only the sizing changes.
Quick Specs (Fast & Simple)
ETH contract: 50 Ether
Tick: 0.25 per Ether = $12.50 per contract
Margin: ≈ $44,000 (varies)
MET contract: 1/500th of ETH (good for precision adjustments)
Bottom Line — The Story Just Got Interesting
For the first time in a while, Ether has stopped drifting and started acting. Breaking above the upper gap is the market’s first real sign of a potential power shift.
Now the question becomes simple:
Can buyers hold the line they just captured?
If yes → the path toward 3376.5 opens.
If no → the market falls back into its old bearish rhythm.
Either way, the quiet slide is over — this is where things get lively.
Want More Depth?
If you’d like to go deeper into the building blocks of trading, check out our From Mystery to Mastery trilogy, three cornerstone articles that complement this one:
🔗 From Mystery to Mastery: Trading Essentials
🔗 From Mystery to Mastery: Futures Explained
🔗 From Mystery to Mastery: Options Explained
When charting futures, the data provided could be delayed. Traders working with the ticker symbols discussed in this idea may prefer to use CME Group real-time data plan on TradingView: www.tradingview.com - This consideration is particularly important for shorter-term traders, whereas it may be less critical for those focused on longer-term trading strategies.
General Disclaimer:
The trade ideas presented herein are solely for illustrative purposes forming a part of a case study intended to demonstrate key principles in risk management within the context of the specific market scenarios discussed. These ideas are not to be interpreted as investment recommendations or financial advice. They do not endorse or promote any specific trading strategies, financial products, or services. The information provided is based on data believed to be reliable; however, its accuracy or completeness cannot be guaranteed. Trading in financial markets involves risks, including the potential loss of principal. Each individual should conduct their own research and consult with professional financial advisors before making any investment decisions. The author or publisher of this content bears no responsibility for any actions taken based on the information provided or for any resultant financial or other losses.
ROSE Analysis (2H)This is a buy/long setup | do not use it as a sell/short setup.
We have a solid support zone on the chart with significant liquidity resting around it.
Price is expected to show a strong rejection upon tapping the demand zone.
The targets are marked on the chart.
A 4-hour candle closing below the invalidation level will invalidate this analysis.
Do not enter the position without capital management and stop setting
Comment if you have any questions
thank you

FOLKS Analysis (3H)The price is moving within a range and there is a liquidity pool at the lower part of the range. It is expected that after sweeping the liquidity below, the price will return toward the upper boundary of the range. Therefore, we are looking for buy/long positions around the lower order-block area.
The targets have been marked on the chart.
A 4-hour candle closing below the invalidation level will invalidate this analysis
Do not enter the position without capital management and stop setting
Comment if you have any questions
thank you

ZIL/USDT Futures: Primed for a Bullish Breakout Explosion!🚀 ZIL/USDT Futures: Primed for a Bullish Breakout Explosion! 🚀
Traders, get hyped! 🔥 This killer setup on $ZIL/USDT Perpetual Futures is locked in on the 30-minute timeframe, where price is coiling tight against a descending trendline, building massive pressure for an upside breakout. We're on the edge of our seats waiting for that clean snap above the trendline – and when it happens (as we're betting it will), it's game on for some serious gains! 📈
📊 Setup Scoop:
Timeframe: 30-minute – perfect for spotting this compression play.
Key Action: Price hugging the descending trendline, ready to burst upward. Breakout confirmation = green light for entry!
Profit Potential: Without leverage, we're eyeing at least 4% upside, with room to rocket up to 19%. Throw in leverage, and those returns could skyrocket – talk about multiplying your wins! 💥
This setup screams opportunity in the volatile world of ZIL – don't blink, or you might miss the launch!
⚠️ Disclaimer: Not financial advice – always DYOR and trade smart. Crypto's a wild ride, so manage your risk like a pro!
🚀 Epic Analysis + Signals? Follow NOW! ✅
📊 Craving a Golden Chart? Smash BOOST! ✅
💬 Got ideas? Drop a COMMENT – we reply to the best! ✅
Follow = Profits | Boost = Gold Chart | Comment = VIP Access! 😎

ETH completing elliott wave pattern ABCDE or Trendline break? (Left) 2-Hour Chart: ABCDE Descending Triangle
Textbook contracting ABCDE correction for Ethereum/USDT:
A → B → C formed the first three legs of the correction.
D pushed back up into the descending trendline but failed to reclaim structure.
Now, E is the key — this is either:
1. Final flush to complete the triangle, or
2. Failed breakdown, leading to an upside break.
Typical E-wave behavior:
Often weak and lacks momentum (especially compared to A and C).
Sometimes makes a marginal lower low below C, then reverses sharply.
Volume tends to contract during the E-wave, then expand at breakout.
E-wave target zones often line up with
0.618 FIB to 1.0 FIB extension of the C leg.
For the chart on the right, the descending trendline
If price rejects at this line, it’s the clean start of E-wave down (to finish the ABCDE).
If price breaks above this line on strong volume, it invalidates the E-wave flush, likely triggering a triangle breakout early.
What to watch:
Breakout confirmation = strong candle close above $4,180–$4,200 on the 15-min + volume surge.
Breakdown confirmation = failure near the trendline, followed by controlled drift down (E-wave style).
It maybe closer to Friday before we see any sign of breaking out, if the chop continue.
Happy Trading!

Crypto Futures Trading LowerVolatility has been a main talking point over the last few days looking at many markets across different asset classes, and that volatility has stayed present in the Crypto futures markets starting off this week. Bitcoin futures have seen a steady increase in price since the lows in April and were able to climb to a new all time high price at the beginning of the month over $127,000. Since hitting that price, the market has been driven lower through previously significant levels and is trading lower today by about 3.7%. This downtrend is not just for Bitcoin futures, but also Ether, XRP, and Solana futures as well.
Looking at the other Crypto futures outside of Bitcoin, XRP has had the most dramatic selling pressure of the 4 products and is now trading right near the level it was trading at when the futures contract was launched after selling off 7% on the day today. Ether futures are also trading lower by over 6% on the day today after reaching a new all time high price back in August. These products often see significant volatility and the momentum has seemed to have shifted to the downside, and traders will be looking for a catalyst to send prices back higher before the end of the year.
*CME Group futures are not suitable for all investors and involve the risk of loss. Copyright © 2023 CME Group Inc.
**All examples in this report are hypothetical interpretations of situations and are used for explanation purposes only. The views in this report reflect solely those of the author and not necessarily those of CME Group or its affiliated institutions. This report and the information herein should not be considered investment advice or the results of actual market experience.

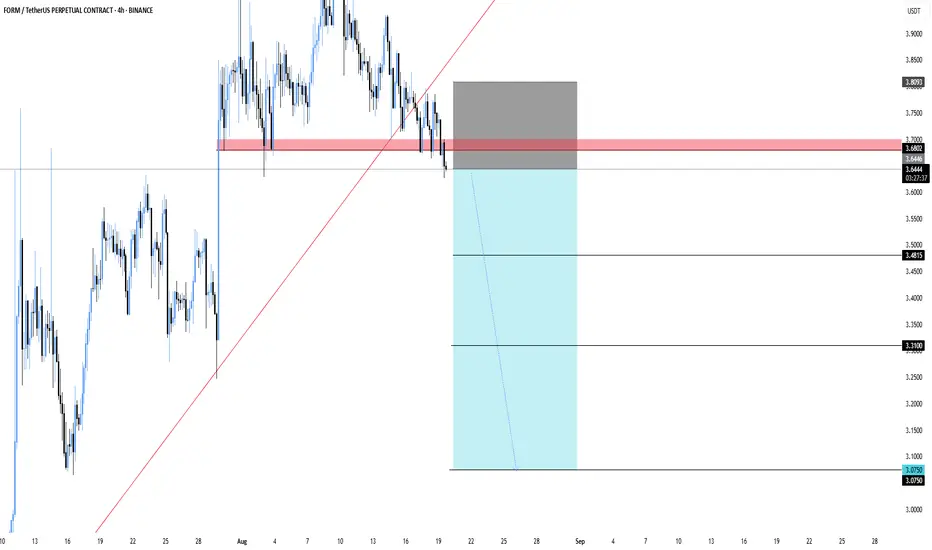
FORMUSDT.P – Break Below SupportFORMUSDT – Break Below Support
FORM has broken its trendline and slipped under the support zone. As long as it stays below this area, the momentum looks bearish with more room to the downside.
Entry: 3.64
Stoploss: 3.8093
Targets:
3.48
3.31
3.075
Let’s see if the breakdown continues or if buyers step back in.
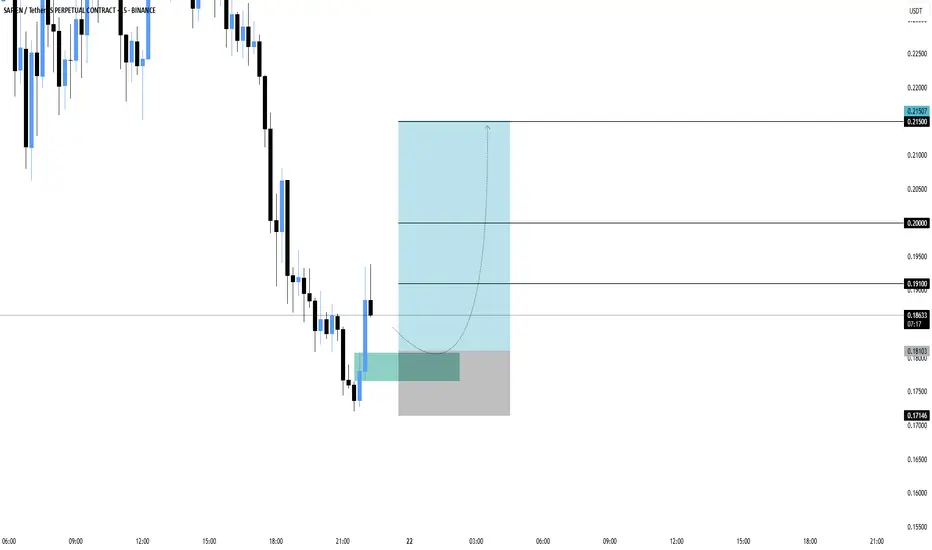
SAPIENUSDT – Bounce OpportunitySAPIEN is showing a potential reversal after tapping into the demand zone. If buyers hold this level, price could push higher toward key resistance levels.
Entry: 0.1810
Stoploss: 0.1715
Targets:
0.1910
0.2000
0.2150
Now the focus is whether momentum can sustain the bounce and drive toward the upper targets.
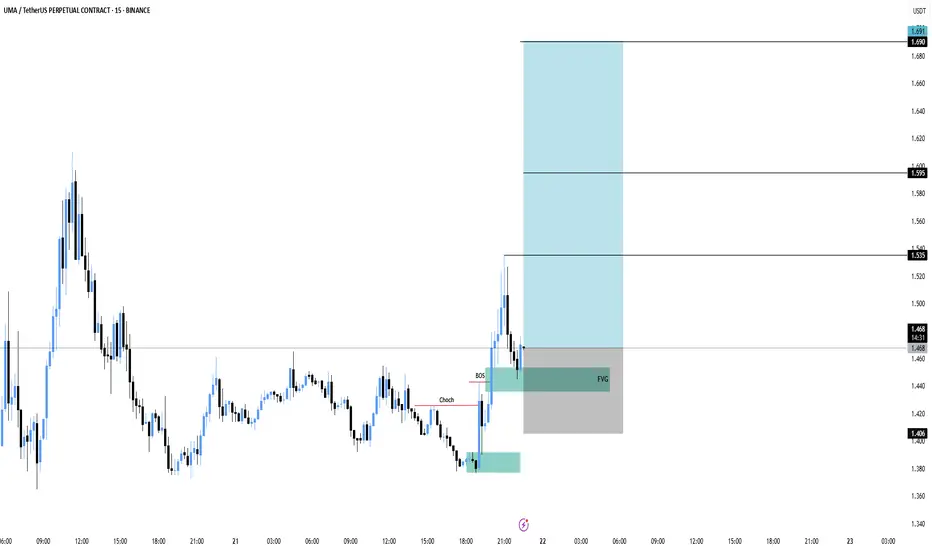
UMA Loading a Big Move – Don’t Miss This Setup!UMA has shown a clear change of character with a bullish break of structure. Price is now retesting the fair value gap (FVG) area, setting up for a possible continuation move upward.
Entry: 1.47
Stoploss: 1.406
Targets:
1.535
1.595
1.691
If buyers defend the FVG zone, UMA could rally toward higher targets with strong momentum.
SKLUSDT – Possible Reversal in PlaySKL shows a change of character (ChoCH) after long consolidation and now trying to push upward. Price already retested the zone, giving a chance for continuation if momentum holds.
Entry: 0.0310 - 0.0307
Stoploss: 0.0297
Targets:
0.0326
0.0339
0.0360
Let’s see if SKL can maintain strength and push into higher targets.

$SOL CRYPTO FUTURES SETUP – BEARISH BIAS (Aug 2, 2025)
🚨 **\ CRYPTOCAP:SOL CRYPTO FUTURES SETUP – BEARISH BIAS** (Aug 2, 2025) 🚨
Multi-Model AI Consensus | 🔻 Short Bias with Defined Risk
---
### 📉 **MARKET CONTEXT**
* **Current Price**: \$158.84
* 🔻 Trading below all key MAs:
* SMA20: \$178.72 (-11.1%)
* SMA50: \$161.29 (-1.5%)
* SMA200: \$162.06 (-2.0%)
* 🔻 Market Structure:
* **Death Cross** confirmed
* **Lower highs/lows** across all timeframes
* **-12.36%** drop over 5 days = capitulation signal
* 🔥 Liquidity Zone: **\$155.29** = key bounce OR breakdown level
* 📉 Volume declining = no buyer conviction
* 💣 Volatility High: BB Width = 26.2% of price (⚠️ Stop risk!)
---
### 🧠 **MULTI-TIMEFRAME MODEL SIGNALS**
**1-Hour**:
🟥 Bearish MACD, RSI \~39 (no reversal yet)
**4-Hour**:
🔻 Still trending down, no structure break
**Daily**:
⚠️ Death Cross active, must hold \$155.29
💡 Reclaim of \$162.06 = **bullish trigger**
---
### 🔬 **TECHNICAL INDICATOR SYNTHESIS**
* **RSI (14)**: 39.84 → nearing oversold
* **MACD**: Strong bearish momentum, no reversal
* **Bollinger Bands**: Price hugging lower band @ \$155.29
* **Volume**: Weak, no accumulation on dips
* **Funding Rate**: Neutral (0.0001%) = no squeeze setup
---
### 🔎 **TRADE SETUP (OA MODEL)**
🛑 **Direction**: SHORT
🎯 **Entry**: \$158.84
📉 **Target**: \$155.29
🛡️ **Stop**: \$161.29
💪 **Confidence**: 80%
🕰️ **Timing**: Market Open
🧠 Model Notes: Favoring momentum short w/ tight stop & fast exit
---
### ❌ **DS MODEL (No Trade)**
🟡 Recommends standing aside due to:
* Missing OI data
* Elevated volatility
* Lack of reversal OR divergence
---
### 🤖 **FINAL CONSENSUS**
🧠 **Models Agreed**: 2
📊 **Average Confidence**: 68%
📉 **Bias**: SHORT
📛 **Risk Level**: MODERATE
🚨 **Key Breakdown**: < \$155.29 = opens door to \$145
---
### ⚠️ **WATCH LEVELS**
* 📈 **Bull Trigger**: Close above \$162.06 (SMA200) + MACD cross
* 📉 **Bear Continuation**: Break < \$155.29 = fast drop to \$145
* 📌 **Optimal Long Setup**: RSI divergence + volume spike @ support
---
🧨 **RISK WARNING**: High volatility zone – futures carry liquidation risk >100%. Always use proper sizing and stops.
---
📢 #CryptoFutures #SOLUSDT #TradingView #AITradeSignal #BearishSetup #SolanaAnalysis #MultiModelConsensus
ALCH Looks Bearish (8H)ALCH is one of the altcoins that began its bullish rally earlier than others.
From the point where we placed the green arrow on the chart, it appears that an ABC correction has completed.
As long as the red box is maintained, price may move toward the FVG zone.
Targets are marked on the chart.
Additionally, a liquidity pool is forming below the candles, which is expected to be swept soon
A daily candle closing above the invalidation level would invalidate this bearish outlook.
For risk management, please don't forget stop loss and capital management
Comment if you have any questions
Thank You

DOODUSDT.P 4H SHORTDOODUSDT.P {BYBIT} 🔻
Market hits resistance with lower momentum showing divergence in momentum. Expecting a third touch on bearish trendline and a strong bearish confirmation to short. Share your thoughts in the comment section.

SAGA Rebuy Setup (8H)A strong move has formed, and we have a bullish CH (Change of Character) on the chart.
We can look for buy/long positions around key zones, as buyers are present in these areas.
We are focusing on buy/long positions at the entry points.
Targets are marked on the chart.
A daily candle close below the invalidation level will invalidate this analysis.
For risk management, please don't forget stop loss and capital management
Comment if you have any questions
Thank You
