ETHEREUM will holdEthereum has 2 supports in 4H timeframe with bullish divergence on RSI, and I think it will bounce from those areas
Cryptomarket

NEIRO Update📊 NEIRO Update
NEIRO is testing the red resistance zone 🔴
If it breaks out, the first target will be the green line level 🟢

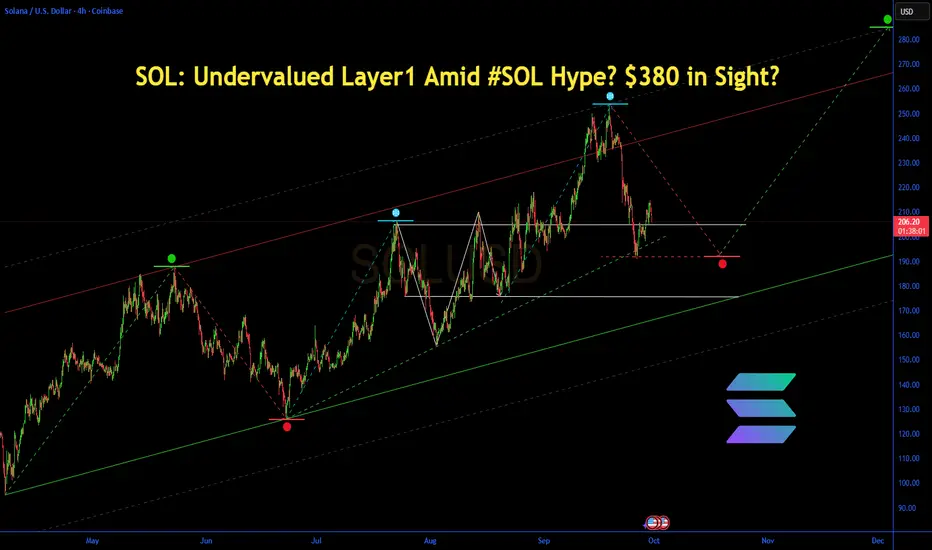
SOL: Undervalued Layer1 Amid #SOL Hype? $380 in Sight?SOL: Undervalued Layer1 Amid #SOL Hype? $380 in Sight?
Price $210.94 (-1.07%), fueled by TVL $12.2B surge and X airdrops, undervalued with 31.83% YTD, questioning if ETF inflows drive breakout.
Fundamental Analysis
Market cap $114.55B, TVL $12.2B up 57% 6M, supply growth stable; Lynch-like growth emphasis on 198% TVL rise, PEG adapted low vs peers; DCF projects $300+ on adoption moat; opportunity cost vs ETH favors efficiency, inversion warns outages.
Positive:
3.88% monthly rise.
67% staked.
Negative:
High volatility.
Rival competition.
SWOT Analysis
Strengths: Fast DeFi hub.
Weaknesses: Past downtimes.
Opportunities: ETF in #Altseason.
Threats: Regulations.
Technical Analysis
Sell signal short-term. Price: $210.94, VWAP N/A. Key indicators: RSI: Below 40/oversold.
MACD: N/A.
Moving Averages: Neutral.Support/Resistance: $177/$214. Patterns/Momentum: Potential rebound. Bullish | Bearish.
Scenarios and Risk Management
Bullish: Break $214, DCA to $380 on hype; second-order thinking amplifies network effects.
Bearish: To $150.
Neutral: Range $177-214.Risk Tips: 10% stops, diversify crypto, DCA weekly.
Conclusion/Outlook
Bullish on ecosystem, lollapalooza from #Crypto trends parabolic. Watch ETFs. Fits layer1 theme with #SOL upside. Take? Comment!
AAVE/USDT;BUY LIMITHello friends
Given the price reaching the specified support and the strong support of the price by buyers in the specified range and the failure of the specified resistance, we can buy in steps with risk and capital management and move to the specified targets.
*Trade safely with us*

SEI/USDT;BUY LIMITHello friends
Given that the price has reached the specified support and the price is supported by buyers within the specified range and the specified resistance has been broken, we can buy in steps with risk and capital management and move to the specified targets.
*Trade safely with us*

SUI/USDT; BUYERS INHello friends
Given that the price has reached the specified support and the price is supported by buyers and the specified resistance has been broken, we can buy in steps with risk and capital management and move towards the specified goals.
*Trade safely with us*

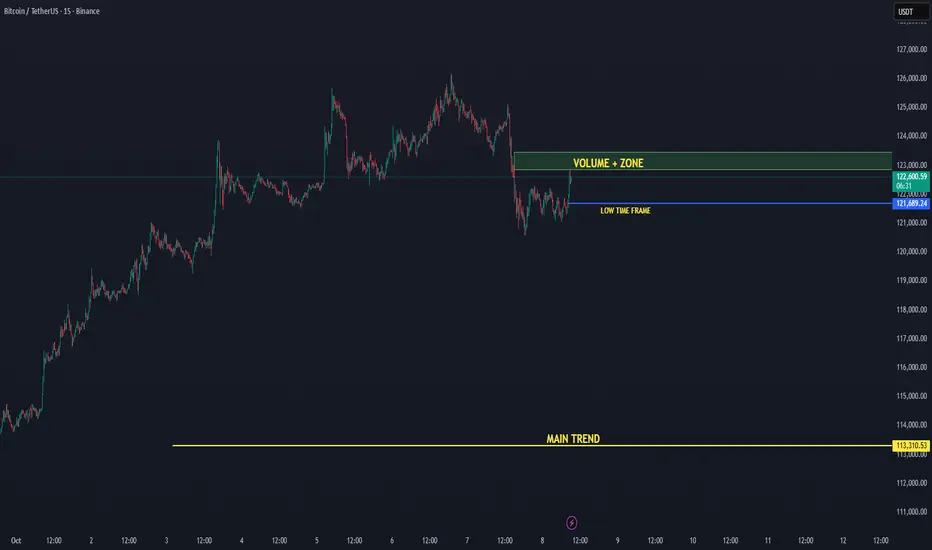
BTC/USDT — Low Time Frame Recovered, Eyes on Volume 08-10-2025Bitcoin has reclaimed its low time frame level near $121.6K, signaling renewed short-term strength. Price is now pushing upward toward the +Volume Zone, an area where increased buying activity could trigger a breakout continuation.
📈 Low Time Frame Reclaimed: BTC has stabilized above the local structure, confirming short-term bullish momentum.
🔊 Volume Zone Target: The next resistance sits around $123K, where increased trading activity could accelerate a move higher.
🟢 Main Trend Active: The primary uptrend remains strong as long as BTC holds above the $113K main trend support.
Technical Levels:
🟢 Main Trend Support: $113K
🟡 Low Time Frame Support: $121.6K
🔊 Volume Zone Resistance: $123K
🎯 Next Target: $125–$126K
Outlook:
Bitcoin is showing healthy recovery momentum, reclaiming short-term structure and heading into the Volume Zone. If it sustains above $121.6K and breaks $123K with volume confirmation, a continuation toward $125K+ becomes likely.
📊 Bias: Bullish continuation
📈 Focus: Volume reaction at $123K
CHZ/USDT ; BUY MARKET!!!Hello friends
Given the good growth we had, the price has entered a correction phase and is in the specified support area that I determined, the price is supported and if the price continues to be supported, we can see the specified targets.
*Trade safely with us*

BITCOIN SUPPORTHello friends
Well, as you can see, we have entered a correction and I have found important support areas for you, if buyers support the price in these areas, the price can move to the specified targets.
*Trade safely with us*

Breaking Resistance: Gold Eyes $4,500 by Year-EndLooking at this weekly chart of Gold (XAU/USD), we can clearly see the explosive price action that has been building up. The price has been climbing steadily, with the 33-period EMA providing strong support along the way. The breakout above the resistance zone is a strong signal that the bullish momentum is gaining strength.
However, the price is now approaching a key resistance level around $4,049, which could act as a significant hurdle. If this level holds, we might see some consolidation or a potential pullback before the next move up.
Keep an eye on how the price interacts with the resistance — a break above could signal further upside, while failure to break could lead to a retest of lower support levels. It’s a crucial moment for Gold, and any confirmation above this zone could trigger a strong continuation of the uptrend.

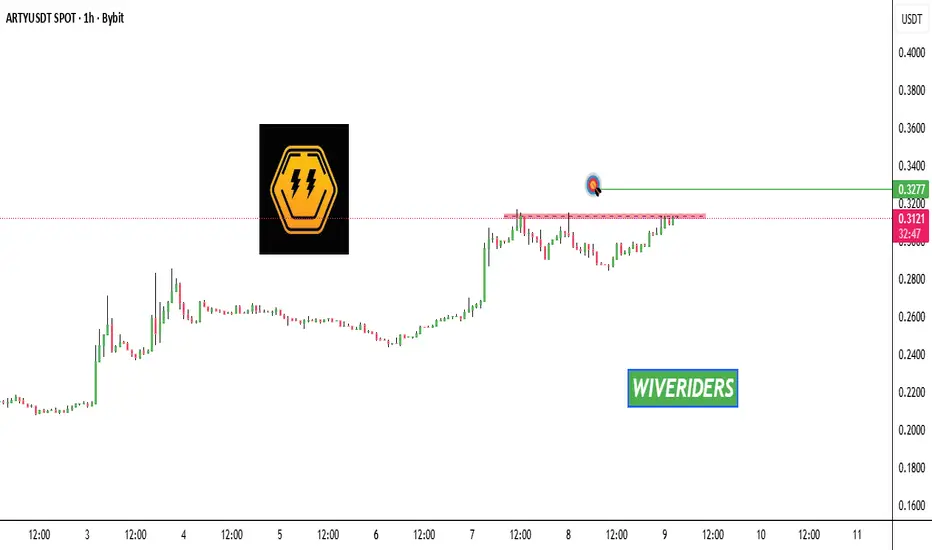
ARTY is testing the red resistance zone📊 ARTY Update
ARTY is testing the red resistance zone 🔴
If it breaks out, the first target will be the green line level 🟢
TradeCityPro | Bitcoin Daily Analysis #190👋 Welcome to TradeCity Pro!
Let’s dive into today’s Bitcoin analysis. The market, after experiencing a decline, is now ready to resume its primary bullish trend.
⏳ 1-Hour Timeframe
Yesterday, after Bitcoin confirmed a break below the channel, it retested the channel and activated the trigger at 123493, leading to a brief bearish movement.
📊 The first support zone was 122574, but the price didn't react to it, resulting in a break below. The next key support zone was 120835, where the price reacted and formed a low.
✨ After the price found support at 120835, a peak formed at 122084, creating a compression between 120835 and 122084.
📈 Currently, after breaking above the compression range, a bullish movement has started, and the price has reached back above 123491.
⚡️ The good thing about the correction to 120835 is that many long positions that hadn’t taken profit were now closed, reducing selling pressure in the market. This provides Bitcoin a chance to continue its bullish trend with a more structured approach.
🚀 However, if the price fails to break the previous high of 126042, a lower high would form, which is a sign of weakness in the bullish trend.
🎲 If that happens, and if the price stabilizes below 120835, we’ll get confirmation of a bearish shift in this timeframe. But for now, this hasn’t happened, and the market momentum remains bullish.
🔍 For a new position, if you haven’t opened a position after breaking 122084, there is no valid trigger at the moment, and we should wait for the market to create a proper structure for entry. Otherwise, the only trigger we have right now is breaking 126042.
🔽 For a short position, I am waiting for the trend change scenario to unfold before considering any short triggers.
❌ Disclaimer ❌
Trading futures is highly risky and dangerous. If you're not an expert, these triggers may not be suitable for you. You should first learn risk and capital management. You can also use the educational content from this channel.
Finally, these triggers reflect my personal opinions on price action, and the market may move completely against this analysis. So, do your own research before opening any position.

EVAA Update📊 EVAA Update
EVAA is testing the red resistance zone 🔴
If it breaks out, the first target will be the green line level 🟢

XPL Update📊 AMEX:XPL Update
AMEX:XPL is now approaching an important red resistance zone 🔴
A breakout above this key level is needed to signal a potential shift back to a bullish trend 📈

KLINK Update📊 $KLINK Update
$KLINK has formed a red resistance zone 🔴
We need a breakout above this zone to confirm a bullish trend 📈
If it breaks out, the first target will be the green line level 🟢

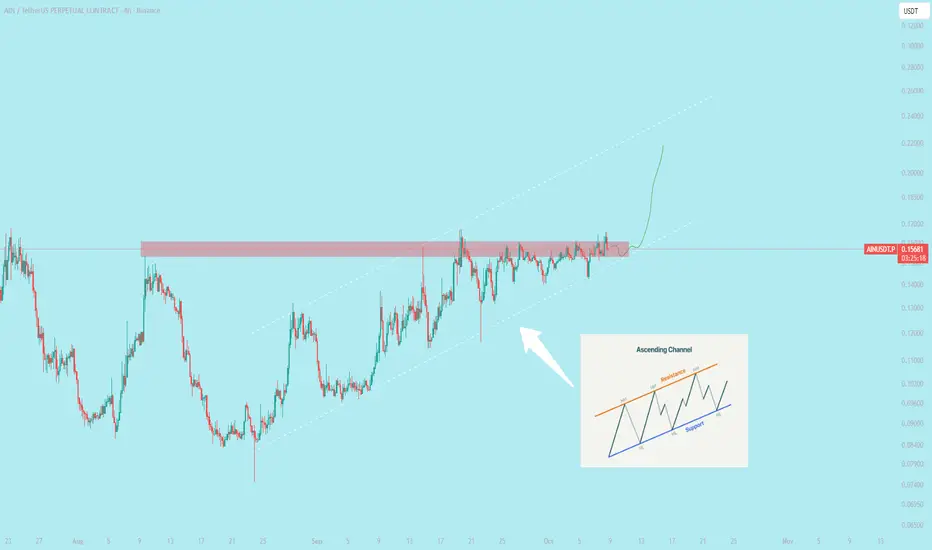
$AIN Perform Ascending Channel Pattern The ascending channel pattern is a chart formation defined by parallel rising trendlines. It signals a steady uptrend and offers clear visual rules for trade entries, targets, and risk management.
Popular across forex, equities, and crypto markets, it helps traders identify logical ranges for support, resistance, and trend continuation.
In this guide, you'll learn how the pattern forms, its strategic nuances, trade entries and exits, and risk-aware tips to deploy it effectively.
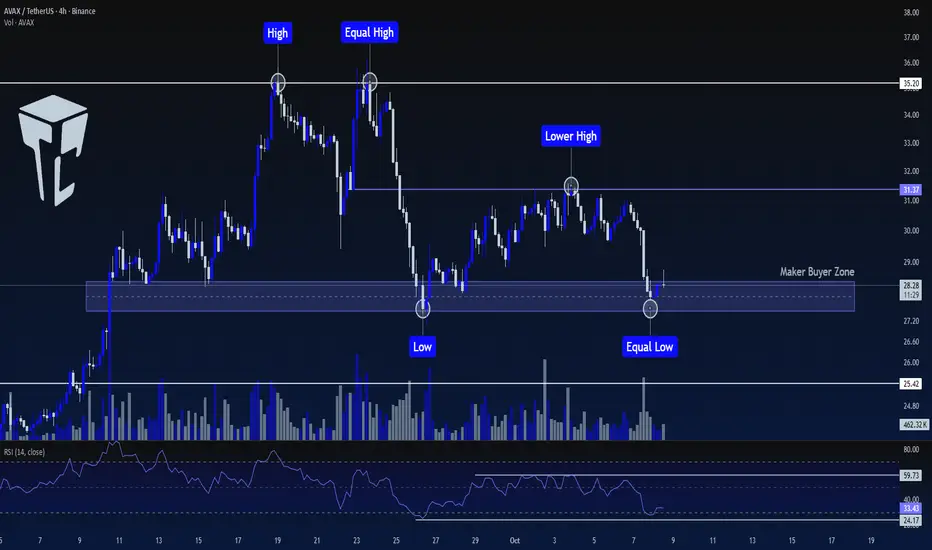
TradeCityPro | AVAX: Testing Key Support and Resistance Zones👋 Welcome to TradeCity Pro!
In this analysis, I will review AVAX, one of the Layer 1 and RWA coins with a market cap of $11.98 billion, ranked 16th on CoinMarketCap.
⏳ 4-Hour Timeframe
On the 4-hour timeframe, AVAX has a strong Maker Buyer zone that has been tested multiple times and provided support.
⭐ On the other hand, after creating two equal peaks at 35.20, the next peak was lower, at 31.37.
✅ This indicates that the sellers' strength in the market is greater than the buyers' strength, but buyers also have a significant support level, which has been effective so far in preventing further price decline.
🧩 Since Bitcoin's trend is entirely bullish, and there’s a high chance of Bitcoin's dominance decreasing, altcoins may experience an upward move. So, I am inclined to open a long position on this coin.
📊 The first trigger for a long position is the break of 31.37. The main trigger to start the coin's primary trend will be 35.20.
💥 If you believe the market will move downward and are looking for a short position, breaking the support level I marked could lead to a price decline towards 25.42.
📝 Final Thoughts
Stay calm, trade wisely, and let's capture the market's best opportunities!
This analysis reflects our opinions and is not financial advice.
Share your thoughts in the comments, and don’t forget to share this analysis with your friends! ❤️
2Z Update📊 2Z Update
2Z has broken below the green support zone 🟢, which has now turned into a strong red resistance zone 🔴
Currently, $2Z is in a downtrend 📉
If the price keeps retracing, we have two green zones 🟢🟢 where, if reached, there’s potential to enter a long position ✅
These areas hold liquidity and pending buy orders, where buyers could step in again and push the price up 📈

$XPL Trade Idea - Break Out LONG Stablecoin narrative
AMEX:XPL
Long Entries on Breakout of Trendline
Stop below recent lows.
Targets Aiming level by level
$2 soon
For swing spot trade - i think it's to better to have manual stop below $0.6

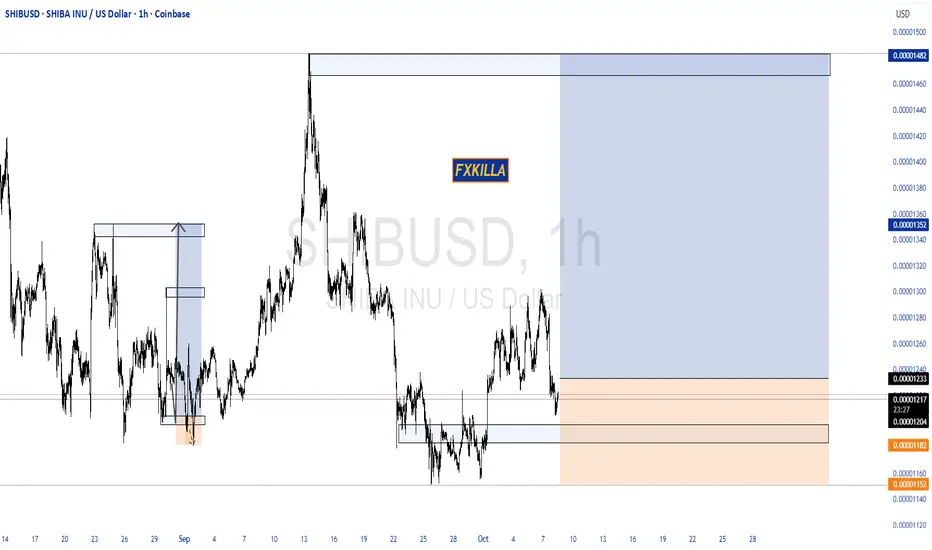
SHIBA INU HIGH PROBABILITY SETUP SOON!!!🚨 SHIBUSD HIGH PROBABILITY BUY SETUP 🚨
* Here We Can See Clearly The Next Potential Move For SHIBA Coming Hours/Days.
* Keep Your Eyes Close On Your Trading Positions.
* Happy PIP Hunting Traders.
FXKILLA.
BTCUSD H4 | Potential Bullish Continuation SetupBitcoin (BTC/USD) is falling towards the buy entry at 118,647.96, which is a pullback support that is slightly above the 50% Fibonacci retracement and could bounce from this leve lto the upside.
Stop loss is at 114,705.13, which is a pullback support that lines up with the 61.8% Fibonacci retracement.
Take profit is at 125,444.07, which is a swing high resistance.
High Risk Investment Warning
Trading Forex/CFDs on margin carries a high level of risk and may not be suitable for all investors. Leverage can work against you.
Stratos Markets Limited (tradu.com ):
CFDs are complex instruments and come with a high risk of losing money rapidly due to leverage. 65% of retail investor accounts lose money when trading CFDs with this provider. You should consider whether you understand how CFDs work and whether you can afford to take the high risk of losing your money.
Stratos Europe Ltd (tradu.com ):
CFDs are complex instruments and come with a high risk of losing money rapidly due to leverage. 66% of retail investor accounts lose money when trading CFDs with this provider. You should consider whether you understand how CFDs work and whether you can afford to take the high risk of losing your money.
Stratos Global LLC (tradu.com ):
Losses can exceed deposits.
Please be advised that the information presented on TradingView is provided to Tradu (‘Company’, ‘we’) by a third-party provider (‘TFA Global Pte Ltd’). Please be reminded that you are solely responsible for the trading decisions on your account. There is a very high degree of risk involved in trading. Any information and/or content is intended entirely for research, educational and informational purposes only and does not constitute investment or consultation advice or investment strategy. The information is not tailored to the investment needs of any specific person and therefore does not involve a consideration of any of the investment objectives, financial situation or needs of any viewer that may receive it. Kindly also note that past performance is not a reliable indicator of future results. Actual results may differ materially from those anticipated in forward-looking or past performance statements. We assume no liability as to the accuracy or completeness of any of the information and/or content provided herein and the Company cannot be held responsible for any omission, mistake nor for any loss or damage including without limitation to any loss of profit which may arise from reliance on any information supplied by TFA Global Pte Ltd.
The speaker(s) is neither an employee, agent nor representative of Tradu and is therefore acting independently. The opinions given are their own, constitute general market commentary, and do not constitute the opinion or advice of Tradu or any form of personal or investment advice. Tradu neither endorses nor guarantees offerings of third-party speakers, nor is Tradu responsible for the content, veracity or opinions of third-party speakers, presenters or participants.

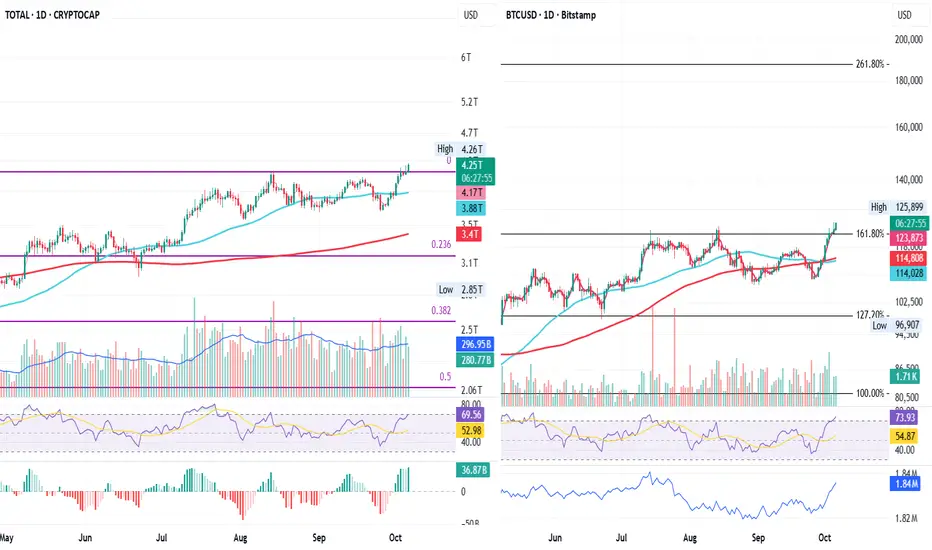
TOTAL & BTC – The Strongest Q4 Begins! 6T & 190K Target !TOTAL & BTC – Breaking Through and Entering Price Discovery
Both TOTAL and BTC have now broken above their previous ATH resistance, officially entering price discovery.
From my point of view, as long as both continue to rise together, it signals a healthy market structure, one that can support much higher prices.
Let’s not forget: we’re only at the beginning of Q4, and this might not be just any Q4, it could be the strongest one yet. Everything that used to act against crypto in past cycles is now turning pro-crypto in the US, across Asia, and even within the EU.
Because of this global alignment, I’m confident enough to point toward
the next major Fibonacci target, the 261.8% extension,
$190K for BTC, and a TOTAL market cap near $6T.
The setup, momentum, and macro tailwinds all align. What happens next could define this entire cycle.
Bias:
Bullish! structure confirmed, price discovery underway, and room above remains wide open.
Always take profits and manage risk.
Interaction is welcome.
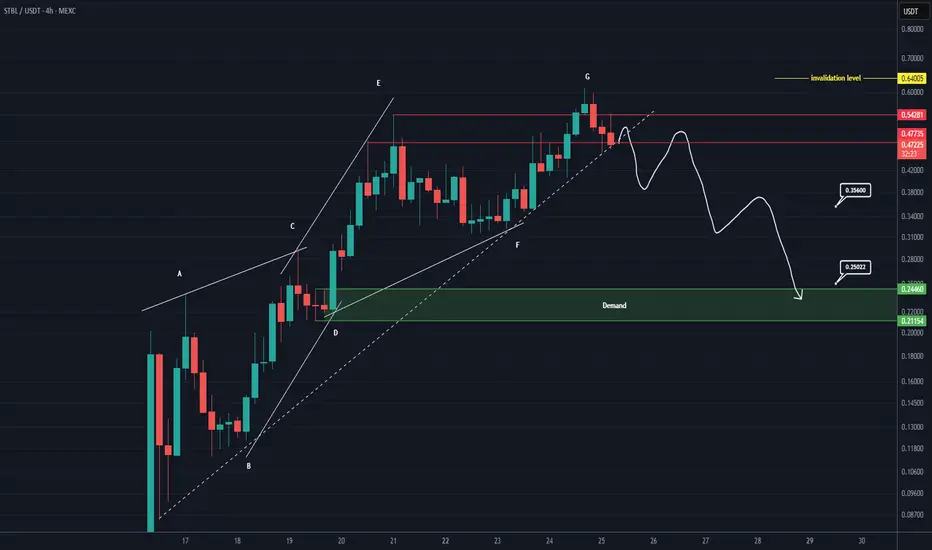
STBL Analysis (4H)Before anything else, you should know that this is a new coin and the sentiment around it is still highly emotional. Therefore, it’s better to control your position size and leverage, and set a stop-loss for yourself.
The recent upward movements and the bullish phase seem to have formed a diametric pattern, and now the final wave of this diametric wave G is coming to an end.
Targets are marked on the chart.
A daily candle closing above the invalidation level will invalidate this analysis.
For risk management, please don't forget stop loss and capital management
When we reach the first target, save some profit and then change the stop to entry
Comment if you have any questions
Thank You