Will Ethereum’s tight range lead to a breakout? | Day 34☃️ Welcome to the cryptos winter , I hope you’ve started your day well.
⏰ We’re analyzing BTC on the 1-Day timeframe .
👀 Ethereum on the daily timeframe. Ethereum is currently inside a box-like structure in a trading range format. The top of this trading range is in the $4,161 area, and the bottom of this trading range is in the $3,801 price area, where by breaking these zones, Ethereum can start a stronger and more impulsive leg of movement.
🧮RSI oscillator, which has now formed two important oscillation zones for us — one around 54, which overlaps with our long trigger, and the other around 40, which overlaps with our short trigger. The fluctuation limit crossing these zones can give more momentum to Ethereum’s next move on the daily timeframe.
🕯 Ethereum’s volume, after the flash crash the market experienced, has increased sharply, but the tendency has been pushed toward selling pressure, which has caused Ethereum’s corrections to always come with selling pressure.
📈 For Ethereum positioning, the specified zones have high price action validity, where you can set alerts so that if the price reaches these zones, you can open a position. Or, in the multi-timeframe, you can find the identified support and resistance zones and open positions with lower risk around these areas, moving toward anticipating higher or lower levels, so that in each level, you can add some risk to your position.
❤️ Disclaimer : This analysis is purely based on my personal opinion and I only trade if the stated triggers are activated .
Cryptoswinter

Has Bitcoin already priced in its next move ? | Day 56☃️ Welcome to the cryptos winter , I hope you’ve started your day well.
⏰ We’re analyzing BTC on the 1-Day timeframe .
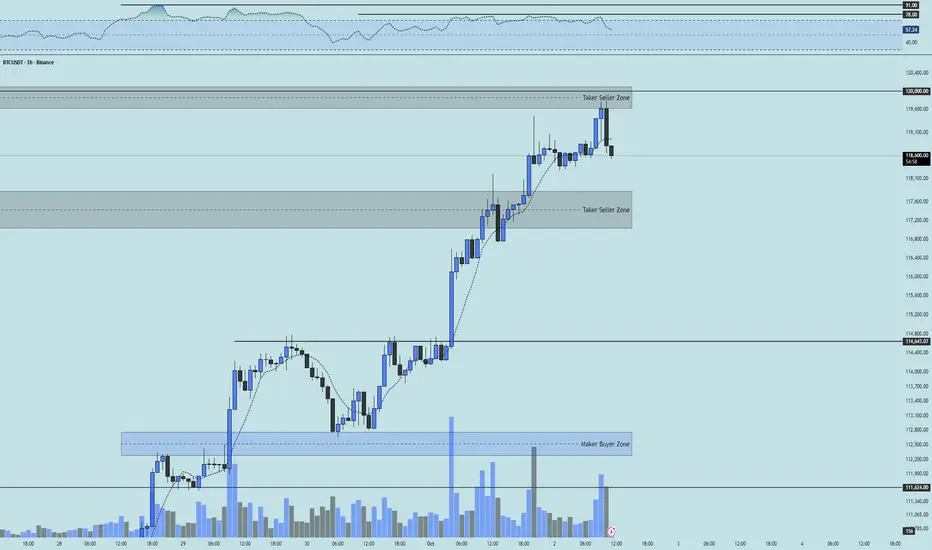
👀 Bitcoin on the daily timeframe. After the flash crash it experienced, Bitcoin is almost building a box with a top at $114,559 and a bottom at $106,431, which by breaking these areas, it can get out of this trading range and give us a position.
The noteworthy point in the recent days is the Monday meeting between Trump and the President of China, which can determine the destiny of the market and give it a good direction.
🧮 The RSI oscillator, two key zones have formed for us in the areas of 54.5 and 36, and by the fluctuation limit crossing these areas, the next move of Bitcoin can begin.
🕯 Bitcoin’s volume on the daily timeframe has increased sharply after recording a new all-time high, and this has been a tendency toward increasing selling pressure. In the image, it is completely clear that you can see exactly what happened to the market after the flash crash it experienced.
📈 To take a position with this structural style that we currently have, you can refer to the multi-timeframe analysis of Bitcoin and extract the long and short position triggers, and if Bitcoin gives you an entry, enter the position around the anticipated top or bottom with low risk so that later you can add more volume to your position at higher or lower levels.
❤️ Disclaimer : This analysis is purely based on my personal opinion and I only trade if the stated triggers are activated .

ETH 15M Analysis - Key Triggers Ahead | Day 33☃️ Welcome to the cryptos winter , I hope you’ve started your day well.
⏰ We’re analyzing ETH on the 15-Minutes timeframe .
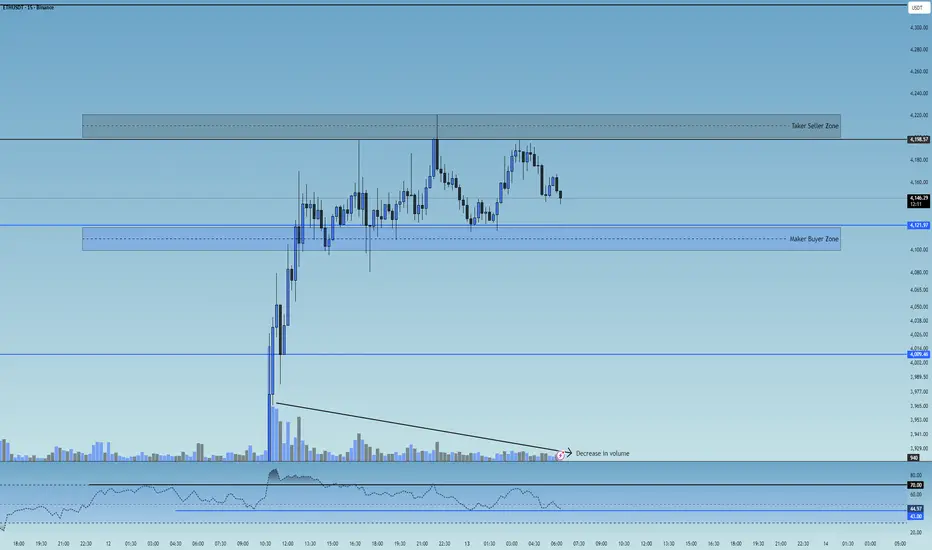
👀 On the 15-minute timeframe for Ethereum, we can see that after an impressive 10% rally, ETH showed one of the strongest recoveries in the market compared to other major coins — managing to climb above $4,100 and form a new trading range early in the week. Currently, Ethereum is consolidating within a range between $4,200 (top) and $4,121 (bottom). A breakout from this range could create either a long or short setup. Keep in mind that following this strong bullish move, trading volume has started to decline inside this range.
🧮 Looking at the RSI oscillator, we can see that after the recent surge, ETH’s momentum is now fluctuating between 43 and 70. A breakout above or below this RSI range would likely increase volatility and accelerate Ethereum’s next move — potentially with fewer candles but stronger momentum.
🕯 The size and volume of recent candles during Ethereum’s rally have been exceptional. Major buyers and institutional players have added substantial ETH positions to their portfolios. The large, high-volume bullish candles leading up to the current range reflect Ethereum’s strong momentum. Now, while the price is oscillating inside the range with reduced volume, a clear volume expansion is expected once the range breaks.
🧠 As Ethereum remains trapped inside this trading range, a breakout will require increased volume and RSI confirmation beyond the defined thresholds. This setup gives us two potential scenarios:
↗️ Long scenario: If Ethereum breaks above $4,200, which acts as a taker-seller resistance, and RSI pushes above 70 (Overbought zone), ETH could launch another bullish leg early in the week — showing an even stronger recovery compared to the rest of the market.
📉 Short scenario: If Ethereum breaks below $4,121, which is a maker-buyer support, and RSI drops under 43 toward the Oversold zone, it could continue its downward correction. However, given ETH’s strong bullish momentum, this bearish scenario would likely require negative market fundamentals to fully play out.
❤️ Disclaimer : This analysis is purely based on my personal opinion and I only trade if the stated triggers are activated .
BTC 15M Analysis - Key Triggers Ahead | Day 55☃️ Welcome to the cryptos winter , I hope you’ve started your day well.
⏰ We’re analyzing BTC on the 15-Minutes timeframe .
👀 On the 15-minute timeframe for Bitcoin, we can see that after breaking out and consolidating above the $114,351 zone, BTC began moving upward and is now trading within a 15-minute range. A breakout from this range could trigger the next move. The top of this trading range sits at $115,715 and the bottom at $114,750 — breaking and holding beyond either level could start a strong leg for Bitcoin as the new week begins.
🧮 The RSI oscillator on the 15-minute timeframe shows Bitcoin currently moving within a range capped at 64 on the top and 42 on the bottom. A breakout from this RSI range could significantly increase buying or selling momentum, adding fuel to Bitcoin’s next move.
🕯 The size, volume, and count of green candles have increased since the flash crash, and institutions like BlackRock, World Liberty, and Trump-aligned funds have been averaging solid buy positions. With rising buying volume, Bitcoin could break through its ticker-seller resistance at $115,715 and continue its bullish move following the recent dramatic flash crash.
🔍 Despite concerns like the ongoing U.S.–China economic (tariff) war, the market remains in a risk-off mode on higher timeframes. If entering trades, we aim to manage capital across multiple entries — for example, allocating only 0.25% risk per position or averaging in gradually.
🧠 Two trading scenarios are considered for Bitcoin, both offering clear opportunities for structured entries.
↗️ Long scenario (breakout above the range):
If Bitcoin breaks above $115,715 with rising buy volume and RSI crossing above 64, it could initiate another strong bullish leg toward higher resistance levels.
📉 Short scenario (breakdown below the range):
If the micro-buyer support at $114,750 — a key demand zone — breaks, Bitcoin may extend its correction downward. This move should coincide with RSI losing the 42 level and increasing sell volume. Note: in short positions, take profits quickly and maintain tight risk-to-reward control.
❤️ Disclaimer : This analysis is purely based on my personal opinion and I only trade if the stated triggers are activated .

SUI 1D Analysis - Key Triggers Ahead☃️ Welcome to the cryptos winter , I hope you’ve started your day well.
⏰ We’re analyzing SUI on the 1-Day timeframe .
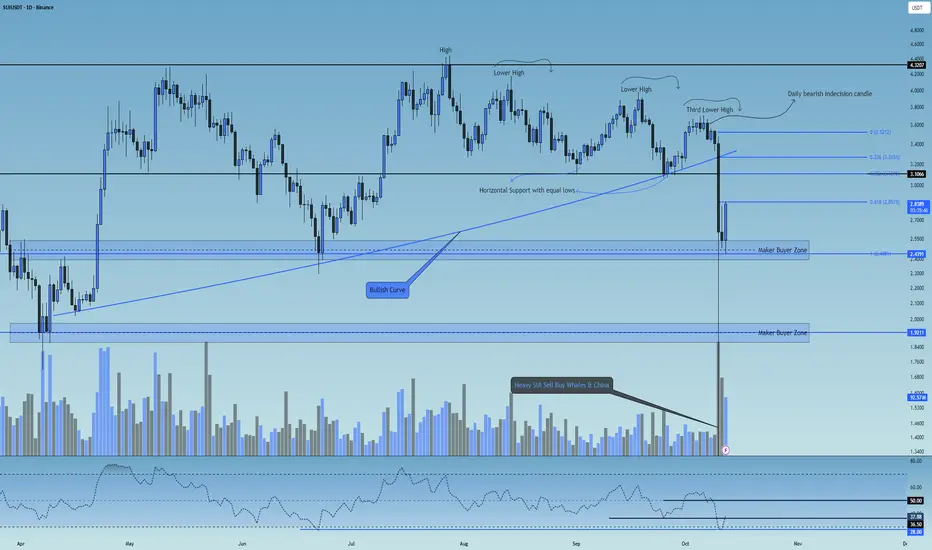
👀 On the daily timeframe of the SUI coin, we can see that SUI was moving along a slightly upward curved line, continuously forming higher highs and higher lows. After creating a top around the $4.3 zone, it faced a strong rejection and dropped toward the $3.3 support area. From there, it started forming lower highs and lower lows, practically entering a descending channel.
At the third and final lower high, SUI formed a strong daily indecision candle, which broke its multi-timeframe support at the $3.5 zone and continued moving downward. During the historic flash crash night of crypto, SUI opened around $3.4, then plunged to $0.5. Following exchange buybacks and market maker interventions, it made a massive upper shadow wick back toward the $2.6 zone, where it finally closed its daily candle.
🧮 Looking at the RSI oscillator, SUI experienced a heavy rejection from the 57 level, dropping below 50 and moving toward its daily oversold zone. The key RSI levels are currently around 36.5 and 50, with the 36.5 zone acting as the nearest crucial pivot level. A bounce from this region would slightly reduce the fear and FOMO of a deeper drop among traders.
🎮 A Fibonacci retracement drawn from $3.5 down to the market maker support zone at $2.43 reveals several important resistance levels. The 0.618 zone serves as a major resistance level—if this level breaks, it could lead to a higher low formation above $2.5, signaling a potential bullish reversal. The next resistance lies around 0.382, which is currently out of buyers’ immediate reach.
🕯 The recent candle sizes and volumes indicate strong selling pressure and rapid price teleportation downward. Signs of this drop could already be seen through the bearish indecision daily candle, but such an extreme dump couldn’t have been predicted purely by technicals. This crash was largely caused by Chinese fund managers selling their holdings, with large wallets entering risk-off mode, unwilling to take further losses. They, along with the Chinese government, sold off their SUI positions to prevent deeper damage—a case of “prevention is better than cure.”
During the recovery phase, exchanges executed significant buybacks, and because the price had fallen to major discounts, many market-making buyers placed strong limit orders at low levels, which helped drive the price back upward.
🪙On the weekly timeframe (SUI/BTC pair), this trading symbol has an extremely critical bottom—losing it could lead to a deep correction that would heavily impact SUI’s core structure. Thanks to buyer support and exchange buybacks, this bottom hasn’t yet been broken in the current weekly candle. There’s also a dynamic resistance trendline pressing down on its relative value; currently, SUI is in the final third of this price compression phase. If this trendline breaks, SUI could gain relative strength against Bitcoin and move upward.
🧠 Currently, SUI sits below its key resistance zone at $2.85. A break and daily close above this level could allow SUI to form a higher low compared to its flash crash bottom, retracing part of the recent drop and providing a better exit opportunity for many holders and traders.
This scenario will be updated with more precision and detail in future analyses.
❤️ Disclaimer : This analysis is purely based on my personal opinion and I only trade if the stated triggers are activated .
ETH 1D Analysis - Key Triggers Ahead | Day 32☃️ Welcome to the cryptos winter , I hope you’ve started your day well.
⏰ We’re analyzing ETH on the 1-Day timeframe .
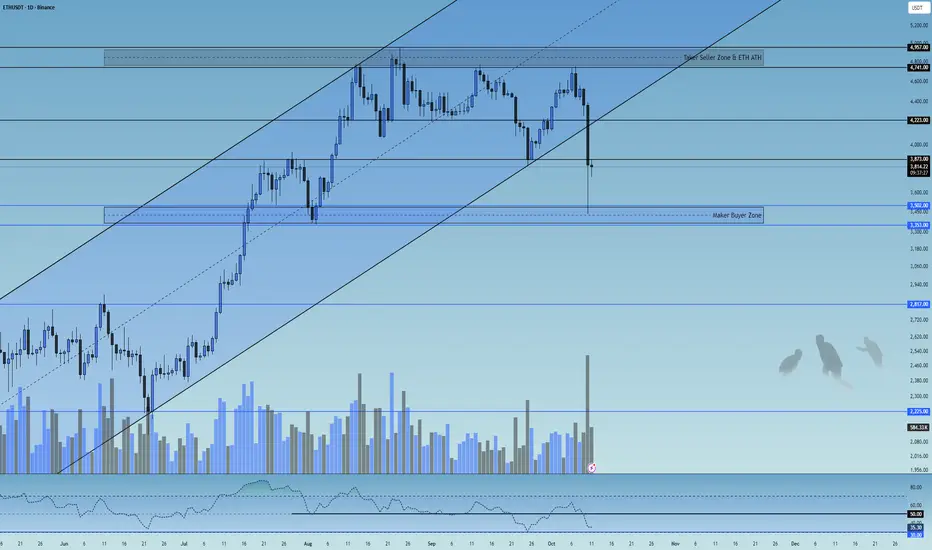
👀 On the Ethereum daily timeframe, we can see that after the historic economic war between the U.S. and China, Ethereum broke its ascending channel with a high-volume whale candle and has now managed to stabilize below this channel. Currently, Ethereum is in a critical decision-making zone, with two key resistance levels at $3,873 and $4,223.
A break and confirmation above these zones, especially $4,223, could lead to a bullish continuation; otherwise, a breakdown below the channel support may trigger a deep correction and cause Ethereum to enter a risk-off phase on the higher timeframe (weekly).
🧮 Looking at the RSI oscillator, after crossing down from the 50 level, it is now heading toward the 30 and oversold region. These two zones — 50 and 30 — are our key RSI levels, and when volatility crosses these zones, it can be accompanied by a significant increase in trading volume.
🕯 The recent daily candle of Ethereum has shown a massive amount of sell volume, with an open around $4,400 and a close below $3,900 (ignoring the shadow). This indicates strong selling pressure — if buyers fail to hold Ethereum above $4,200, we could see further correction and selling pressure ahead.
🧠 Currently, there’s no specific trigger for Ethereum, but a trading range will likely form in this zone until the end of the week.
A break of either the top or bottom of this range across multiple timeframes could give us a potential long or short position.
❤️ Disclaimer : This analysis is purely based on my personal opinion and I only trade if the stated triggers are activated .
BTC 1D Analysis - Key Triggers Ahead | Day 54☃️ Welcome to the cryptos winter , I hope you’ve started your day well.
⏰ We’re analyzing BTC on the 1-Day timeframe .
👀 After the start of the trade war between the United States and China, news was released about a 100% tariff imposed by the United States on China. The crypto market experienced an unbelievable heavy drop (flash crash) last night, which from a technical point of view was completely unexpected and caused the biggest financial loss in the history of crypto.
👍 On the Bitcoin chart and in the daily timeframe, we can see that it is inside a very strong ascending channel, which even with last night’s drop has not closed below its channel body. Currently, Bitcoin is ranging with support at the bottom of the channel, and since it’s the weekend, the market volume has decreased sharply, and we are in a state of uncertainty until the new week’s open.
💡 Note that Bitcoin has not yet entered a trend reversal for the start of its heavy drop. The reversal zone that I specified in the analysis is between $108,960 and $107,521. With a break and confirmation below this zone, Bitcoin can experience a deeper correction and end its long-term primary trend and enter a secondary trend. We can also consider this zone as a distribution area.
Also note that Bitcoin’s return inside the channel has been supported by strong buyers, which has caused this uncertainty. In summary, Bitcoin has a very important resistance in the $114,351 zone, and with a break and confirmation above this area, it can move upward and turn the flash crash into a continuation move. In the continuation of the analysis, we will also use indicators and volume to reach the best conclusion.
🧮 In the RSI oscillator, we can see that after the selling pressure and increase in volatility, it moved downward and easily crossed the 50 zone. We have now defined two key RSI zones:
Zone 50 can be our long trigger area.
Zone 37, where if volatility passes below this level, Bitcoin can move toward the oversold area in its daily timeframe and experience a deeper correction.
🕯 First, let’s talk about volume — the selling pressure was so strong that it pushed the Bitcoin price near $102,000, and then it faced support from buyer makers (those who buy with market-type orders), which brought the price back above $110,000. The size of Bitcoin’s recent candle has been very strong and large, showing the great power of the sellers. With the increase in selling volume and continuation of the tariff war, the market can enter a risk-off state in higher timeframes, and investors may sell their Bitcoins, putting more selling pressure on BTC.
🧠 With the intensification of the tariff war between the U.S. and China, Bitcoin may start its secondary trend after weeks and months of bullish movement, but we still can’t make a definite decision about this issue. So we are waiting for the break of the defined zones in the analysis to make the best decision. Last night’s event was truly painful — a big experience and lesson for all of us that if we can manage our capital, we can have the best results relative to the market. However, last night will be remembered as the biggest financial loss in crypto history.
❤️ Disclaimer : This analysis is purely based on my personal opinion and I only trade if the stated triggers are activated .

BTC 1H Analysis - Key Triggers Ahead | Day 53☃️ Welcome to the cryptos winter , I hope you’ve started your day well.
❤️ I sincerely apologize to everyone in the channel — I’ve been down with a cold for several days. Now, let’s dive into the 1-hour Bitcoin analysis.
⏰ We’re analyzing BTC on the 1-Hour timeframe .
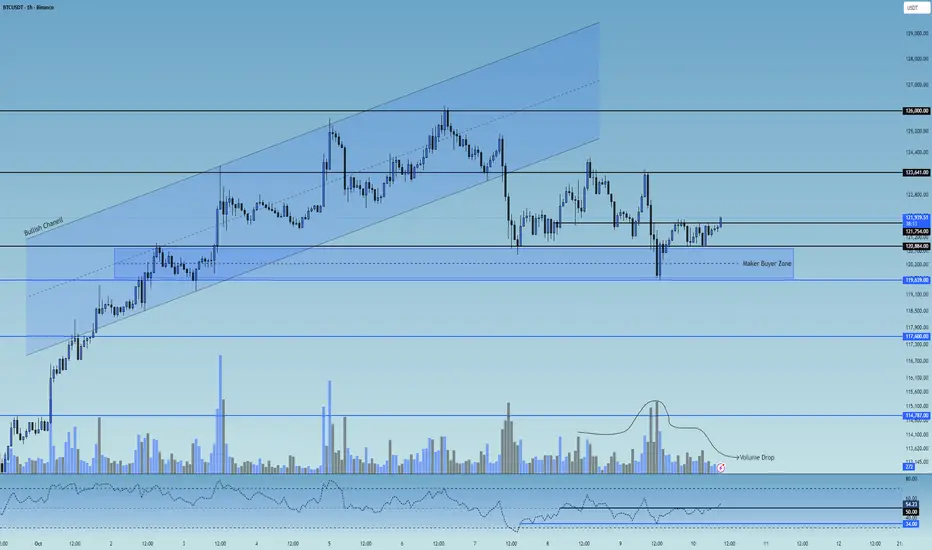
👀 In the 1-hour timeframe, after a strong bullish rally, Bitcoin broke below its ascending channel and moved toward the $121,000 support zone. From there, increased buying volume pushed the price upward, but it got rejected from the $123,600 resistance** and pulled back, creating a long trigger at that zone.
As it moved toward lower support levels, it formed a micro buyer zone between $119,640 and $120,884, where each time price enters this zone, Bitcoin experiences noticeable buying pressure.
🧮 Looking at the RSI oscillator, after ranging below the 50 level, it’s now trying to break above it. The 50 level has become a **strong static resistance, while there’s swing support near 34.
If the RSI breaks out of these marked zones, it could trigger stronger volatility and expand both **short and long trading opportunities.
🕯 The size and volume of recent candles on the 1-hour chart show range-bound movement, weak momentum, and market indecision, forming a **multi-timeframe trading range** where the top and bottom boundaries act as trigger zones.
The **micro buyer zone is where buyers aggressively defend price through market orders, preventing further downside — a reversal candle forming inside this zone is a strong example of that.
▶️ **Today’s economic news related to U.S. monetary policy can impact the market significantly. Since Bitcoin is currently in a small trading range, upcoming volatility spikes from the news could provide short-term setups.
↗️ Risky Long Scenario:
Look for a breakout above the marked $121,754 zone, accompanied by an engulfing candle, **indecision signal, SMA-7 confirmation, and increasing volume in the direction of the breakout — especially if the news comes out risk-on (positive for markets).
📉 Very Risky Short Scenario:
If price breaks below the micro buyer zone and loses the swing RSI support near 33, Bitcoin could enter a deeper correction.
However, note that a drop in Bitcoin’s price often increases its attractiveness compared to other assets, so avoid rushing into shorts.
❤️ Disclaimer : This analysis is purely based on my personal opinion and I only trade if the stated triggers are activated .
BTC 1H Analysis - Key Triggers Ahead | Day 52☃️ Welcome to the cryptos winter , I hope you’ve started your day well.
⏰ We’re analyzing BTC on the 1-Hour timeframe .
👀 On the 1-hour timeframe, Bitcoin has broken through all major resistance levels, setting a new ATH, and then experienced a 2% price drop due to profit-taking and FOMO-driven selling. It then moved toward its key support zone around $122,584, bounced from there, and is now moving toward its early trigger zone at $124,113.
🧮 The RSI oscillator shows two important levels — 63 and 45 — and once the volatility threshold crosses especially above 63, Bitcoin could see a sharp increase in volatility, activating its triggers and enabling breakout moves.
🕯 Bitcoin’s volume has decreased after each touch of resistance, but now with a noticeable volume increase, our early trigger could become active, allowing Bitcoin to form larger, high-volume candles either upward or downward. Since the high-wave cycle remains bullish, the current scenario still favors upside continuation and resistance breakouts.
🧠 For Bitcoin positions, it’s better to wait for all confirmations to align — including activation of the early trigger, an RSI breakout above 63, and rising buy volume — before opening a long position.
❤️ Disclaimer : This analysis is purely based on my personal opinion and I only trade if the stated triggers are activated .

XRP 1H Analysis - Key Triggers Ahead☃️ Welcome to the cryptos winter , I hope you’ve started your day well.
⏰ We’re analyzing XRP on the 1-Hour timeframe .
👀 On the 1-hour timeframe, XRP recently completed a solid bullish rally, reaching resistance around $3.06, before retracing toward its local support zone near $2.94. The coin has tested its top level about three times, getting rejected each time under selling pressure. After the latest rejection and rebound from the $2.94 zone, a short-term trigger has formed around $2.98 — a breakout above this level could significantly increase the likelihood of a resistance breakout.
🧮 The RSI oscillator shows that after ranging below the 50 zone, it has now crossed above it and is heading upward. A 1-hour candle close above the trigger zone would confirm bullish momentum; otherwise, the move risks failing.
🕯 The recent candle structure on the 1-hour chart has been relatively range-bound, partly due to low market activity during holidays. However, with increasing volume and the larger size of recent bullish candles, there’s potential for stronger upward continuation.
🧠 For XRP positions, traders can consider low-risk entries once a candle closes above the marked trigger zone in this analysis. Rising volume and strong candle closures may fuel volatility and expand long opportunities.
❤️ Disclaimer : This analysis is purely based on my personal opinion and I only trade if the stated triggers are activated .

CRV 1D Analysis - Key Triggers Ahead☃️ Welcome to the cryptos winter , I hope you’ve started your day well.
⏰ We’re analyzing CRV on the 1-Day timeframe .
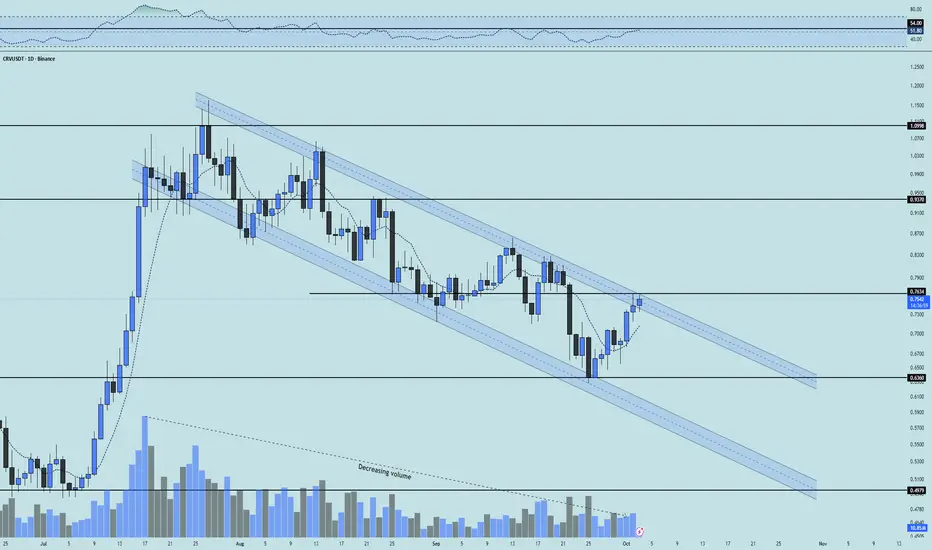
👀 On the daily timeframe for CRV, we can see that after a strong rally, the coin entered a corrective descending channel. Now there are signs of a potential breakout from this channel on this timeframe. If the channel’s upper boundary is broken — which overlaps with the key resistance at 0.7634 — we can say a new bullish trend is starting for this coin. That would mean it’s leaving this compression and correction phase and forming a new upward structure. On the USDT pair, CRV has already managed to build a higher low, and on the BTC pair, it is also gaining momentum for a move. This coin can be added to your watchlist for trading opportunities.
🧮 Looking at the RSI oscillator, after a long period fluctuating below the 50 zone, it is now heading toward its resistance near 54. If RSI pushes through this level, it could break that oscillation resistance and continue higher.
🕯 Since the start of the correction, trading volume has declined, but some long-term holders are still keeping this coin and adding more. These informed buyers may resume accumulation once the descending channel is broken. Pay attention: with an increase in volume, this coin could experience a sharp rally. Recent candles also show stronger buying pressure compared to earlier ones.
💸 On the BINANCE:CRVBTC trading pair, we see a similar descending channel as the USDT pair. If the descending channel breaks on the USDT chart, a similar breakout could occur here, drawing whale attention and fueling a pump with strong growth potential for CRV. A major resistance lies at 629 on this pair; breaking that level would significantly increase the chance of a channel breakout and a strong upward move.
🧠 For trading this coin, a long scenario exists: if the CRV/BTC pair breaks resistance, strong buying volume could flow into CRV. On the USDT pair, if the channel top is broken, with a daily candle close above the prior day’s wick and RSI confirming above 54, a new bullish structure could form for this coin.
❤️ Disclaimer : This analysis is purely based on my personal opinion and I only trade if the stated triggers are activated .
BTC 1H Analysis - Key Triggers Ahead | Day 51☃️ Welcome to the cryptos winter , I hope you’ve started your day well.
⏰ We’re analyzing BTC on the 1-Hour timeframe .
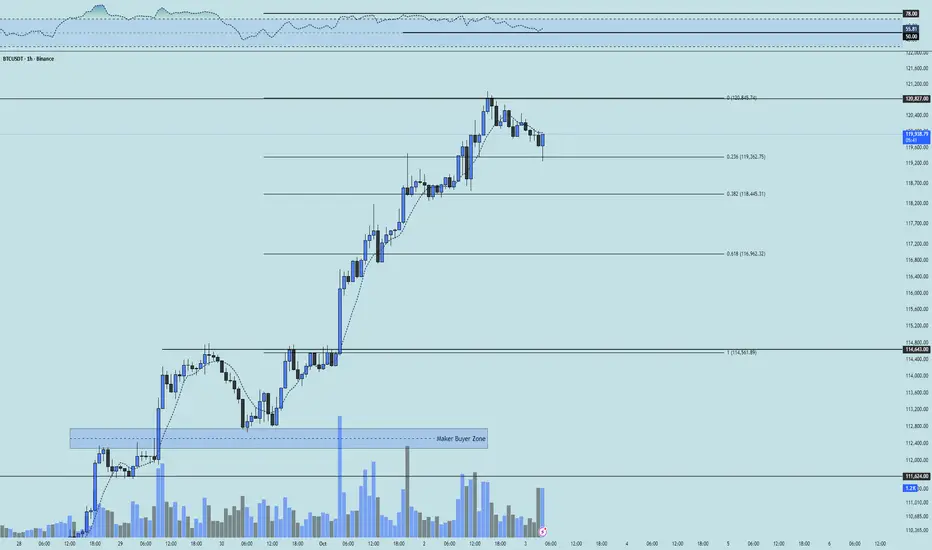
👀 On the 1-hour timeframe for Bitcoin, we can see that after this recent bullish leg, price has now reached its resistance at $120,827. If this resistance breaks — a zone packed with short orders — Bitcoin could start an extremely sharp and powerful upward leg, essentially triggering a short squeeze. At the moment, Bitcoin is entering a corrective phase; with the start of this correction, price could head down toward its Fibonacci retracement supports, bounce from one of those levels, and then form a new trading structure.
🧮 Looking at the RSI oscillator, price has been ranging around the 70 zone and briefly entered overbuy. It is now moving toward the 50 area, its oscillation mean. A break below 50 could deepen the correction, but if support holds, RSI could again head toward the resistance zone near 70 and re-test the overbought boundary.
🎮 The Fibonacci retracement drawn from the breakout at $114,562 to $120,827 highlights several strong support areas. The most important zones for Bitcoin are the 0.236 and 0.382 retracement levels. Support here, followed by a fresh structure, could set up strong trading opportunities.
🕯 The size and volume of buy candles have been exceptionally strong and increasing — something rarely seen in Bitcoin with such a one-sided move to the upside. Now, during this corrective phase, even as selling pressure appears, roughly 70% of that sell volume is being absorbed by buyers. What we must watch closely is how buyers decide to allocate capital from here. If the key Fibonacci levels are lost, we respect the market’s decision and only then consider new trades.
🧠 For a Bitcoin position If you don’t have an open position, I recommend waiting for a new structure to form at critical Fibonacci levels, and only enter after a breakout of that structure.
If you already hold a position, consider partial profit-taking, since USDT dominance has also reached an important support zone.
❤️ Disclaimer : This analysis is purely based on my personal opinion and I only trade if the stated triggers are activated .
ETH 1H Analysis - Key Triggers Ahead | Day 30❄️ Welcome to the cryptos winter , I hope you’ve started your day well.
⏰ We’re analyzing ETH on the 1-Hour timeframe .
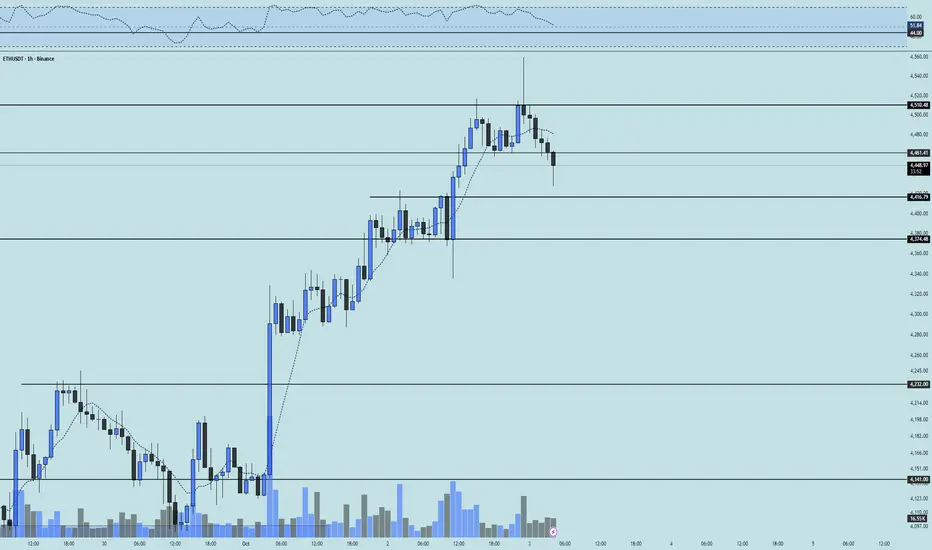
👀 On the 1-hour timeframe for Ethereum, we can see that after reaching its resistance area at $4510, it reversed from that zone and moved downward. At the same time, Ethereum had support at $4461; if this support breaks, it could enter a healthy correction and head toward its marked support levels, forming a new structure afterwards. At that point, we could consider entering an Ethereum position. However, since breaking the level highlighted in previous analyses, Ethereum has already gained 11% up to now.
🧮 Looking at the RSI oscillator, we see that for roughly a day it stayed above the 50 area up to the overbuy boundary near 70. The 70 zone then acted as a static resistance, preventing Ethereum from entering its overbought state. As a result, selling pressure started, and price is now heading toward its swing support around 44.
🕯 The volume, count, and size of buy candles during the recent upward leg were strongly increasing, but not as strong compared to Bitcoin, since Bitcoin dominance didn’t drop significantly. Consequently, now we see sell candles increasing after hitting the 4510 resistance, completing a pullback from its bullish leg.
💸 Looking at the BINANCE:ETHBTC trading pair, we see that it moved upward along with ETH/USDT, but the percentage move was weaker than the tether pair. Whale interest in this pair is currently low, and it may not hold strong weight for them, especially since Bitcoin dominance didn’t fall heavily in this phase. The next trigger level for a breakout and rally in ETH/BTC is around 0.03753; if that zone breaks, Ethereum’s relative value could increase significantly.
🧠 For an Ethereum position, I think we should wait until a new structure forms, with fresh support and resistance zones created by whales. Then, after a breakout of that new structure, we could enter a trade. Another reason I don’t have an immediate scenario for Ethereum is that it has already rallied 11% and is now within a corrective phase.
❤️ Disclaimer : This analysis is purely based on my personal opinion and I only trade if the stated triggers are activated .
BTC 1H Analysis - Key Triggers Ahead | Day 50☃️ Welcome to the cryptos winter , I hope you’ve started your day well.
⏰ We’re analyzing BTC on the 1-Hour timeframe .
👀 On the 1H timeframe for Bitcoin, after breaking through the taker-seller zone around $117,550, price pushed up toward its resistance area near $120,000. From there, we’ve started to see early signs of rejection. With a 1H candle close rejecting this zone, we can say that after such a strong rally, Bitcoin is now entering its corrective phase, moving back toward its key support levels. Let’s break it down deeper.
🧮 The RSI oscillator, after consolidating for about 1 day and 6 hours around the overbuy boundary, has now started to exit that zone. This suggests potential downside momentum toward its key swing supports. Keep in mind, a static swing resistance formed at the 78 level in overbuy territory. If that breaks — along with the taker-seller zone — long trades could push RSI up toward 91 before facing a possible rejection (a less likely scenario for now). At this stage, I don’t have a clear key support zone to highlight, but with corrective structure forming, I’ll point out the levels to watch in future updates.
🕯 Today’s buying candles expanded slightly in size and volume following the weaker USD news. However, because the move up has been sharp and the number of selling candles limited, hitting the taker-seller zone increases the probability of a pullback. A strong close with solid selling volume would confirm corrective pressure for Bitcoin.
🧠 I believe the smarter approach is to wait for the corrective structure to play out first. Once the new resistance levels are defined and broken, we can look for setups. Keep in mind, shorting here isn’t ideal — the broader trend is still strongly bullish and momentum is very powerful. The goal is to position for the next high-probability move, not fight the trend.
↗️ Long scenario: A Bitcoin long could be considered on a clean break above RSI 78 combined with a strong candle close above the marked taker-seller zone, ideally supported by increasing buy volume. Multi-timeframe candle setups would give stronger confirmation for entry.
📉 Short scenario: At the moment, I don’t see a high-probability short setup. Long positions are simply carrying more edge (and dopamine).
❤️ Disclaimer : This analysis is purely based on my personal opinion and I only trade if the stated triggers are activated .
APT 1D Analysis - Key Triggers Ahead☃️ Welcome to the cryptos winter , I hope you’ve started your day well.
⏰ We’re analyzing APT on the 1-Day timeframe .
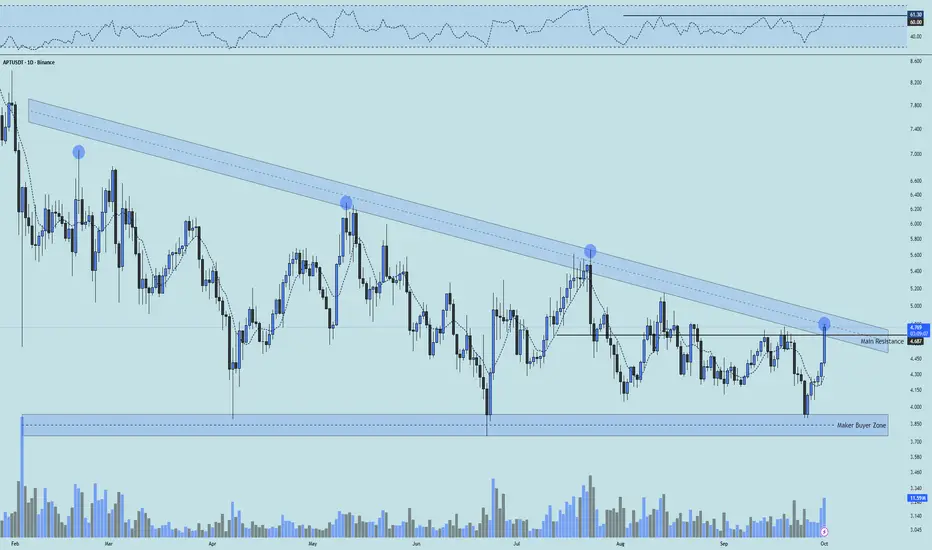
👀 On the daily timeframe for Aptos, we can see it's ranked 36 on CoinMarketCap, and its 24h trading volume is around 16% of its total market cap. This indicates heavy activity and high liquidity. APT is moving inside a triangular range, currently consolidating at the end of this triangle, with signs of a potential breakout. If it breaks and confirms above this structure, the coin could begin a price recovery after 240 days of ranging and selling pressure, pushing toward its higher resistances. The key resistance right now is at $4.7, and a confirmed breakout above this level can send it toward its next resistance zones.
🧮 Looking at the RSI oscillator, it was ranging inside a box between the 30–60 zone. On the 4th touch, the top of the box was broken and RSI crossed above 60. Our main RSI confirmation comes with a daily candle close above the $4.7 resistance, along with RSI stabilizing above 60, which would trigger increased volume, volatility, and even push RSI toward the overbought zone.
🕯 The size, volume, and number of recent green candles after the last touch of the maker-buyer zone have noticeably increased, with 6 bullish candles pushing the price toward the key resistance. Market participants in crypto are waiting to see the reaction here. From a time perspective, the coin spent 240 days in a descending range and completed a proper correction. Now that it's in the final squeeze phase, buying volume has increased well, and if the momentum continues, the coin could see a strong price rally.
💸 On the BINANCE:APTBTC pair, we can see it's at the end of the triangle and has almost pushed above its resistance with a whale candle, though volume is still relatively low. If the price stabilizes above the marked resistance on this pair and we also see rising volume on the USDT pair, a significant outperformance against Bitcoin is likely. This could attract whale attention and encourage rotation from BTC into APT.
🧠 For positioning on Aptos, entering with a reasonable risk makes sense, especially since after 240 days it's showing signs of forming a higher low and potentially a higher high. With a breakout above $4.7, the coin can continue toward its upper resistance levels.
↗️ Long Scenario: Breakout and confirmation above $4.7, with RSI stabilizing above the 60 zone as seen in the analysis, along with a confirmed breakout and support hold on the BTC pair. With increasing long volume and a completed pullback, entering on a secure higher low in multi-timeframe structure would be valid.
📉 Short Scenario (Risky): It's almost unlikely that the coin drops significantly from current levels, but if it does, losing the maker-buyer zone on both USDT and BTC pairs could trigger a deep correction with maximum selling pressure. Keep in mind, short positions in this phase of market compression breakouts are generally illogical since price reversals are very likely in these trends.
❤️ Disclaimer : This analysis is purely based on my personal opinion and I only trade if the stated triggers are activated .
ETH 1H Analysis - Key Triggers Ahead | Day 29❄️ Welcome to the cryptos winter , I hope you’ve started your day well.
⏰ We’re analyzing ETH on the 1-Hour timeframe .
👀 On the 1-hour chart , After breaking lower resistance zones, ETH started a strong bullish leg toward higher resistance. It reacted to these levels but moved upward with micro-buyer support. Currently at $4323, a key seller ticker zone—breaking this could push ETH higher. Note: Trend shows some weakness; sell candles are engulfed but smaller. Over 90% of holders are in profit, causing frequent stop-hunts on selling pressure.
🧮 RSI: After moving from near oversold to overbought, RSI is cooling near the 70 level. With increased long volatility, multiple buy positions could form, but rejection here may lead to a correction. Key static resistance is 70; swing support is at 50.
🕯 Volume & Candles: Recent candle size and volume surged as buyers entered, but approaching $4300 resistance shows trend weakness. Candle size decreased; profit-taking and minor pullbacks are possible. For trend continuation, higher volume and repeated buying pushing ETH toward overbought are needed.
📊 Liquidation Heatmap : Unlike BTC, long and short orders cluster sparsely, forming max-pain zones. ETH approaching $4380 could trigger a short squeeze and remove the seller ticker, pushing toward $4500. Next long max-pain is $4246, with lower support around $4100. ETH is in a near-decision zone with one bullish leg.
💸 ETHBTC Pair Currently in a trading range; the floor is Maker Buyer Zone , the ceiling is Taker Seller Zone. Price bounced well from the floor. High concentration of longs and shorts makes range boundaries critical—breaking either could trigger a sharp move. Price is near 0.037 resistance, RSI close to swing resistance. Buyer and whale support could enable another bullish leg; rejection may slightly increase risk of range breakdown.
🧠 Focus on BINANCE:ETHBTC wait for exit from the trading range, then check ETH/USDT. Often aligns with BTC dominance drops. Selling volume in ETHBTC is decent; if whales add volume, this setup provides optimal trade duration.
↗️ Risky Long Scenario: Break 0.037 resistance ETHBTC, BTC dominance drop, breaking ETH/USDT seller ticker, RSI stabilizes in overbought. Small stop-loss; trade is risky but viable.
📉 High-Risky Short Scenario: Rejection from current zone, ETH/BTC rejection, swing rejections, indecision candles multi-timeframe, SMA7 touch, and rising sell volume could signal short positions.
❤️ Disclaimer : This analysis is purely based on my personal opinion and I only trade if the stated triggers are activated .

BTC 1H Analysis - Key Triggers Ahead | Day 49❄️ Welcome to the cryptos winter , I hope you’ve started your day well.
⏰ We’re analyzing BTC on the 1-Hour timeframe .
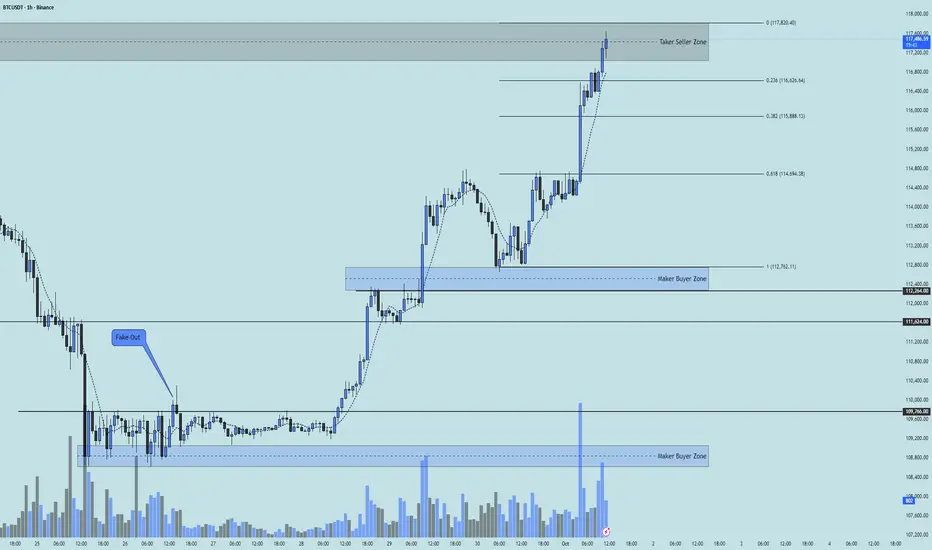
👀 On the 1-hour chart , After a strong bullish rally and breaking the $109,766 zone, BTC managed to move toward $117,000. This level is considered a multi–timeframe daily resistance, and personally I expect a correction here. The second bullish leg, which started after breaking the $111,624 resistance and buyers' micro support at $112,762, is now facing weakness. RSI is also showing reversal signals. The current BTC scenario is a correction toward the marked Fibonacci zones. The upcoming resistance is extremely important, and if it breaks, Bitcoin can continue upward.
🧮 Looking at the RSI oscillator, during both bullish legs it managed to stay firmly in overbought territory, and long-position volatility has significantly increased along with rising buy volume. On the 1H timeframe, RSI doesn’t have a specific key level right now because it has hit a significant swing resistance on the daily timeframe. Breaking out of the marked zone can push BTC higher. This key swing level on the daily RSI is around 61.
🕯 Volume, count, and size of bullish candles have sharply increased. Considering we are sitting at a resistance zone, traders are putting in maximum effort to break it, and volume is rising aggressively. Every sell candle that formed was engulfed by buyers immediately as BTC dipped, and buyers created new positions. Our trend is strongly bullish.
🎮 The Fibonacci is drawn from the start of the new bullish leg to the top of the previous 1H candle's wick. It has identified strong support zones in case BTC corrects, and these levels are considered highly reliable.
📊 The Bitcoin liquidation heatmap currently shows the distribution of short positions, and this spread continues up to $119,000. With upward movement and buyer support, these clusters can get absorbed and liquidated, leading to a short squeeze and a strong move up. Note that the cluster of short liquidations down to $113,000 could get triggered with maximum selling pressure, and this scenario isn’t far-fetched.
🧠 If you haven’t entered a BTC position based on previous analyses, you can wait for corrective support zones to form. Buyer tickers will place their orders below these support levels so we can gain full confirmation before making a BTC entry.
↗️ Long Position Scenario: A break above the seller ticker zone and grabbing accounts holding short positions is required to reduce short-position clusters. Then we need confirmation above our seller ticker zone at $117,820. With the start of a new bullish leg and an indecision candle plus a 7 SMA touch from below, we can open a low-risk long position.
📉 Short Position Scenario: If BTC forms a lower high and lower low with maximum selling pressure, negative economic news, and loses key Fibonacci zones — especially the 61% level — we can consider opening a short. However, as I mentioned in previous days, avoiding shorts and focusing on longs is currently much more in our favor.
❤️ Disclaimer : This analysis is purely based on my personal opinion and I only trade if the stated triggers are activated .
LTC 4H Analysis - Key Triggers Ahead☃️ Welcome to the cryptos winter , I hope you’ve started your day well.
⏰ We’re analyzing LTC on the 4-Hour timeframe .
👀 After the sharp and deep drop that Litecoin experienced in 3 candles, it moved toward its key support in the $102 area and was well supported from this zone. Then it formed a higher low and higher high compared to its previous low and high, and it is now moving to break its resistance in the $107 area. With a 4-hour confirmation on this zone (the taker-seller and key resistance), it can move upward.
🧮 Two key zones are considered for the RSI oscillator: the 63 level, which is close to the 70 zone—if the volatility crosses this level, Litecoin can move toward overbought. The second zone is the entry threshold into oversold.
🕯 The size and volume of the candles in the recent drop, which can be considered a price correction, are really significant and large. Scattered sell orders are placed above the area we marked, which causes our green candles below this zone to appear a bit smaller. To break the specified taker-seller area, we need a large candle with relatively high volume that fully confirms (stabilizes) on this zone to shape our bullish and high-momentum trend.
💸 BINANCE:LTCBTC is bearish against the Bitcoin pair and has not turned bullish yet, but it is positioned a bit above its support floor. With a breakout of the taker-seller zone in the USDT pair, the Litecoin/Bitcoin pair might also turn bullish, which would increase the movement momentum and the size of the candles.
🧠 For a Litecoin long position, we have to wait until we confirm above this taker-seller area with a strong whale candle and then examine the available scenarios for the breakout.
↗️ Long position scenario: breaking the taker-seller area and key resistance at $107 along with whale candles, and then observing a multi–time frame indecision candle, which will also give us a smaller stop size.
📉 Short position scenario: if the market wants to give a heavy and strong correction, the $102 area can be a good zone for a floor break and a short position on this coin—but the important point for us is that Litecoin is about to start a good bullish trend.
❤️ Disclaimer : This analysis is purely based on my personal opinion and I only trade if the stated triggers are activated .

DOGE 1D Analysis - Key Triggers Ahead❄️ Welcome to the cryptos winter , I hope you’ve started your day well.
⏰ We’re analyzing BINANCE:DOGEUSDT on the 1-Day timeframe .
👀 Daily timeframe on Dogecoin shows it’s moving inside a strong ascending channel. Right now, price is sitting below the midline resistance of the channel, while holding support from an uptrend line. DOGE is in a decision zone, and because it’s the weekend, volume has dropped. Breaking out of the structure it has formed may happen with the new weekly open.
If Dogecoin loses the trendline support, it can head toward the bottom of the channel at $0.17. If it breaks the resistance it’s reacting to, price could move toward the top of the channel at $0.30, and even break to higher levels.
🧮 RSI shows two key zones the 70 level acts as resistance and marks entry into OverBuy, and the 38 level is a static support zone. If price crosses below that 38 level, short-side volatility can increase heavily and push RSI into Oversell.
🕯 Candle size and volume behavior from the start of the channel show volume and candle size decrease near the top and increase near the bottom. Right now, because price is at the midline area, it has rejected this level with a stronger red candle and bigger volume, moving lower. For price to move back above the midline and break that resistance, we need to see an increase in buying volume and larger bullish candles so a trend reversal can form toward higher resistances.
💸 BINANCE:DOGEBTC pair shows price moving along an ascending trendline similar to the DOGE/USDT pair. This trendline acts as a confluence: every touch so far has pushed price upward. Now we are on the fourth touch. If the daily candle closes below this trendline, a deeper correction can happen and push Dogecoin to lower support areas.
🧠 For trading DOGE, patience is needed and we should wait for higher timeframe candle closes. Once price confirms at the marked levels, the new trend and breakout from current structure will be clear and we can open positions. That gives us two possible scenarios:
1️⃣ Short position scenario : Break and close below the trendline that overlaps on both DOGE pairs, RSI dropping under the 38 zone, volume increase, and a confirmed breakout from the current structure on multi-timeframe view.
2️⃣ Long position scenario : A reaction from the overlapping trendline support on both pairs, RSI holding above the 38 zone, then a break of the nearest multi-timeframe resistance to build a higher low and higher high. If that plays out, I’ll update this scenario.
❤️ Disclaimer : This analysis is purely based on my personal opinion and I only trade if the stated triggers are activated .

BTC 1H Analysis - Key Triggers Ahead | Day 48❄️ Welcome to the cryptos winter , I hope you’ve started your day well.
⏰ We’re analyzing BINANCE:BTCUSDT on the 1-Hour timeframe .
👀 On the 1-hour timeframe, Bitcoin previously formed a consolidation box at a higher range. After breaking the bottom of that box, it moved down to its support area around $108,800. Since the start of the weekend, price has been ranging in this zone, forming a new consolidation structure. The bottom of this range overlaps with the Tether Dominance resistance, creating a key confluence level. Candle size has been shrinking, signaling an incoming decision point for the next move.
A break above the range high at $109,755 could trigger upward momentum. An important detail here is the fakeout at the top of the range, where buyers failed to push higher and sellers drove price back down.
🧮 The RSI oscillator shows two key levels:
52: Slightly above the 50 baseline, acting as momentum resistance.
30: At the oversold boundary, where a breakdown could start a stronger move.
The previous fakeout at the range high was aligned with a rejection from the RSI resistance around 52, which reinforces the validity of this level. A momentum breakout through this zone could support a long setup.
🕯 Candle size and volume have significantly decreased due to consolidation and the weekend lull. With increased volume at the start of the new week, we can expect stronger candles. It doesn't matter which direction initiates the move — the breakout from this range will likely occur through a whale candle that clears the orderbook in one direction.
💵 From earlier Tether Dominance analysis, a break below 4.46% could inject bullish volume into the market and allow Bitcoin to break its range high and begin a new upward leg. However, a break above 4.72% on Tether Dominance could trigger deeper correction in Bitcoin, pushing it toward lower supports.
🧠 Two main scenarios for Bitcoin positions are currently in play:
1️⃣ Long Setup :
Wait for multiple rejections to complete and for Tether Dominance to lose the 4.46% support. A small green indecision candle before the breakout on Bitcoin would offer a clean entry with a tight stop. As volume increases and confirmation appears, the long position can be held to a suitable reward target. This setup can be taken in inverse correlation to Tether Dominance, using bearish candles there as confirmation.
2️⃣ Short Setup :
If Tether Dominance breaks above resistance and Bitcoin loses its current range support — combined with RSI dropping below 30 and price stabilizing under current support, ideally with a red indecision candle — a short setup becomes valid. However, note that Bitcoin demand is currently rising, and upward movement could occur at any moment. Personally, you prefer not to take short positions here.
❤️ Disclaimer : This analysis is purely based on my personal opinion and I only trade if the stated triggers are activated .

USDT.D 1H Analysis - Key Triggers Ahead❄️ Welcome to the cryptos winter , I hope you’ve started your day well.
⏰ We’re analyzing CRYPTOCAP:USDT.D on the 1-Hour timeframe .
👀 On the 1-hour timeframe, Tether Dominance moved upward after breaking above the 4.46% level. However, buyers were unable to push through the 4.72% resistance, and the market reacted (rejected) at that zone. This reaction formed a multi-timeframe consolidation box. The top and bottom of this box now act as key levels to determine the next market direction:
Break above 4.72% ➝ Potential for deeper correction in the crypto market.
Break below 4.46% ➝ Possible trend reversal and confirmation of renewed upside momentum.
The market is currently in a low-volume weekend phase, and price action is range-bound. With the start of the new week, there’s a higher probability of breaking out of this consolidation.
🧮 The RSI oscillator shows that after reaching the overbuy zone, price couldn’t sustain time there and was quickly rejected, forming the current market floor. Another key RSI level is around 44, which aligns with the 4.46% support. If momentum crosses below this zone, volatility could increase and trigger the next leg of movement.
🕯 On the 1-hour chart, there have been numerous green candles, indicating a deeper market correction as earlier buyers take profit and sell. This move continued until the 4.72% resistance, and the current range structure shows:
Red candles slightly larger
Green candles more frequent but smaller
This signals weakening bullish momentum, increasing the likelihood of a break below the 4.46% support.
🧠 With the current sideways structure, two main scenarios are in play:
1️⃣ Breakdown of the lower boundary (4.46%)
Could trigger a strong bullish leg in crypto, pushing the market upward.
If this happens, it could be an ideal scenario, supporting a broader crypto rally.
2️⃣ Breakout above the upper boundary (4.72%)
Would likely lead to a deeper correction across the market.
This scenario could result in significant drops in Bitcoin and Ethereum.
Keep both the ceiling and floor of Tether Dominance in mind as the new week begins. The current range is relatively narrow, meaning a breakout could even occur as early as tomorrow during the New York session.
❤️ Disclaimer : This analysis is purely based on my personal opinion and I only trade if the stated triggers are activated .

BTC 15M Analysis - Key Triggers Ahead | Day 47❄️ Welcome to the cryptos winter , I hope you’ve started your day well.
⏰ We’re analyzing BTC on the 15-Minutes timeframe .
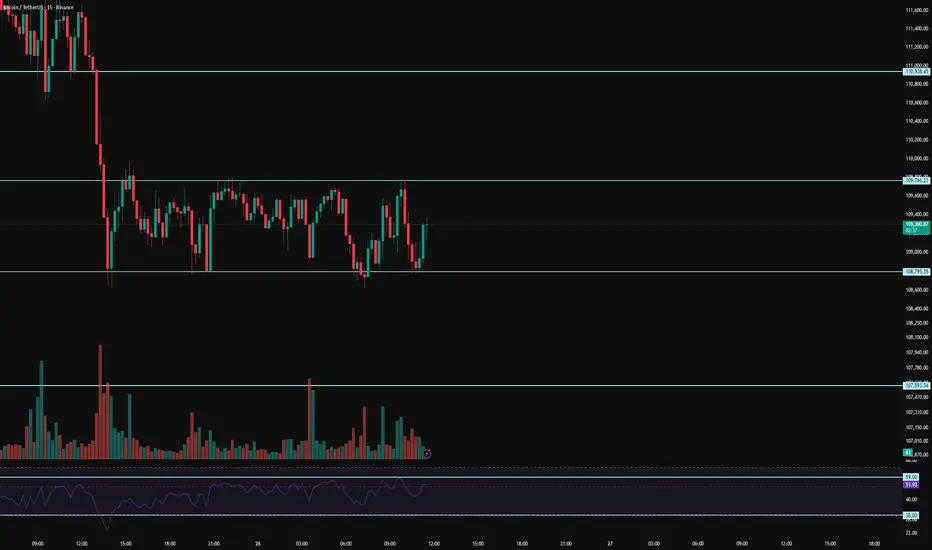
👀 After several days of decline from the zones we previously identified, we are back to analyze Bitcoin for you. On the 15-minute timeframe, Bitcoin is consolidating above the $108,800 support level, with the upper boundary of this consolidation at $109,760. A breakout above this level could signal the beginning of a new structure and trend. A breakdown below support, however, seems less convincing for a short position, as many traders who feel they missed out are now stepping in to buy. Current support zones are acting as both maker and taker buy levels. Bitcoin requires increased volume to confirm either a breakout or breakdown. With the upcoming weekend, however, risks must be carefully managed due to typically lower market activity.
🧮 Looking at the RSI oscillator, it is currently holding above the 50 level but facing resistance around 59. A breakout above 59 could enable Bitcoin to break consolidation resistance and push higher. On the other hand, a key zone lies near the oversold boundary; if Bitcoin enters this area, selling pressure could intensify and trigger a deeper correction.
🕯 Candle size and volume on the 15-minute chart remain within a range. We must wait for significant volume inflow—either upward or downward—to confirm direction. Bitcoin is shaping a new structure for the upcoming week, so patience is required until a breakout with decisive green or red candles occurs.
🧠 Trading outlook: It is preferable to wait for market structure to mature, with multiple tests of both support and resistance. The candlestick type used for entry is crucial, along with momentum confirmation at key RSI levels. A breakout above $109,766 combined with RSI surpassing 59 could provide a long setup. A breakdown below $108,795 combined with RSI falling below 30 and stronger selling pressure could trigger a short setup. Keep in mind that weekend trading usually comes with lower volume, which may result in indecisive structures—unless an unexpected global event sparks volatility.
❤️ Disclaimer : This analysis is purely based on my personal opinion and I only trade if the stated triggers are activated .
PARTI 4H Analysis - Key Triggers Ahead❄️ Welcome to the cryptos winter , I hope you’ve started your day well.
⏰ We’re analyzing PARTI on the 4-Hour timeframe.
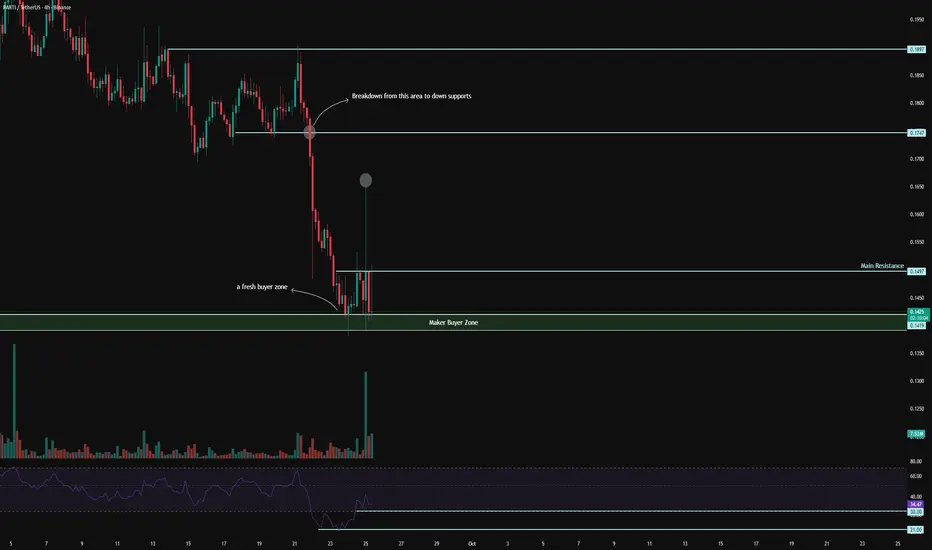
👀 On the 4-hour timeframe, Coin Party has flashed a strong sell signal after losing support at 0.1747, and is now moving toward its lower support zones. The overall trend on higher timeframes remains heavily bearish, with capital inflows steadily exiting the asset in a step-by-step manner.
Meanwhile, a relatively strong micro-buyer zone had formed, which initially pushed the price upward upon contact, but heavy selling pressure soon drove it back down. This level now represents the last defensive support for maintaining price stability. Losing it could trigger a move toward the coin’s key initial-offer support — or, at best, bring it close to that zone.
🧮 On 4-hour timeframe RSI OscillatorFrom a timing perspective, after losing the 0.1419 floor, the coin has been under intense selling pressure for 2 days. It is currently emerging from the oversold zone, sitting just below the 50 resistance level. Key areas remain at 30 and 21; a cross below 30 could generate a volatility-driven target near 21.
🕯 The size, volume, and frequency of red candles are increasing, reflecting heavy selling pressure. Sellers are actively acting as ticker sellers, absorbing any upward moves. Each price attempt away from support meets with stronger sell pressure.
🧠 For new entries, there is a strong possibility of whale-driven sell waves. Patience is key: we wait for the RSI to retest the 30 zone, and upon a confirmed breakdown of the current support floor, we can consider opening short positions.
❤️ Disclaimer : This analysis is purely based on my personal opinion and I only trade if the stated triggers are activated .