Technical Analysis: Watawala Plantations PLCThe weekly chart for Watawala Plantations PLC shows a strong long-term uptrend characterized by a series of higher highs and higher lows. However, the price is currently entering a cooling-off phase.
Key Technical Observations
Trendline Support: The stock is respecting a steady ascending trendline that has been in place since late 2024. This line serves as the primary "backbone" of the current bullish structure.
Support Zones: The blue shaded boxes indicate "Support-Turned-Resistance" zones. The most immediate support sits around the 44.0 LKR mark, where previous price peaks have now become a floor for buyers.
Fibonacci Retracement: The chart displays Fibonacci levels on the right. If the price breaks below 44.0 LKR, the next major structural levels to watch are the 0.382 (40.0 LKR) and 0.5 (36.0 LKR) retracements.
Current Momentum: The blue arrow suggests a short-term bearish "arc" or rejection from recent highs near 50.0 LKR. The price is currently retreating toward the nearest support zone.
Summary
The outlook remains bullish long-term as long as the price stays above the diagonal trendline. In the short term, expect a consolidation or minor pullback toward the 43.0 - 44.0 LKR range. Investors should watch for a bounce at this level to confirm the continuation of the uptrend.
Cse

Technical Analysis: Access Engineering PLCAs of February 2026, the technical outlook for Access Engineering (AEL) shows a stock that has demonstrated significant long-term growth, with a 1-year return of approximately 86% and a 5-year return of 185%.
Key Technical Indicators
Price Momentum: The stock exhibits strong price momentum with a market capitalization of roughly LKR 71 billion.
Trend Analysis: Historically, the stock has followed a clear uptrend. In late 2024, technical patterns showed the formation of a "Higher High" at 31.80 followed by a retracement, suggesting typical consolidation within a bullish cycle.
Support & Reversals: Analysts previously identified possible reversal zones around 29.80, utilizing Fibonacci levels to confirm support during pullbacks.
Volatility: Weekly volatility has remained relatively stable at approximately 3% over the past year, indicating consistent price action compared to the broader market.
Market Position & Outlook
Valuation: The current Price-to-Earnings (P/E) ratio is approximately 11.29x, which is lower than the broader LK market average of 13.3x, potentially suggesting a more attractive entry point relative to earnings.
Supply & Demand: The stock has benefited from an improving investor sentiment as the construction sector rebounded in 2024, though it faces occasional overvaluation alerts when price exceeds intrinsic value significantly.
Dividends: AEL maintains a dividend yield of approximately 2.8% to 2.9%, providing a steady return component for long-term holders.

Technical Analysis: John Keells Holdings PLCThis monthly chart for John Keells Holdings reveals a stock in a long-term recovery phase, characterized by a steady ascending channel that began after the 2020 lows. Here is a breakdown of the key technical elements:
Key Observations
Ascending Channel: Since 2020, the stock has been respecting a rising price channel. It is currently trading near the median line (dotted), suggesting a balanced momentum between buyers and sellers.
Major Supply Zone: There is a significant overhead resistance (Supply) zone between 25.0 and 26.0. This area has historically capped price increases (notably in 2015 and recently in 2025), leading to sell-offs.
Support Levels: The price recently consolidated above the 18.0 - 20.0 range, which has transitioned from a resistance area to a "demand" or support zone.
Current Price Action: At 22.1, the stock is in a minor retracement. It is holding above its previous local lows, indicating that the multi-year uptrend remains intact despite short-term volatility.
Outlook
The stock remains bullish-neutral. For a sustained breakout, it needs to clear the 26.0 supply zone with high volume. Until then, it is likely to continue oscillating within the established upward channel.

hSenid Business Solutions PLC / HBS.N0000 / CSEStrategy
1. Portfolio alignment to the sectors that will benefit from the rapid economic recovery of Sri Lanka.
2. Benefit from the expected price recovery/breaking out from the 1-year consolidation range (bottoming out) after post IPO selloff.
Most of the selling came from the account: Mr. O.E.H. Kalvo which had 19,800,000 shares as at 31st Dec. 2021 and are expected to be over by now.
Fundamentals
* Continuous top line growth during last 4 quarters
* As Sri Lanka's economy is on a growth phase exceeding forecasts HBS will benefit from
increased IT budget allocations of other companies and new ventures.
* Business exposure to high growth areas of the world (South Asia, Southeast Asia, Middle East and East Africa)
* Most of the major shareholders opted the dividend in the script form (reinvesting the dividend in the company) instead cash which shows the strong confidence of the company's growth trajectory.
No of shareholders requested for 100% script dividend: 12%
No of shareholders requested for 50% cash & 50% script dividend: 45%
Q1 2024 earnings
Revenue up 30.5% YoY & 7.6% QoQ
New deal closures up 44% YoY
Dividend Yield
Last Dividend LKR 1.25 (Cash/Scrip or both 50/50)
DY : 10.4% (Market DY 4.4% / 1 Year FD rate 8%)
IPO
Opened: 3rd Dec 2021
IPO Price : LKR 12.50
CSE debut Price LKR 28.50
52 Week Price Range
High : LKR 14.00
Low : LKR 10.50
Technical Analysis (Chart Patterns)
* HBS had created a Descending Wedge pattern during the post IPO selloff and a Reverse Head & Shoulder pattern during the 1 yearlong price consolidation (Dividend adjusted chart).
* Both these patterns recorded breakouts during last week.
Potential Pattern Targets
* Multi week descending wedge target LKR 20.00
* Reverse head & shoulder target LKR 14.30

PACK.N BREAKOUT ON SUPPORTThe chart displays a clear downtrend from a high of approximately LKR 16.8 in late 2024, followed by a significant decline. A potential reversal or base-forming phase appears to have begun around the May 2025 low (around LKR 13.0).
Current Market Structure
The stock has been trading in a sideways consolidation range since July 2025, primarily between the Daily Support area (approx. LKR 14.6 to LKR 14.8) and a local high around LKR 16.0.
Bearish Signal: The most recent weekly candlestick (ending early November 2025) is a large bearish candle that has decisively broken below the Daily Support zone and a previously respected rising dashed trendline. The closing price of LKR 14.4 is below these key levels, indicating a shift in short-term momentum from neutral to bearish. This breakdown suggests that the sellers have regained control.
Projection
The decisive breakdown below the LKR 14.6 - LKR 14.8 support area points to a high probability of a further decline to the next major support zone.
Initial Target (Weekly Support): The immediate projection is a move down towards the Weekly Support zone, which is clearly defined between approximately LKR 13.4 and LKR 13.7. This zone was a previous level of strong support and resistance.
Continuation: If the price fails to hold the Weekly Support zone, the next potential downside target would be the April/May 2025 low around LKR 13.0.
In summary, the chart shows a breakdown from a consolidation pattern, leading to a bearish short-term projection targeting the Weekly Support between LKR 13.4 and LKR 13.7.

TKYO.N BEARISH PROJECTIONThe stock established a strong uptrend from June 2025, defined by the solid Trend Line which acted as dynamic support. This uptrend led the price to challenge and briefly break above the significant Resistance zone around LKR 91.5 - LKR 94.0 in October.
Current Technical Status
The key development is the recent breakdown of the ascending Trend Line, which the chart labels as a "Bearish Breakout."
Failed Breakout: The move above the LKR 91.5 - LKR 94.0 Resistance zone proved to be unsustainable, resulting in a false breakout (or bull trap). The price rapidly moved back into the previous trading range and then decisively fell through the major uptrend line.
Breakdown Confirmation: The current price of LKR 87.0 is now trading below the broken Trend Line, confirming the loss of short-term upward momentum and a shift in market control to the sellers.
Projection
The immediate technical bias is bearish, following the failed breakout at the top and the confirmed breakdown of the uptrend line.
The most likely projection is a continued decline towards the next major support level, which is the "Key Level" zone around LKR 78.5 - LKR 81.5. This zone previously acted as strong resistance through the first half of 2025 before the breakout in August and is now expected to provide significant support.
Should the LKR 78.5 - LKR 81.5 Key Level fail to hold, it would indicate a substantial reversal of the 2025 uptrend and suggest a deeper correction. However, the initial target for the current bearish movement is clearly the Key Level zone.
Would you like me to search for any recent construction sector news or company-specific updates that could be influencing the recent price action of Tokyo Cement? That's an excellent follow-up question. Analyzing the fundamentals alongside the technical breakdown provides a much clearer picture.
The recent news search reveals a contradiction between the overall positive fundamental outlook for the sector and the current bearish technical price action.
Fundamental Context (Bullish)
Construction Sector Rebounding: Recent Purchasing Managers' Index (PMI) data shows strong expansion in Sri Lanka's construction sector, with the September 2025 PMI (67.6) marking the strongest increase since late 2021 and new orders/project availability increasing significantly, particularly in road rehabilitation.
Company Performance: Tokyo Cement reported a solid Q2 FY25/26 (ending Sept 2025) with a turnover of LKR 16.322 billion, up from LKR 13.833 billion YoY. The construction sector is noted as having a "sustained boom," with September recording the highest cement sales volumes since the 2022 economic crisis.
Outlook: The outlook is positive, citing sustained growth momentum due to low interest rates, a stable currency, subdued inflation, and government investment in infrastructure and housing (like the Urban Regeneration Programme).
Technical vs. Fundamental Synthesis
The technical analysis shows a Bearish Breakdown (failed breakout at LKR 94.0, confirmed loss of the uptrend line), projecting a decline to the LKR 78.5 - LKR 81.5 Key Level.
The fundamental news, however, indicates a Strong Bullish Sector Recovery coinciding with the period the price was near its highs (June to October 2025). The short-term bearish technical move is therefore likely not a result of a fundamental collapse, but rather:
Profit-Taking/Distribution: Investors who bought earlier in the year are taking profits after the stock successfully ran up in anticipation of the improving sector results, leading to the failed breakout (bull trap) and sharp correction.
Margin Contraction: Tokyo Cement's Q2 Profit After Tax (PAT) of LKR 1,003 million was slightly lower than the previous year (LKR 1,082 million), despite higher revenue. The company noted that profit margins contracted due to the capitalization of its Trincomalee expansion projects. This might be the specific fundamental trigger for the selling pressure seen in late October/early November, as investors react to the slight drop in profitability amidst increasing volume.
Revised Projection (Integrated View)
The technical projection remains a decline to the LKR 78.5 - LKR 81.5 Key Level. However, given the robust fundamental backdrop (strong sector growth and record sales volumes), this drop is likely a buying opportunity rather than the start of a deep bear market.
The LKR 78.5 - LKR 81.5 zone is a high-probability reversal area where the technical support aligns with the strong long-term fundamental recovery story. A bounce is expected from this level as value investors and long-term traders look to enter based on the positive sector outlook.

ALUM.N PULLBACK ON TOPThe stock is in a clear long-term uptrend starting from mid-2022, defined by the major ascending trendline. Since early 2024, the price action has accelerated within a tighter ascending channel (dashed lines).
The key technical development is the recent interaction with the long-term Resistance zone established in early 2022, located between approximately LKR 17.0 and LKR 18.5. The stock successfully broke above this significant resistance zone in mid-2025 and is currently trading above it. This breakout from a multi-year consolidation pattern is a strong bullish signal.
Current Price Action and Support
The current price of LKR 20.2 is showing signs of a potential pullback after testing the upper boundary of the tighter ascending channel. The most recent weekly candle closed lower, indicating short-term selling pressure.
Immediate Support: The primary and most critical support level is the recently broken Resistance zone (LKR 17.0 - LKR 18.5), which is now expected to act as a strong support (a principle known as "role reversal").
Dynamic Support: The lower trendline of the tighter ascending channel also offers dynamic support just above this horizontal zone.
Projection
The overall technical structure is bullish, driven by the multi-year uptrend and the breakout above the major 2022 resistance.
The most likely projection is a bullish continuation. The current short-term weakness is likely a healthy retest of the broken resistance zone (LKR 17.0 - LKR 18.5). If the price holds above this level, it confirms the breakout, and the stock is projected to resume its uptrend, targeting new highs. The immediate long-term target, based on the height of the previous consolidation, could project towards the LKR 25.0 - LKR 26.0 area.
A significant weekly close below the former resistance zone of LKR 17.0 would invalidate the strong bullish structure and suggest a deeper correction toward the long-term major trendline (currently near LKR 15.0). However, the current momentum and structure favor the upside.

JKH.N RISING WEDGE The stock has been trading within a Rising Wedge pattern since late 2019/early 2020. This pattern is generally considered a bearish reversal pattern, suggesting that a decisive break below the lower trendline could lead to a significant downtrend.
The price has recently been testing the lower trendline of the Rising Wedge. The current weekly candle, as circled, is right at this critical support line, indicating an immediate inflection point. The stock closed the week at LKR 21.1, down 1.40%.
Key Levels and Support
The primary support in the near term is the lower trendline of the wedge.
Breakdown Scenario: A definitive weekly close below the lower trendline would confirm the breakdown of the Rising Wedge pattern. The next significant support would be the horizontal "Key Level" zone around LKR 17.0 - LKR 17.8. A break below this key zone would then target the subsequent long-term "Support" zone around LKR 13.0 - LKR 13.5.
Reversal/Continuation Scenario: If the lower trendline holds, the price could bounce back towards the upper trendline of the wedge, which is currently near the LKR 25.0 - LKR 26.0 area.
Projection
The technical structure strongly suggests a bearish projection given the nature of the Rising Wedge pattern and the price's current position right at the critical support.
The most likely projection is a breakdown below the lower trendline, leading to a move towards the LKR 17.0 - LKR 17.8 Key Level support zone. This breakdown would signal the end of the multi-year bullish consolidation represented by the wedge. Traders should look for confirmation via a decisive close below the trendline on the weekly timeframe. If the price manages to hold this line, the alternative projection would be a rally back toward the wedge's high LKR 25.0s, but the immediate technical bias favors the downside.

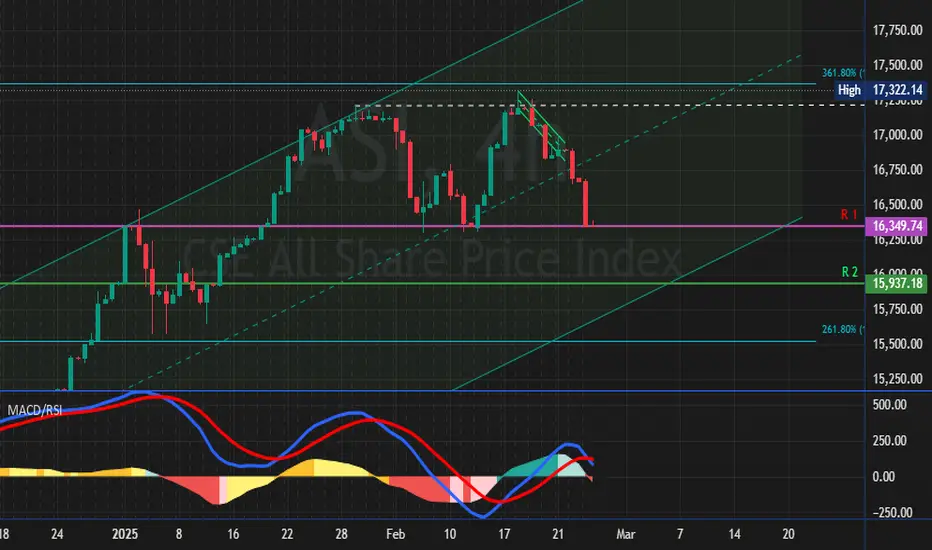
CSE All Share Price Index 📈 CSE All Share Price Index (ASPI) – Technical + Fundamental Outlook
🔹 Trend Overview
The index is moving inside a strong ascending channel.
Multiple successful retests of channel support show consistent buying interest.
As long as price stays inside the channel, the trend remains bullish.
🎯 Key Price Zones to Watch
Immediate Resistance: 22,800 – 23,000
→ Expect mild profit-taking here.
Breakout Zone: Above 23,000
→ If broken with volume, next targets could be 23,500 → 24,200.
Ideal Buy Zone (Pullback): Around 22,000
→ Mid-channel area — good for dip entries.
Trend Invalidation: Below 21,000
→ Only a break below this would signal real weakness.
📊 Market Behavior
Candles are getting stronger — buyers in control.
No major upper wicks — little selling pressure currently.
A short-term pullback is possible, but structure is still very healthy.
🧾 Fundamentals Support the Trend
Increasing foreign inflows.
Interest rates are stable to slightly easing — supports equities.
Corporate earnings for key sectors improving.
Currency risk (LKR) still something to monitor but currently manageable.
✅ Strategy Suggestions
Short-Term Traders: Take partial profit near 22,800-23,000 and reload on dips.
Medium-Term Investors: Hold as long as we stay above 21,000.
New Entries: Better to buy dips rather than chase highs.
🟢 Conclusion
“Still in a clean bullish structure. Every dip inside the channel is a buying opportunity — not a reversal signal.”

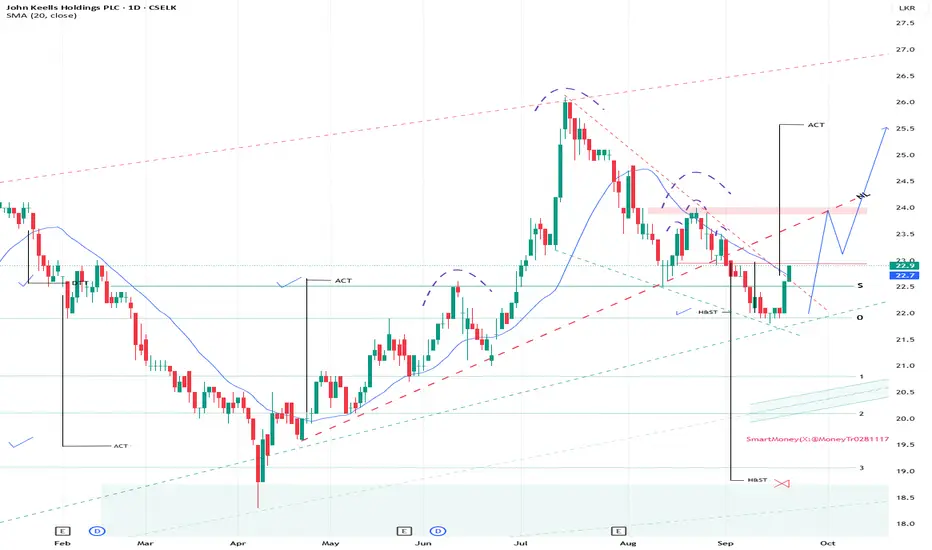
JOHN KEELLS HOLDINGS PLC : JKH.N0000 : CSEOverview
John Keells Holdings (JKH) is the largest publicly listed company on the Colombo Stock Exchange (CSE), known for its strong fundamentals, high liquidity, and blue-chip status.
Strategy
This trade is based on a technical breakout pattern, supported by the recent upgrade of Sri Lanka’s foreign currency (FC) credit rating from default to CCC+ with a stable outlook.
The ratings upgrade is a significant catalyst for the CSE, as it reopens the market to large foreign institutional funds previously restricted by sovereign risk thresholds. These funds typically favor liquid counters with high capitalization, making JKH a prime beneficiary.
Technical Analysis (Chart Patterns)
On 19th September 2025, JKH initiated a breakout from a descending wedge pattern.
• The upward momentum is expected to continue in the near term, bolstered by the positive sentiment from the ratings upgrade.
• The LKR 24.00 zone represents a key supply area and a potential resistance zone.
Potential Pattern Targets
Initial Pattern Target : LKR 25.60 (> 14% upside)
Extended Breakout (above LKR 24.00) : LKR 27.00 (> 17% upside)
Invalidation
A daily close below the support line marked as ‘0’ would invalidate this bullish setup.
East West Properties PLC | Bearish OutlookEast West Properties PLC
Bearish Outlook
Structure: Daily Resistance, Trend Line
A daily resistance has been identified where a reversal has occurred. For a further decline, a bearish breakout below the trendline is required. However, as long as EAST trades above the trendline, the overall market trend remains bullish.

First Capital Treasuries PLC | Bullish OutlookFirst Capital Treasuries PLC
Bullish Outlook
Structure: Breakout and Retracement on the recent bullish rally
FCT has shown strong bullish momentum, but with the recent buying pressure, we’ve identified a sharp rejection followed by selling. This suggests a potential retracement in the recent rally before any continuation to the upside. Additionally, a gap has appeared near the highlighted key support level, which could play a crucial role in the next move.

Commercial Bank PLC | Bearish OutlookCommercial Bank PLC
Bearish Outlook
Structure: Bullish Channel and Reversal on Upper Boundary
As expected the price has started to respect and reverse on top by respecting the upper boundary of the bullish channel formed. We expect a retest back on the trend line/ lower boundary formed.

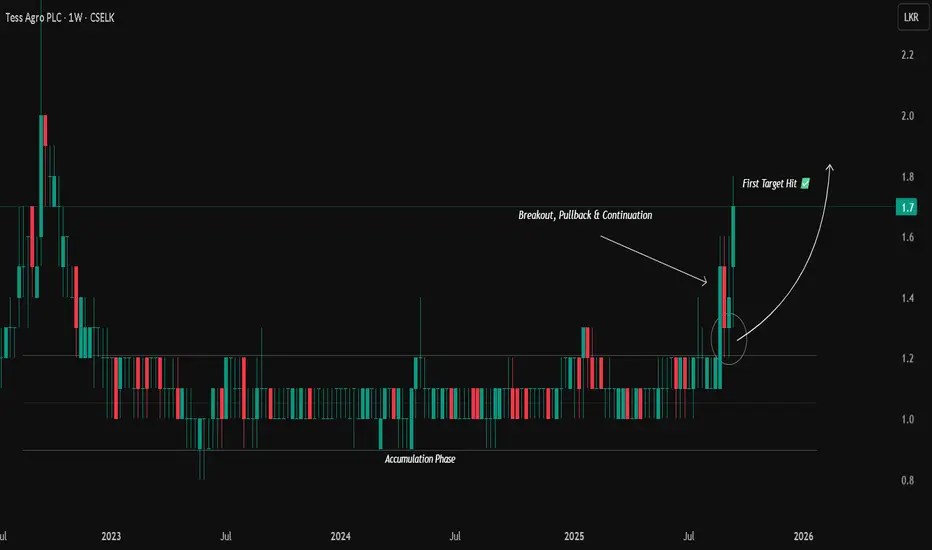
TESS Agro PLC | First Target AchievedTESS Agro PLC
Bullish Outlook
Structure: Accumulation Breakout and Continuation
Price rally has hit our first target level at Rs1.7 successfully with the recent bullish sentiment built on the market. And now we hold our positions towards the next target above Rs 2.0
LVL Energy Fund PLC | Requires ConfirmationLVL Energy Fund PLC
Neutral Outlook
Structure: Breakout on resistance with strong weekly rejection.

Sampath Bank PLC | Bearish OutlookSampath Bank PLC
Bearish Outlook
Structure: Bearish sentiment building on top followed by bullish channel and trendline

CSE ASI BEARISH SETUPThe monthly chart of the CSE All Share Price Index (ASI) reveals a technically significant scenario: the index is currently testing the upper boundary of a long-term ascending channel while also aligning with the 1.618 Fibonacci extension, both of which signal potential reversal pressure ahead.
Key Observations:
Long-Term Resistance: The price is testing the channel’s upper resistance line near the 17,000 – 17,700 zone, where rejection often occurs historically.
Fibonacci Confluence: The current high coincides with the 1.618 Fibonacci extension, a critical level where long rallies often stall or reverse.
Bearish Candlestick Pattern: The formation of a potential bearish reversal candle near the resistance zone is an early signal of seller interest.
Expected Retracement Levels:
Initial support lies at the 0.382 and 0.5 Fibonacci retracement zones, around 15,000 – 14,000.
Deeper correction could target the 0.618 level (~13,000), which aligns with previous breakout structure and the channel midline.
Conclusion:
The ASI appears overextended after a strong bullish leg and is currently showing signs of exhaustion at the top of a multi-year channel. Unless price breaks above and sustains above 17,700, a correction toward the 13,000–14,000 zone is likely, supported by Fibonacci retracement levels and the channel structure.
This presents a potential medium-term bearish outlook for investors and swing traders, with caution advised around current highs.

ASPI CSEDisclaimer;
The information provided on this website does not constitute investment advice, financial advice, trading advice, or any other advice, and you should not treat any of the website’s content as such. We do not recommend buying, selling, or holding any stock. Nothing on this website should be taken as an offer to buy, sell or hold a stock. Conduct your due diligence and consult your financial advisor before making investment decisions.
I do not accept any responsibility and will not be liable for the investment decisions you make based on the information provided on the website.
Anuradha Godellawatte

ASIDisclaimer
The information provided on this website does not constitute investment advice, financial advice, trading advice, or any other advice, and you should not treat any of the website’s content as such. We do not recommend buying, selling, or holding any stock. Nothing on this website should be taken as an offer to buy, sell or hold a stock. Conduct your due diligence and consult your financial advisor before making investment decisions.
I do not accept any responsibility and will not be liable for the investment decisions you make based on the information provided on the website.

ASPI CSEDisclaimer;
The information provided on this website does not constitute investment advice, financial advice, trading advice, or any other advice, and you should not treat any of the website’s content as such. We do not recommend buying, selling, or holding any stock. Nothing on this website should be taken as an offer to buy, sell or hold a stock. Conduct your due diligence and consult your financial advisor before making investment decisions.
I do not accept any responsibility and will not be liable for the investment decisions you make based on the information provided on the website.
JKH.NDisclaimer;
The information provided on this website does not constitute investment advice, financial advice, trading advice, or any other advice, and you should not treat any of the website’s content as such. We do not recommend buying, selling, or holding any stock. Nothing on this website should be taken as an offer to buy, sell or hold a stock. Conduct your due diligence and consult your financial advisor before making investment decisions.
I do not accept any responsibility and will not be liable for the investment decisions you make based on the information provided on the website.

SMOT BEARISH SETUPWe have witnessed a major resistance zone under the monthly timeframe with multiple price rejections formed close to this area. We are expecting a retracement next, if the price remains unbreakable above the highlighted zone.

CHL BULLISH SETUPBreakout on the weekly trend hints us a potential rally laddering up towards the 138-148 region
