Bandhan Bank - first major trend reversal! Upside to ₹215–230Thesis:
Bandhan Bank has broken out above the ₹185 zone after constructing a multi-month rounded base between ₹130 and ₹185. This marks the first major structural reversal after a multi-year downtrend. The breakout is backed by above-average volume and positive momentum.
Technical Structure:
Breakout Level: ₹180
Current Price: ₹189.64
Volume Surge: 11.4M (above 20-day average)
RSI (14): 67.5 — trending strong, near breakout zone
Targets:
₹215 ( 13.8% upside ) — measured move of near-term range
₹259 ( 25% upside ) — major horizontal resistance from 2022
Disclaimer:
Not a recommendation. For educational use only. Position already held from earlier. This post reflects personal strategy execution in a structured portfolio.
CUP

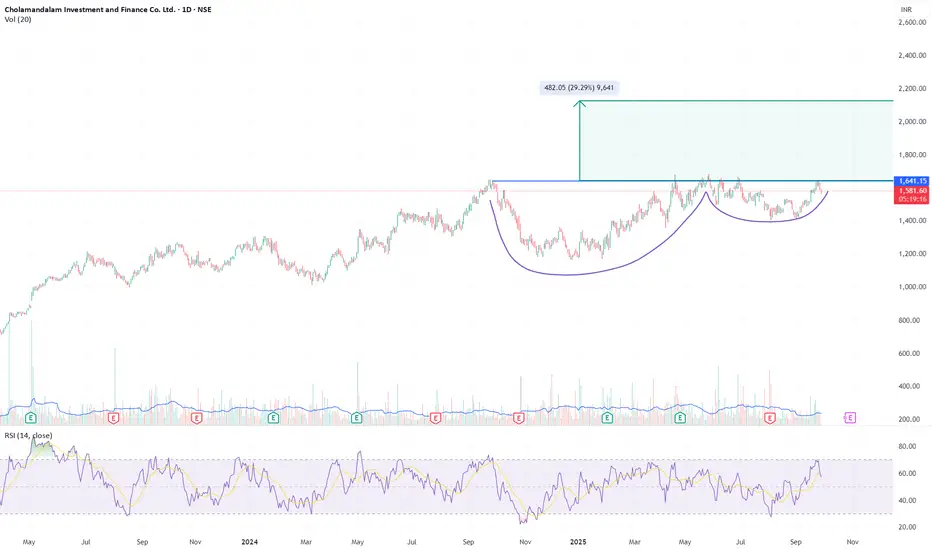
CHOLAFIN – Cup & Handle Reformation | Setup in ProgressCHOLAFIN is re-forming a higher timeframe Cup & Handle pattern after a failed breakout attempt in July. The broader base now spans from late 2024, showing improved symmetry and structural maturity. This is a classic example of a breakout setup resetting through time.
Pattern Details
Pattern: Cup & Handle (reformed)
Neckline / Breakout Level: ₹1641.15
Current Price: ₹1581.10
Target (if breakout holds): ₹1641 + ₹482 = ₹2123
Upside Potential: ~29%
Volume: Needs breakout-day confirmation (>2x 20-day avg)
RSI: 57.2 – healthy, approaching 60
Setup Bias
Not a buy yet — structure is constructive but needs confirmation
Watch for daily/weekly close above ₹1645 with volume support
Prior failure adds caution, but also strengthens credibility on second attempt
Disclaimer
This post is for educational and informational purposes only . It is not a recommendation to buy, sell, or hold any securities. Technical chart patterns involve inherent risk and are not guarantees of future performance. Traders must use their own discretion, manage risk appropriately, and consult with a SEBI-registered financial advisor if needed.
RTY / IWM Weekly: Cup & Handle Projection to $3280A classic Cup and Handle formation has developed on the weekly chart of the [b ]Russell 2000 (RTY) ; this structure is also visible on the IWM ETF.
My target is based on the depth of the Cup, which projects a measured move to $3280 . This represents a potential 24% upside from current prices.
Not Financial Advice. For educational purposes only.

Cup & handle, bull flag - look for a breakoutCommodities are bullish right now if you didn't know.
Silver, Gold, Natural Gas, Palladium and more. They are all interesting right now. Commodities is the sector you should be looking at right now.
We had tech, weedstocks, cryptos, ai
now look for commodities for near term plays.
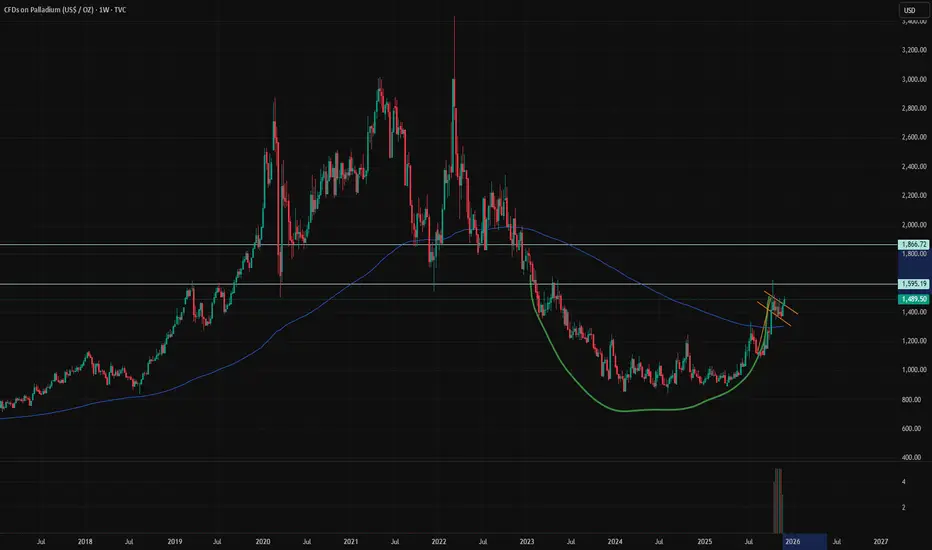
Speaking of Palladium, I love this chart. Beautiful.
We have a nice formation of a 2 year cup with a resistance at 1600$
Short term, we have near break out of bull flag at 1500$
The blue zone extending to may should be a zone where you have to keep close attention to this chart.
I'm expecting a breakout with target of 1870 ish on palladium. I'm early on this one, there is no breakout at the moment. I just follow the good sector and bet on the nice chart.
Lemonade Inc.: Breakout in Motion — Cup, Flag, and No BrakesLemonade Inc. (LMND) is accelerating after a clean breakout from a textbook cup with handle pattern, where the handle formed as a tight bullish flag. The breakout occurred around $32, and since then, price action has been sharp, controlled, and uncorrected — currently trading at $42.42 with buyers clearly in charge.
On the fundamental side, LMND is moving through a recovery phase: operational losses are narrowing, revenue is stabilizing, and the company is aggressively leveraging AI to automate its insurance processes. Expansion into Europe continues, and institutional interest is visibly rising — confirmed by volume building alongside price. Within the insuretech sector, LMND is starting to look like a comeback story rather than a cautionary tale.
Technically, the setup remains strong:
– Golden Cross confirmed (EMA50 crossing EMA200)
– EMA50/100/200 all below price — bullish structure firmly intact
– Volume expanding on up-days — healthy confirmation
– RSI hovering in the 60–65 range — momentum is intact, no signs of exhaustion
Targets remain aligned with the structure:
– tp1 = $64 — measured move from the flag
– tp2 = $94 — full realization of the cup pattern
Tactically, this is no longer a “wait and see” setup — the move is in progress. No correction so far, only continuation. Momentum traders may consider entries into strength. Above $45, the move could accelerate further as more participants recognize the structure.
LMND is showing technical and fundamental alignment — confirmed breakout, improving narrative, and strong trend structure. While the impulse holds, this chart favors continuation, not hesitation.

TMPV Breakout Loading | 17% Swing & 53% Intrinsic PotentialBias: 🔵 Bullish – breakout accumulation phase ( opportunity for anticipation )
Volatility Trigger: Nov 14th Results Day
Potential: 17% swing | 53% intrinsic upside
After months of sideways action, Tata Motors Passenger Vehicles Ltd (TATAMPV) is finally showing signs of strength.
The stock has formed a rounding bottom + triangle consolidation — a classic Cup & Handle structure — with the worst likely behind as we head into results on Nov 14th.
Q2 results on Nov 14 are expected to bring volatility, but the setup indicates accumulation and base formation are complete.
Margins may stabilise, and the PV segment strength could trigger a breakout before or immediately after results.
This structure suggests volatility = opportunity.
A strong close above ₹440 can open the gates for the next leg toward ₹490 and later ₹640+ as the full pattern plays out.

This $PENGU Can Fly
Summary
COINBASE:PENGUUSD has traced a broad 2025 “cup” base, with April setting the low and price now back to the January supply shelf. Price forming a bullish wedge just below all-time highs. As we retest what I call the "blue sky" box, we attempt to resolve a contracting wedge to the upside, printing a fresh daily higher high (HH). While price accepts above local resistance, the path of least resistance is higher with an initial magnet toward the ATH "blue sky" box.
Market Structure and Setup
The higher-timeframe structure is the completed cup + reclaim of the former supply shelf ("blue sky" box). On the daily, the sequence is: retest of the shelf as support → wedge compression → upside break → HH. This multi-timeframe alignment (HTF reclaim + D1 momentum) provides defined risk against the shelf and clear upside reference points (ATH → extensions).
Fibonacci-Based Upside Roadmap
Anchor the swing from the April handle low to the August/September impulse high. The roadmap is:
First waypoint: prior ATH band / 1.00 extension (supply; expect reactions).
Continuations: 1.272 and 1.618 extensions of the April → August leg as conditional targets if ATH is accepted and weekly momentum persists.
These are waypoints, not promises—active only while price holds above the reclaimed shelf.
Microstructure: Acceptance > Expansion
The break produced a HH, but the higher-quality entry often comes from acceptance: a shallow pullback that holds the top of the blue box and forms a D1/4H higher low (HL). That HL becomes the pivot to trail against. If momentum continues without a pullback, treat local range highs as a go-with trigger and manage tightly.
Execution Plan
Setup A – Retest Buy (preferred): Accumulate on a controlled retest into the blue breakout box, then look for a 4H reclaim and higher low to confirm buyers. Invalidation is a daily close back below the shelf or loss of the HL. Distribute into the ATH band first; let a runner work toward 1.272/1.618 if acceptance above ATH materializes.
Setup B – Continuation Buy: If there’s no retest, enter on a clean break-and-hold above the recent HH as a momentum trigger. Invalidation sits under the breakout pivot (last 4H swing). Use smaller size and trail faster given the paid-up entry.
Setup C – Failed-Break Short (contingency/hedge): Engage only if price loses the shelf on a daily close and then rejects on a reclaim attempt from below. Invalidation is re-acceptance back above the shelf. Targets are the cup’s midpoint and the 50–61.8% retrace of the April → August impulse.
Invalidation Criteria
Near-term: a daily close back below the blue shelf = reclaim failed; stand down and wait for fresh structure.
Structural: a weekly close back inside the mid-cup range would negate the completed base and argue for more time/width.
Risk & Sizing
Risk ≤1% per idea; position size = account_risk ÷ (entry→stop). Cut risk further if liquidity is thin or wicks are frequent.
Use reduce-only stops and avoid clustering at obvious lows/highs.
Take 30–50% into ATH supply; trail the remainder beneath 4H HLs or a fast EMA pair (e.g., 8/21) to self-finance the trade.
Fundamental/Flow Linkages
As a high-beta crypto/NFT-adjacent asset, PENGU’s tape is sensitive to broad crypto liquidity, meme-beta flows, and listing/funding dynamics. A trending BTC/ETH backdrop and favorable risk sentiment are supportive; adverse headlines, liquidity air-pockets, or exchange changes can truncate moves abruptly.
Key Risks
Crypto beta: a risk-off impulse in majors typically unwinds alt momentum irrespective of local structure.
Liquidity/venue risk: thinner books can produce stop-hunts and gap moves; listing or market-maker changes can impact spreads.
Narrative fatigue: meme/NFT-linked tokens can overshoot then mean-revert sharply as attention rotates.
Technical failure: acceptance back below the shelf converts today’s support back into resistance and invites a deeper cup-middle retrace.
Conclusion
While PENGU consolidates around ATHs, I want to be long on retests that form higher lows or on clean continuation through range highs. First distribute into the ATH band; if acceptance builds above it, press runners toward the 1.272 → 1.618 roadmap. Lose the shelf on a daily close, and the trade is off until structure rebuilds.
Not financial advice. Levels and sizing should be adapted to your process and constraints.

PLTR 1D — When the tea is brewed and the handle’s in placePalantir’s daily chart is shaping up a textbook cup with handle pattern — one of the most reliable continuation setups in technical analysis. The cup base was formed over several months and transitioned into a consolidation phase, building a rectangle structure where smart money likely accumulated positions before a breakout.
Now here’s the key: price has not only broken out — it’s settled above all major moving averages, including EMA 20/50/100/200 and MA 50/200. The breakout candle was supported by surging volume, signaling strong participation from institutional buyers. When all the averages start bending upwards, it's usually not by accident.
The breakout above the $121 resistance zone unlocked a pathway toward a target at $187 , derived by projecting the height of the cup upward from the breakout level. This kind of structure, once confirmed, often fuels aggressive continuation — and this one’s got the setup locked in.
From a fundamental perspective, Palantir is holding solid ground: strong earnings reports, expanding government and commercial contracts, and aggressive development in AI services. Institutional interest is rising steadily, and that momentum is visibly reflected in price action.
To sum it up: price has launched cleanly out of the consolidation zone, pierced all critical MAs and EMAs, and continues to gain momentum. While the market sips its tea, this cup is boiling hot. Just don’t forget your stop loss — this is a trading desk, not a tea party.
If you enjoy posts like this, drop a like, share it around, and let’s hear your thoughts below. It keeps ideas moving and the content flowing — free, sharp, and relevant.

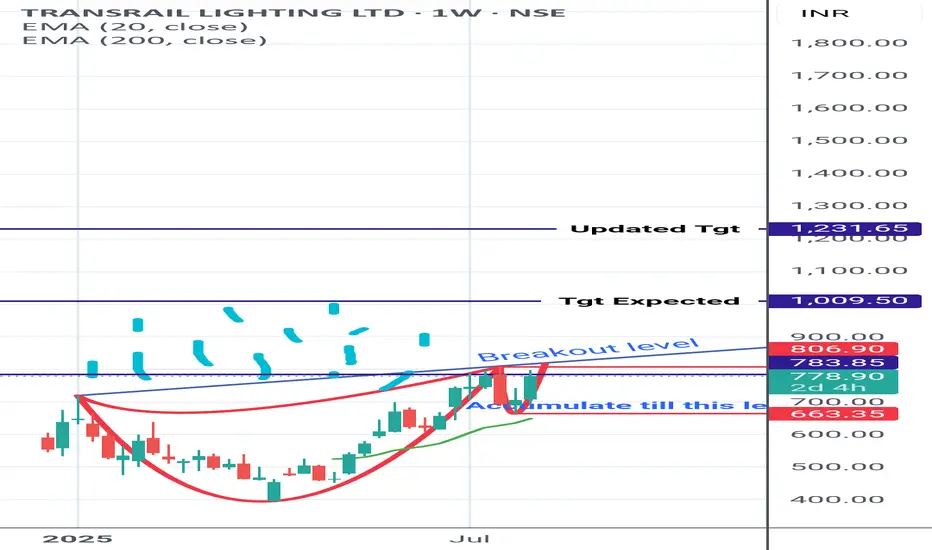
Transrail Lighting Updated Updated Chart for members Reference.
(Refer to the previous cup and handle pattern breakout pattern attached with this)
VRT : Long Position Vertiv Holdings is trading above the 50 and 200-period moving averages.
It has overcome the resistances one by one without being exposed to a very high IV.
It has started to draw a cup.
However, it is much better to focus on the big gap rather than the cup formation because with good chances it can encounter a big resistance there.
Targeting the 50-period ema and the 0.5 level of the short-term Fibonacci retracement levels as a stop point gives us the opportunity to try trading at a not bad risk/reward ratio.
With a small position size or small portfolio percent :
Risk/Reward Ratio : 2.54
Stop-Loss : 103.77
Take-Profit : 145.32

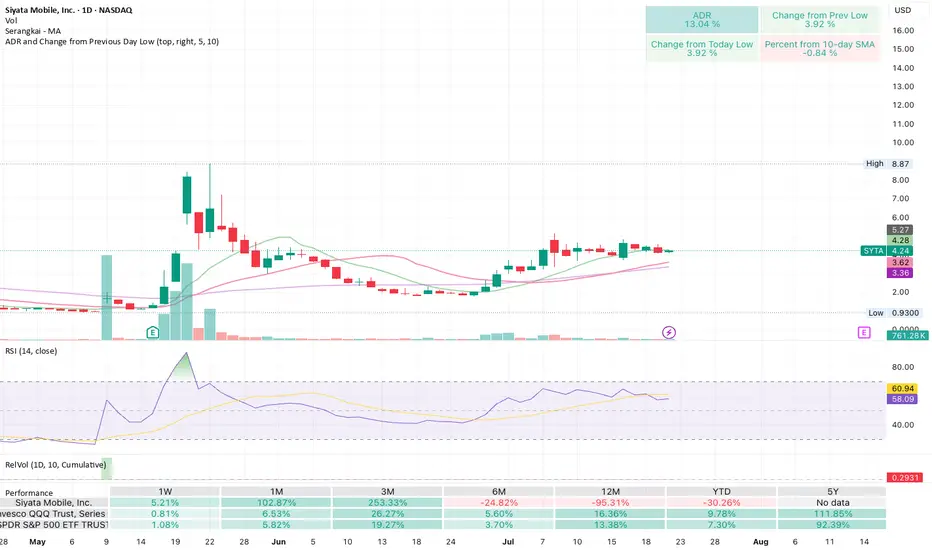
Getting ready to blow! Cup and handle after positive surprisesSiyata makes 2-way telecoms for things like first responders, miltary, construction crews.
Had big earnings and revenue surprises a few weeks ago, and now looks to be forming a cup and handle. Low volume yesterday shows a squeeze pattern like it's getting ready to go.
Cup and Handle Formation in Angelone ChartDisclaimer : Do your own research before investing. This is just a chart analysis for education purpose only. No recommendation to buy and sell.
In Dec 2024, AngelOne made high of Rs.3500 and pull back to level of Rs.1941 in March 2025.
After touching level of Rs. 3288 , its now trading at Rs. 2805.
I can see a cup and handle chart pattern formation in this stock. to me , it will be bullish in near to long term.
I have mentioned my targets along with stop loss.

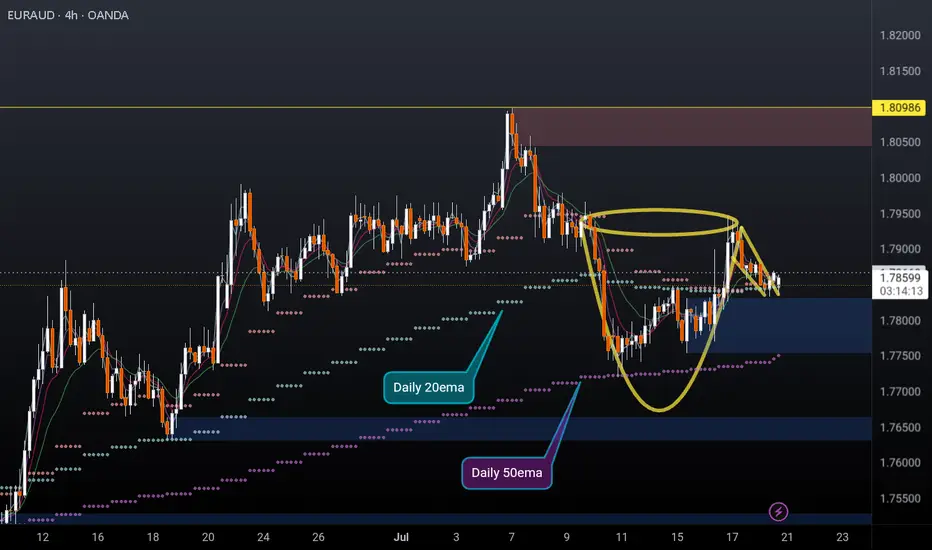
EURAUD 4H cup and handleEURAUD 4H cup and handle formed and possibly breaking out to the upside. Price recently found support off the daily 50ema (overlayed on this 4h chart) and is holding above the daily 10 & 20EMAs (overlayed).
I'm a cat not a financial advisor.
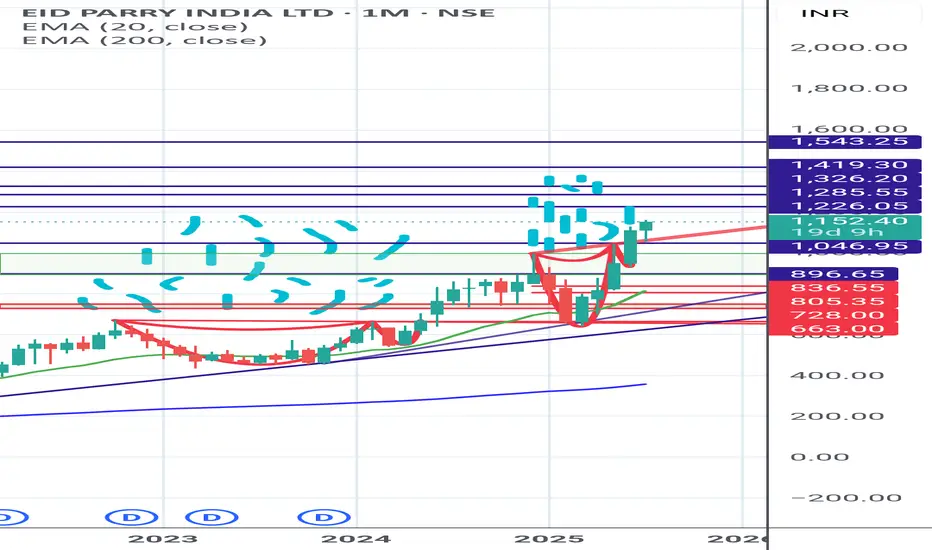
EID PARRY - TASTE THE 2ND CUP OF COFFEE Second Cup and handle pattern is ready. Taste the sweetness of it.
Arkham (ARKM) Structure Analysis (1D)Interesting chart for BINANCE:ARKMUSDT
Apologies for the trendlines mess, but they're all potentially relevant.
Watch for
• Bounce at ~$0.49 (0.786 Fib)
• Break above the yellow and orange resistance trendlines (~$0.57)
These conditions could form a Cup & Handle pattern and lead to a retest of the $0.80-$0.85 supply zone.
If that it broken, it could set the next target to ~$1.25.

ApeCoin (APE) Cup Pattern (1D)After a deviation below demand, BINANCE:APEUSDT formed a clean rounded bottom, reclaimed the zone, briefly consolidated, and it's now attempting to break above resistance.
Key Levels
• $0.79: Current resistance
• ~$0.65: Current support, breaking it might lead to the formation of a handle
• $0.50-$0.60: Main demand zone and logical pullback target in case of a handle
• $1.20: Measured breakout target, and previous swing high
Worth watching it closely for a daily close above $0.79 with good volume to activate the target.
Alternatively, look at the $0.50-$0.60 area for a reversal in case of a rejection here.

ANGEL ONE - Potential Cup Pattern Breakout!Timeframe: Daily (1D)
Pattern: Cup Formation (shown with arc)
Setup:
Price is forming a classic cup pattern.
The neckline (arc resistance) is near 2538.40.
Price has recently approached but faced resistance around the neckline.
Once the price breaks above the arc line with strong volume, a bullish breakout could be confirmed!
Targets After Breakout:
🎯 Target 1: 2800
🎯 Target 2: 3000
Stop-loss suggestion: As per your risk management.
Notes:
Price is currently below the 200 EMA. For a strong confirmation, look for a close above the arc and the 200 EMA with volume spike.
Disclaimer
This analysis is for educational and informational purposes only. It does not constitute financial advice or a recommendation to buy or sell any securities. Always do your own research and consult with a qualified financial advisor before making any investment decisions. Trading involves substantial risk.

Curve (CRV) Structure Analysis (1D)BINANCE:CRVUSDT formed a rounded bottom (cup) and a minor rectangle, and it's currently attempting to break above the local $0.83 resistance.
Key Levels to Watch
• $0.64: Current support and minor rectangle lower boundary
• $0.83: Current resistance, cup and rectangle upper boundary
• $1.00: Measured target from the minor rectangle pattern
• $1.30: Measured target from the cup pattern (within a key supply zone)
Other Important Levels
• $0.20: Key demand zone, and 2024 low
• $0.40-$0.50: Key S/R dating back to November 2022, aligned with the cup bottom
• $1.20-$1.30: Main supply zone, dating back to February 2023
A daily close above $0.83 with volume would confirm the breakout and trigger the targets.

Solana (SOL) Cup & Handle (1W Log)BINANCE:SOLUSDT has formed a Cup & Handle pattern on the weekly chart, and arguably already broke out of the handle.
The measured move target based on the linear depth of the cup is ~$510.
Key Levels to Watch
• ~$100: Local low and 0.618 Fib of the cup depth, a typical handle retracement in a Cup & Handle pattern.
• $260: Cup & Handle neckline and key horizontal resistance. A decisive weekly close with strong volume above this level would confirm the pattern and activate the measured move target.
• $510: Measured move target based on the depth of the cup from the neckline.
Considerations
Volume confirmation remains key. A breakout above $260 with strong volume could validate the pattern and open the path to $510.

MASA Massive C&H possibleMASA has a reversal bottom in the form of the C&H.
3 neckline levels are possible.
Be aware of the RSI and volume in de breakout.
Possible target 100% up.
Use a SL to make sure you don't get liquidated when BTC suddenly retraces.

AGL - Bowl chart with a Golden cross- AGL is in a long-term uptrend.
- AGL made a golden cross on 04.08.2025 (MA50 & MA200).
- The price chart is forming a bowl of patterns.
- Price now (05.01.2025): $3.93.
- Price target: $7.62.
If the bowl pattern fails, cut loss when the intraday price is below $3.66.
IMO, amateur trader.

Silver-led profit-taking weighing on goldGold reached a fresh record high above USD 3,050 an ounce before some end-of-week profit-taking, led by silver and platinum, helped trigger another, so far shallow, correction. The recent rally has pushed the price of a standard 400-ounce (12.4 kg) gold bar—held by central banks globally—above USD 1,200,000, a tenfold increase since the start of the 21st century. Beyond reinforcing gold’s status as a long-term buy-and-hold asset, this surge reflects growing global instability, which has fueled strong demand for safe havens like gold and, to some extent, also silver.
Since the November 2022 low, gold has rallied by around 80%—a phenomenal performance by an asset often criticized by Warren Buffett, famously calling it an unproductive asset, with his argument being that gold does not generate income, unlike stocks, bonds, or real estate, which can produce dividends, interest, or rental income.
While managed money accounts have been net sellers during the past seven weeks, reducing their net long by 5.2 million ounces to 18.2 million, potentially signalling a short-term peak, asset managers and other more long-term-focused investors have increased total holdings across exchange-traded funds by 2.9 million ounces to 86.2 million—still a far cry from the pre-US rate hike peak at 106.8 million ounces—highlighting plenty of room for additional demand should the underlying trends continue to support. Read more in our latest gold update here.
Technical analysis suggests that gold’s short-term peak is around USD 3,100, potentially followed by a period of consolidation before a renewed attempt toward our year-end target of USD 3,300 per ounce. After three failed attempts, last year’s breakout above USD 2,074 confirmed the completion of a cup and handle formation, developed over a 13-year period (2011–2024). Using the distance from the cup’s bottom (large box) to the handle’s top (small box), the technical target is USD 3,100.

XCN beautiful 2000% gainWith XCN popping off and everyone now wanting a piece of the action. XCN is not finished. I entered XCn on the 3 vertical orange lines. Every entry and exit was more beautiful than the last first 125% then 230% or so then 2000%. We are now at $0.012 roughly and holding above the 200EMA
Forming a clear cup and handle, (if your new to the game check out DIMO, the cup and handle formed right before multiple major take offs)
Bitcoin is showing support, and we all know what happens when that happens. Now is a better entry than ever, we could se a bit lower but I doubt past $0.01
However looking at June 15th 2022 we see a major push down followed by an immediate rejection, this is still possible but overall I believe this will hit its ATH and more being $0.10, $0.18, $0.35, $0.50 potential
Not financial advice but if your kicking yourself for missing a very very easy 2000%
It’s not over.
Good luck and have fun with it
Not Financial Advice
