CVX long-term TAChevron is in bullish mode and it's getting more and more bullish on volumes with positive accumulation. There has been a very long consolidation on monthly frame for about 3 years now and it's getting ready to break out through the final resistance in the near future.
CVX

#CVX/USDT : Long-Term Breakout Signals Massive Upside Potentia
#CVX
The price is moving within a descending channel on the hourly timeframe. It has reached the lower boundary and is heading towards a breakout, with a retest of the upper boundary expected.
The Relative Strength Index (RSI) is showing a downward trend, approaching the lower boundary, and an upward bounce is anticipated.
There is a key support zone in green at 1.95. The price has bounced from this level several times and is expected to bounce again.
The indicator is showing a trend towards consolidation above the 100-period moving average, which we are approaching, supporting the upward move.
Entry Price: 1.98
First Target: 2.02
Second Target: 2.06
Third Target: 2.12
Stop Loss: Below the green support zone.
Don't forget one simple thing: Money Management.
For inquiries, please leave a comment.
Thank you.

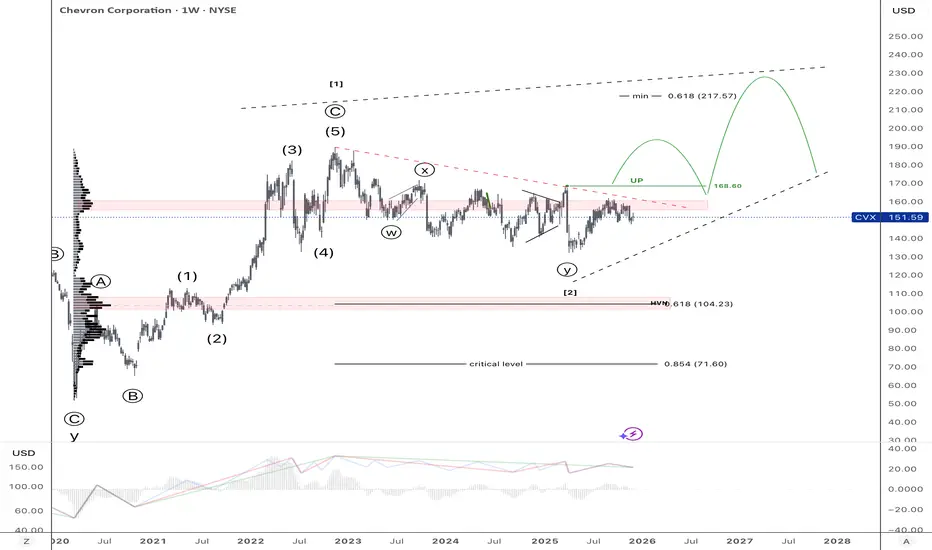
CHEVRON 53-year Channel Up for longterm investors can dazzle youChevron (CVX) has been trading within a 53-year Channel Up since January 1973. This is the epitome of long-term investing as the pattern has given excellent correction periods (Bear Cycles) to buy for the long-term and Higher Highs to sell and take profit.
During the first years, its Bull Cycles that ended in Higher Highs have been very aggressive, with all three reaching (and even exceeding) the 2.0 Fibonacci extension. In more recent years after the 2008 U.S. Housing Crisis, the two out of three major Bull Cycles (Bullish Legs for the Channel Up) merely reached the 1.382 Fib. All of the Bearish Legs, however, declined by around the same rate (-46.89%, -48.62% and -50.78%). The last two even hit the 1M MA200 (orange trend-line).
As a result, if we assume we will have the minimum of a Bear Cycle Chevron has seen inside this pattern which was the Dotcom's -41.55%, we can expect the current correction to marginally break below the 1M MA200 again to $112.00. However a Target on the 1M MA200 around $120.00 would perhaps be more fair.
The most efficient Buy Signal through this 53-year pattern, ha been when the 1M RSI hit 38.00. As you can see this has happened 7 times, providing the best level to enter for a long-term investor. Consequently, if the 1M RSI hits 38.00 before the stock hits $120.00, it is a good idea for long-term buyers to enter regardless.
The Target then is again the 1.382 Fibonacci extension at around $235.00.
---
** Please LIKE 👍, FOLLOW ✅, SHARE 🙌 and COMMENT ✍ if you enjoy this idea! Also share your ideas and charts in the comments section below! This is best way to keep it relevant, support us, keep the content here free and allow the idea to reach as many people as possible. **
---
💸💸💸💸💸💸
👇 👇 👇 👇 👇 👇

Chevron (CVX) – Long Setup with Venezuela CatalystChevron NYSE:CVX is the only major U.S. oil company still operating in Venezuela, giving it a strategic advantage if there’s any stabilization or regime shift in the country’s oil sector.
Additionally, Chevron is owed billions by Venezuela’s state oil company (PDVSA) — representing potential upside if debt negotiations or repayments are revived.
This geopolitical angle adds a fundamental catalyst to an already strong technical setup.
📈 Technical Setup
Bullish structure intact above the 200-week EMA
Strong demand zone: $140–$150
Key resistance at $170 – a break and hold above this level could trigger a squeeze toward all-time highs
📊 Trade Plan
Entry Zone: $140 – $150
Take Profit Targets:
TP1: $190 – $200
TP2: $250 – $260
Stop Loss: Weekly close below $130

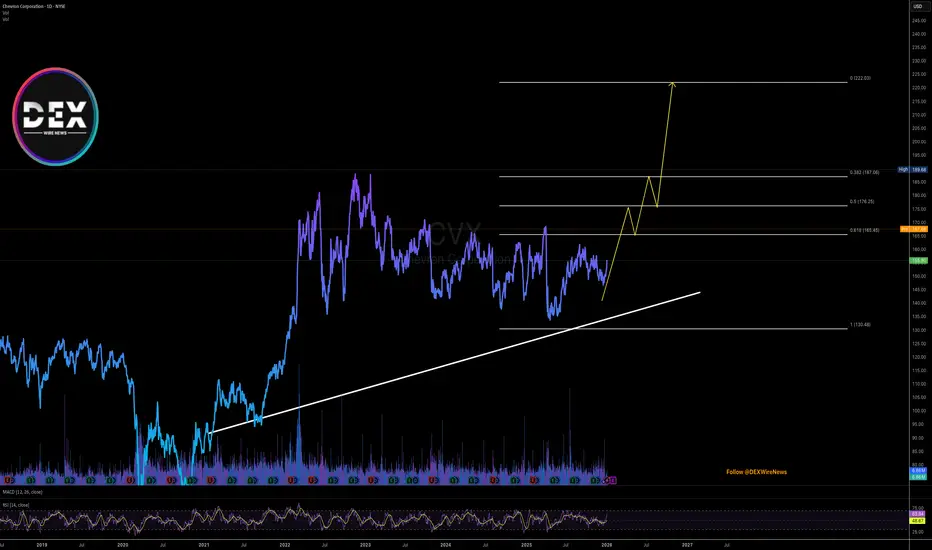
Chevron - Moving HigherWe’re evaluating the move from a purely technical perspective.
What do we see?
Three waves have already been completed, and not long ago the 4th corrective wave was finished.
After that, a larger fifth wave to the upside began.
This move did not start now - it began back in April 2025.
There is still a chance of a deeper pullback toward the 125 area, but the probability is relatively low.
In any case, such a correction would not affect the global targets.
Local targets:
180 -> 209 -> 238 -> 256
Global targets:
237 -> 269
---
Please subscribe and leave a comment.
You’ll get new information faster than anyone else.
---

Breaking: Chevron Corporation (CVX) Spikes 7% On Major Update The shares of Chevron Corporation (CVX) saw a noteworthy uptick of 11% in extended market trading on Fridays session. The stock extended gains to Mionday's premarket session surging 7% as it sets to break the 50% Fib level- eyeing the $200 resistant zone.
In recent news, U.S. oil companies' shares rose in premarket trading on Monday as investors bet that President Donald Trump's move against Venezuela's leadership would allow American firms greater access to the world's largest oil reserves.
Shares of Chevron (CVX.N), the only U.S. major currently operating in Venezuela's oil fields, climbed 7.3%.
The gains came after Trump said the U.S. needed "total access" to Venezuela's vast oil reserves following the arrest of President Nicolas Maduro, sharpening expectations that Washington could ease restrictions on Venezuelan crude exports.
Analyst Summary
According to 16 analysts, the average rating for CVX stock is "Buy." The 12-month stock price target is $171.94, which is an increase of 10.29% from the latest price.
About CVX
Chevron Corporation, through its subsidiaries, engages in the integrated energy and chemicals operations in the United States and internationally. The company operates in two segments, Upstream and Downstream. The Upstream segment engages in the exploration, development, production, and transportation of crude oil and natural gas; liquefaction, transportation, and regasification of liquefied natural gas; transporting crude oil through pipelines; processing, transporting, storage, and marketing of natural gas.
CVX: The Perfect Storm (Macro Catalyst + Massive Channel)The news cycle is obsessed with the politics of the US & Venezuela, but the smart money is focused on the supply chain.
I created this chart to visualize how a massive fundamental catalyst (The Flags) is colliding with a decade-long technical structure (The Channel).
1. The Fundamental Catalyst (The Flags 🇺🇸🇻🇪) While the headlines are about "deals," the reality for the energy sector is about Market Access. Chevron ( NYSE:CVX ) is the primary US major with the "keys to the kingdom"—active OFAC licenses and operational Joint Ventures on the ground.
The Moat: While competitors are years away from navigating new contracts, CVX has a "Turnkey" advantage. The infrastructure is there. The pipes are connected.
The Shift: This opens the door to immediate heavy crude reserves for US Gulf Coast refineries, a massive tailwind for margins.
2. The Technical Structure (The Blue Channel)
📉 Politics is noise; Price is truth. Look at the geometry in the chart:
The Channel: Price has respected this massive Blue Ascending Channel for years. It defines the institutional trend.
The Coil: We have been compressing in a tight Triangle Consolidation (white lines) right at the breakout point.
The Target (TP Circle) : If we break out of this triangle, the standard technical measured move targets the upper rail of the channel. This aligns with the "TP" zone marked on the chart, projecting a move toward "Blue Sky" territory.
3. The Verdict Rarely do you see a "Perfect Storm" where a Macro Event (Venezuela reopening) aligns this cleanly with a Technical Setup (Triangle Breakout). The structure suggests the market is pricing in a "Supercycle" return for American energy access.
👇 The "Venezuela Reconstruction" Watchlist:
If the Venezuela thesis plays out, it's not just Chevron that moves. Here is the basket of related Energy, Services, and Refining stocks I am tracking for this cycle:
Majors: NYSE:CVX , NYSE:COP
Services (Boots on the Ground): NYSE:SLB , NSE:HAL , AMEX:OIH
Refiners (Heavy Crude Beneficiaries): NYSE:VLO , NYSE:MPC , NYSE:PSX , NYSE:DINO , NYSE:PBF
Sector ETF: AMEX:XLE
Which of these is your top pick for the reconstruction trade? Let me know in the comments!
Disclaimer: This analysis is for educational purposes regarding market reaction to geopolitical events. It is based on technical chart geometry and public news. Not investment advice.

#CVX/USDT : Long-Term Breakout Signals Massive Upside Potentia#CVX
The price is moving in a descending channel on the 1-hour timeframe and is expected to break out and continue upwards.
We have a trend to stabilize above the 100-period moving average again.
We have a downtrend on the RSI indicator, which supports an upward move if it breaks above it.
We have a key support zone in green that pushed the price higher at 1.81.
Entry price: 1.88
First target: 1.92
Second target: 2.00
Third target: 2.088
For risk management, don't forget your stop-loss and capital management.
The stop-loss is below the support zone in green.
Upon reaching the first target, take some profit and then change your stop-loss order to an entry order.
For any questions, please comment.
Thank you.

#CVX/USDT : Long-Term Breakout Signals Massive Upside Potentia#CVX
The price is moving in a descending channel on the 1-hour timeframe. It has reached the lower boundary and is heading towards breaking above it, with a retest of the upper boundary expected.
We have a downtrend on the RSI indicator, which has reached near the lower boundary, and an upward rebound is expected.
There is a key support zone in green at 1.64. The price has bounced from this zone multiple times and is expected to bounce again.
We have a trend towards stability above the 100-period moving average, as we are moving close to it, which supports the upward movement.
Entry price: 1.66
First target: 1.68
Second target: 1.72
Third target: 1.78
Stop loss: Below the support zone in green.
Don't forget a simple thing: capital management.
For inquiries, please leave a comment.
Thank you.

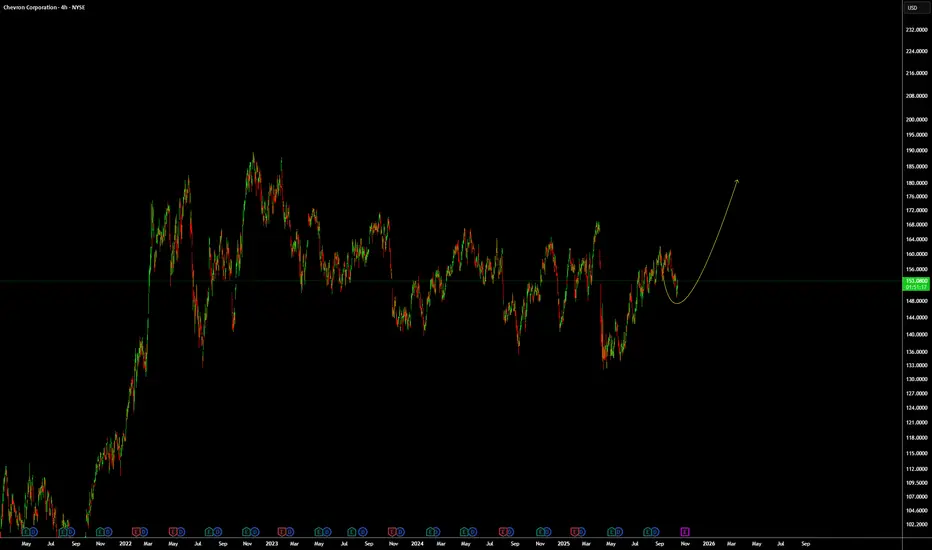
#CVX is on the Boarding and ready to flygreat opportunity to ride with #CVX new swing two targets marked and hopefully will be met by first quarter of 2027

My cvx playFor my crypto port, instead of crv im gonna make a play on cvx. This is 100% allocation. At this point I'm picking 1 alt and just keeping simple. CRV has massive upside but CVX has 4x the voting power and is below its intrinsic value by a lot while CRV is not. Lastly CVX supply is 100% diluted while CRV still has release of tokens until 3 billion supply. The $55 all time high would require a market cap extremely less probable than CVX hitting my goals. Ty

CHEVRON 3-year Channel Down started new Bearish Leg to $132.Chevron (CVX) has been trading within a Channel Down since the November 14 2022 market High. Having currently broken below both its 1W MA50 (blue trend-line) and 1W MA200 (orange trend-line), with the two having formed a 1W Death Cross, the pattern has already started its new Bearish Leg.
There is a high symmetry between all 4 previous major Bearish Legs, which ranged from -18.71% to -21.83%, so based on the -18.71% minimum, we are expecting the stock to reach at least $132.00 by early Q2 2026. This would also make direct contact with the 1M MA100 (red trend-line), the market's next major Support level.
---
** Please LIKE 👍, FOLLOW ✅, SHARE 🙌 and COMMENT ✍ if you enjoy this idea! Also share your ideas and charts in the comments section below! This is best way to keep it relevant, support us, keep the content here free and allow the idea to reach as many people as possible. **
---
💸💸💸💸💸💸
👇 👇 👇 👇 👇 👇

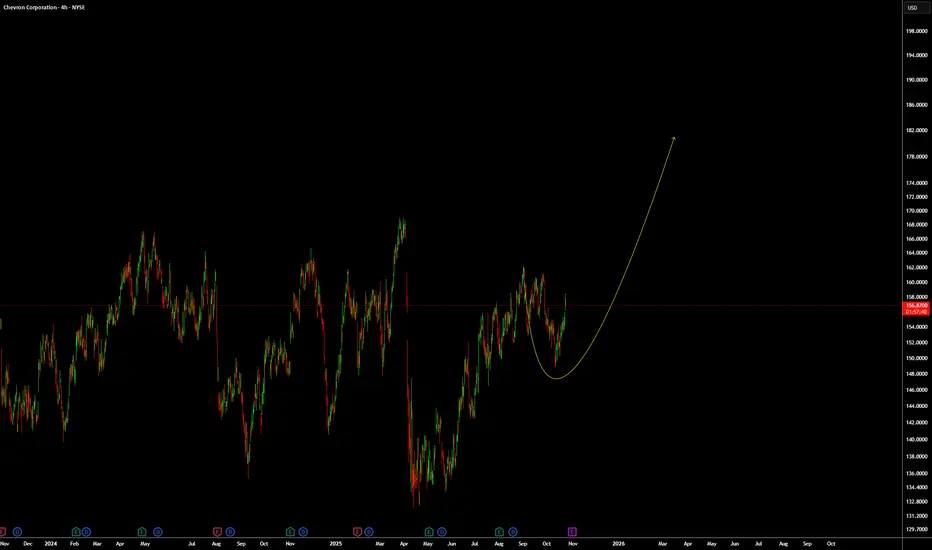
Awaiting a breakout in Chevron.A reminder: all price consolidation is occurring near the accumulation zone.
📊
A breakout above 160.73 and a sustained hold above that level would open prospects for the next upward phase within the diagonal structure.
#CVX/USDT : Long-Term Breakout Signals Massive Upside Potentia#CVX
The price is moving within an ascending channel on the 1-hour timeframe and is adhering to it well. It is poised to break out strongly and retest the channel.
We have a downtrend line on the RSI indicator that is about to break and retest, which supports the upward move.
There is a key support zone in green at the price of 1.74, representing a strong support point.
We have a trend to stabilize above the 100-period moving average.
Entry price: 1.80
First target: 1.86
Second target: 1.92
Third target: 2.00
Don't forget a simple money management rule:
Place your stop-loss order below the support zone in green.
Once the first target is reached, save some money and then change your stop-loss order to an entry order.
For any questions, please leave a comment.
Thank you.

#CVX/USDT : Long-Term Breakout Signals Massive Upside Potentia#CVX
The price is moving within a descending channel on the 1-hour frame, adhering well to it, and is heading for a strong breakout and retest.
We have a bearish trend on the RSI indicator that is about to be broken and retested, which supports the upward breakout.
There is a major support area in green at 2.24, representing a strong support point.
We are heading for consolidation above the 100 moving average.
Entry price: 2.28
First target: 2.30
Second target: 2.34
Third target: 2.38
Don't forget a simple matter: capital management.
When you reach the first target, save some money and then change your stop-loss order to an entry order.
For inquiries, please leave a comment.
Thank you.

Update for CVX: Looking for an up move/wave.
As discussed before in our previous post, NYSE:CVX looks like it will go up, it did go up so if you are in manage your trades. We can see pushing higher and lets see how far will it go.
For reference, this is our previews chart:
Always remember WTW 4 Golder Rules:
1) Do not jump in
2) Do not over risk/trade
3) Do not trade without Stop Loss
4) Never ever add to a losing position!
Trade with care
We Trade Waves
WTW Team
Disclosure: We are part of Trade Nation's Influencer program and receive a monthly fee for using their TradingView charts in our analysis.
#CVX/USDT : Long-Term Breakout Signals Massive Upside Potentia#CVX
The price is moving in a descending channel on the 1-hour frame and is expected to break and continue upward.
We have a trend to stabilize above the 100 moving average once again.
We have a downtrend on the RSI indicator that supports the upward move with a breakout.
We have a major support area in green that pushed the price higher at 2.40.
Entry price: 2.57.
First target: 2.64.
Second target: 2.75.
Third target: 2.87.
To manage risk, don't forget stop loss and capital management.
When you reach the first target, save some profits and then change the stop order to an entry order.
For inquiries, please comment.
Thank you.

CVX: Looking for an up move/wave.From a technical point of view and based on WTW Concept, NYSE:CVX looks like it will go up.
We Trade Waves
WTW Team
Disclosure: We are part of Trade Nation's Influencer program and receive a monthly fee for using their TradingView charts in our analysis.
CVX under 3$ is a good investment.I believe CVX can form a higher low with this trend line acting as support at 3.10.
If BTC continue it's uptrend to $130k and more there's high change it will mark a low on CVX and many others. This will be an opportunity to maybe enter at an interesting price for the beginning of a possible alt season once BTC reach a definitive new all time high for this cycle to close the year.
Thank you.

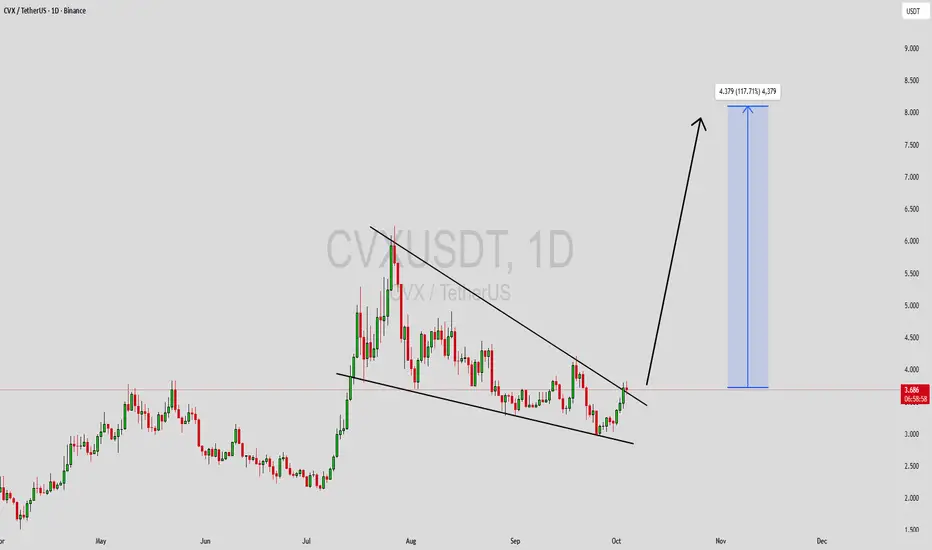
CVXUSDT Forming Falling WedgeCVXUSDT is showing a well-defined falling wedge pattern on the chart — a classic bullish reversal formation that often signals the end of a downtrend and the start of a strong upward move. The price has been consolidating within narrowing trendlines, suggesting that bearish momentum is weakening while buying pressure is gradually increasing. This setup, combined with consistent volume activity, indicates that a breakout could be imminent and may lead to a substantial rally in the coming sessions.
With an expected gain of around 90% to 100%+, CVXUSDT has the potential to deliver a major bullish move once it breaks above the wedge resistance. Historically, similar setups in altcoins have triggered sharp rallies as traders and investors recognize the shift in trend. The good trading volume supports the likelihood of a strong follow-through if a breakout occurs, confirming growing market participation and confidence in this asset’s short-term outlook.
Investor sentiment around CVXUSDT appears to be improving, with more attention coming from both technical traders and long-term holders. This combination of technical strength, market interest, and supportive volume makes CVXUSDT an attractive setup for traders looking to capitalize on a potential breakout opportunity. Watching for a decisive move above resistance could open the door for an impressive bullish wave.
✅ Show your support by hitting the like button and
✅ Leaving a comment below! (What is You opinion about this Coin)
Your feedback and engagement keep me inspired to share more insightful market analysis with you!
#CVX/USDT : Long-Term Breakout Signals Massive Upside Potentia#CVX
The price is moving within a descending channel on the 1-hour frame, adhering well to it, and is heading for a strong breakout and retest.
We have a bearish trend on the RSI indicator that is about to be broken and retested, which supports the upward breakout.
There is a major support area in green at 3.04, representing a strong support point.
We are heading for consolidation above the 100 moving average.
Entry price: 3.08.
First target: 3.12.
Second target: 3.18.
Third target: 3.25.
Don't forget a simple matter: capital management.
When you reach the first target, save some money and then change your stop-loss order to an entry order.
For inquiries, please leave a comment.
Thank you.

#CVX/USDT : Long-Term Breakout Signals Massive Upside Potentia#CVX
The price is moving in a descending channel on the 1-hour frame and is expected to break and continue upward.
We have a trend to stabilize above the 100 moving average once again.
We have a downtrend on the RSI indicator that supports the upward move with a breakout.
We have a major support area in green that pushed the price higher at 3.70.
Entry price: 3.82.
First target: 3.91.
Second target: 4.05.
Third target: 4.206.
To manage risk, don't forget stop loss and capital management.
When you reach the first target, save some profits and then change the stop order to an entry order.
For inquiries, please comment.
Thank you.

#CVX/USDT : Long-Term Breakout Signals Massive Upside Potentia#CVX
The price is moving within a descending channel on the 1-hour frame, adhering well to it, and is heading for a strong breakout and retest.
We have a bearish trend on the RSI indicator that is about to be broken and retested, which supports the upward breakout.
There is a major support area in green at 3.66, representing a strong support point.
For inquiries, please leave a comment.
We are in a consolidation trend above the 100 Moving Average.
Entry price: 3.70
First target: 3.76
Second target: 3.84
Third target: 3.91
Don't forget a simple matter: capital management.
When you reach the first target, save some money and then change your stop-loss order to an entry order.
For inquiries, please leave a comment.
Thank you.
