#CVX/USDT : Long-Term Breakout Signals Massive Upside Potentia#CVX
The price is moving within a descending channel on the hourly timeframe. It has reached the upper boundary and is heading towards breaking it. A retest of this boundary is expected.
The Relative Strength Index (RSI) is showing an upward trend, as it has approached the upper boundary. A bearish reversal is expected.
There is a key support zone in green at 1.94. The price has bounced from this zone several times and is expected to bounce again.
A consolidation trend is observed above the 100-period moving average, which we are approaching. This trend supports a decline towards this level.
Entry Price: 1.96
Target 1: 2.00
Target 2: 2.05
Target 3: 2.10
Stop Loss: Above the green support zone.
Remember this simple thing: Money management.
For any questions, please leave a comment.
Thank you.
CVXUSDT

#CVX/USDT : Long-Term Breakout Signals Massive Upside Potentia#CVX
The price is moving within a descending channel on the hourly timeframe. It has reached the lower boundary and is heading towards a breakout, with a retest of the upper boundary expected.
The Relative Strength Index (RSI) is showing a downward trend, approaching the lower boundary, and an upward bounce is anticipated.
There is a key support zone in green at 2.01, and the price has bounced from this level several times. Another bounce is expected.
The indicator is showing a trend towards consolidation above the 100-period moving average, which we are approaching, supporting the upward move.
Entry Price: 2.058
First Target: 2.08
Second Target: 2.12
Third Target: 2.16
Stop Loss: Below the green support zone.
Remember this simple thing: Money management.
For any questions, please leave a comment.
Thank you.

#CVX/USDT : Long-Term Breakout Signals Massive Upside Potentia
#CVX
The price is moving within a descending channel on the hourly timeframe. It has reached the lower boundary and is heading towards a breakout, with a retest of the upper boundary expected.
The Relative Strength Index (RSI) is showing a downward trend, approaching the lower boundary, and an upward bounce is anticipated.
There is a key support zone in green at 1.95. The price has bounced from this level several times and is expected to bounce again.
The indicator is showing a trend towards consolidation above the 100-period moving average, which we are approaching, supporting the upward move.
Entry Price: 1.98
First Target: 2.02
Second Target: 2.06
Third Target: 2.12
Stop Loss: Below the green support zone.
Don't forget one simple thing: Money Management.
For inquiries, please leave a comment.
Thank you.

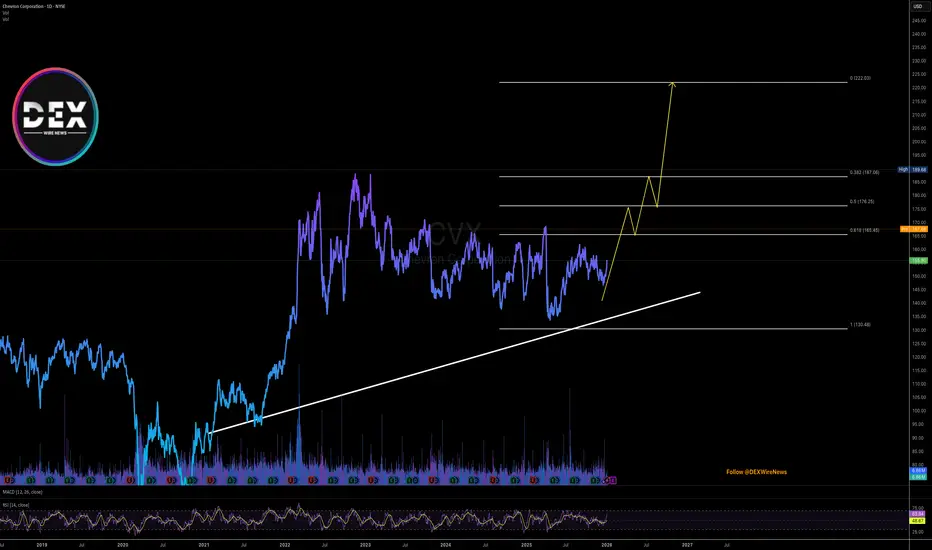
Breaking: Chevron Corporation (CVX) Spikes 7% On Major Update The shares of Chevron Corporation (CVX) saw a noteworthy uptick of 11% in extended market trading on Fridays session. The stock extended gains to Mionday's premarket session surging 7% as it sets to break the 50% Fib level- eyeing the $200 resistant zone.
In recent news, U.S. oil companies' shares rose in premarket trading on Monday as investors bet that President Donald Trump's move against Venezuela's leadership would allow American firms greater access to the world's largest oil reserves.
Shares of Chevron (CVX.N), the only U.S. major currently operating in Venezuela's oil fields, climbed 7.3%.
The gains came after Trump said the U.S. needed "total access" to Venezuela's vast oil reserves following the arrest of President Nicolas Maduro, sharpening expectations that Washington could ease restrictions on Venezuelan crude exports.
Analyst Summary
According to 16 analysts, the average rating for CVX stock is "Buy." The 12-month stock price target is $171.94, which is an increase of 10.29% from the latest price.
About CVX
Chevron Corporation, through its subsidiaries, engages in the integrated energy and chemicals operations in the United States and internationally. The company operates in two segments, Upstream and Downstream. The Upstream segment engages in the exploration, development, production, and transportation of crude oil and natural gas; liquefaction, transportation, and regasification of liquefied natural gas; transporting crude oil through pipelines; processing, transporting, storage, and marketing of natural gas.
#CVX/USDT : Long-Term Breakout Signals Massive Upside Potentia#CVX
The price is moving in a descending channel on the 1-hour timeframe and is expected to break out and continue upwards.
We have a trend to stabilize above the 100-period moving average again.
We have a downtrend on the RSI indicator, which supports an upward move if it breaks above it.
We have a key support zone in green that pushed the price higher at 1.81.
Entry price: 1.88
First target: 1.92
Second target: 2.00
Third target: 2.088
For risk management, don't forget your stop-loss and capital management.
The stop-loss is below the support zone in green.
Upon reaching the first target, take some profit and then change your stop-loss order to an entry order.
For any questions, please comment.
Thank you.

#CVX/USDT : Long-Term Breakout Signals Massive Upside Potentia#CVX
The price is moving in a descending channel on the 1-hour timeframe. It has reached the lower boundary and is heading towards breaking above it, with a retest of the upper boundary expected.
We have a downtrend on the RSI indicator, which has reached near the lower boundary, and an upward rebound is expected.
There is a key support zone in green at 1.64. The price has bounced from this zone multiple times and is expected to bounce again.
We have a trend towards stability above the 100-period moving average, as we are moving close to it, which supports the upward movement.
Entry price: 1.66
First target: 1.68
Second target: 1.72
Third target: 1.78
Stop loss: Below the support zone in green.
Don't forget a simple thing: capital management.
For inquiries, please leave a comment.
Thank you.

#CVX/USDT : Long-Term Breakout Signals Massive Upside Potentia#CVX
The price is moving within an ascending channel on the 1-hour timeframe and is adhering to it well. It is poised to break out strongly and retest the channel.
We have a downtrend line on the RSI indicator that is about to break and retest, which supports the upward move.
There is a key support zone in green at the price of 1.74, representing a strong support point.
We have a trend to stabilize above the 100-period moving average.
Entry price: 1.80
First target: 1.86
Second target: 1.92
Third target: 2.00
Don't forget a simple money management rule:
Place your stop-loss order below the support zone in green.
Once the first target is reached, save some money and then change your stop-loss order to an entry order.
For any questions, please leave a comment.
Thank you.

#CVX/USDT : Long-Term Breakout Signals Massive Upside Potentia#CVX
The price is moving within a descending channel on the 1-hour frame, adhering well to it, and is heading for a strong breakout and retest.
We have a bearish trend on the RSI indicator that is about to be broken and retested, which supports the upward breakout.
There is a major support area in green at 2.24, representing a strong support point.
We are heading for consolidation above the 100 moving average.
Entry price: 2.28
First target: 2.30
Second target: 2.34
Third target: 2.38
Don't forget a simple matter: capital management.
When you reach the first target, save some money and then change your stop-loss order to an entry order.
For inquiries, please leave a comment.
Thank you.

#CVX/USDT : Long-Term Breakout Signals Massive Upside Potentia#CVX
The price is moving in a descending channel on the 1-hour frame and is expected to break and continue upward.
We have a trend to stabilize above the 100 moving average once again.
We have a downtrend on the RSI indicator that supports the upward move with a breakout.
We have a major support area in green that pushed the price higher at 2.40.
Entry price: 2.57.
First target: 2.64.
Second target: 2.75.
Third target: 2.87.
To manage risk, don't forget stop loss and capital management.
When you reach the first target, save some profits and then change the stop order to an entry order.
For inquiries, please comment.
Thank you.

CVX under 3$ is a good investment.I believe CVX can form a higher low with this trend line acting as support at 3.10.
If BTC continue it's uptrend to $130k and more there's high change it will mark a low on CVX and many others. This will be an opportunity to maybe enter at an interesting price for the beginning of a possible alt season once BTC reach a definitive new all time high for this cycle to close the year.
Thank you.

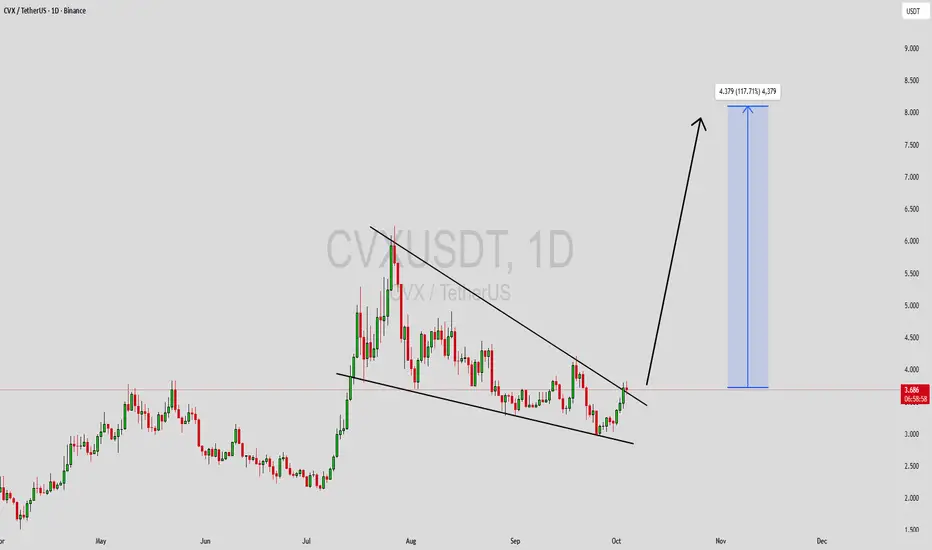
CVXUSDT Forming Falling WedgeCVXUSDT is showing a well-defined falling wedge pattern on the chart — a classic bullish reversal formation that often signals the end of a downtrend and the start of a strong upward move. The price has been consolidating within narrowing trendlines, suggesting that bearish momentum is weakening while buying pressure is gradually increasing. This setup, combined with consistent volume activity, indicates that a breakout could be imminent and may lead to a substantial rally in the coming sessions.
With an expected gain of around 90% to 100%+, CVXUSDT has the potential to deliver a major bullish move once it breaks above the wedge resistance. Historically, similar setups in altcoins have triggered sharp rallies as traders and investors recognize the shift in trend. The good trading volume supports the likelihood of a strong follow-through if a breakout occurs, confirming growing market participation and confidence in this asset’s short-term outlook.
Investor sentiment around CVXUSDT appears to be improving, with more attention coming from both technical traders and long-term holders. This combination of technical strength, market interest, and supportive volume makes CVXUSDT an attractive setup for traders looking to capitalize on a potential breakout opportunity. Watching for a decisive move above resistance could open the door for an impressive bullish wave.
✅ Show your support by hitting the like button and
✅ Leaving a comment below! (What is You opinion about this Coin)
Your feedback and engagement keep me inspired to share more insightful market analysis with you!
CVXUSDT UPDATE#CVX
UPDATE
CVX Technical Setup
Pattern: Bullish falling wedge pattern
Current Price: $0.680
Target Price: $1.225
Target % Gain: 80.32%
NYSE:CVX is breaking out of a falling wedge pattern on the 1D timeframe. Current price is $0.680 with a target near $1.225, indicating around 80% potential upside. The breakout signals renewed bullish momentum with structure favoring continuation toward higher levels. Always use proper risk management.
Time Frame: 1D
Risk Management Tip: Always use proper risk management.

#CVX/USDT : Long-Term Breakout Signals Massive Upside Potentia#CVX
The price is moving within a descending channel on the 1-hour frame, adhering well to it, and is heading for a strong breakout and retest.
We have a bearish trend on the RSI indicator that is about to be broken and retested, which supports the upward breakout.
There is a major support area in green at 3.04, representing a strong support point.
We are heading for consolidation above the 100 moving average.
Entry price: 3.08.
First target: 3.12.
Second target: 3.18.
Third target: 3.25.
Don't forget a simple matter: capital management.
When you reach the first target, save some money and then change your stop-loss order to an entry order.
For inquiries, please leave a comment.
Thank you.

#CVX/USDT : Long-Term Breakout Signals Massive Upside Potentia#CVX
The price is moving in a descending channel on the 1-hour frame and is expected to break and continue upward.
We have a trend to stabilize above the 100 moving average once again.
We have a downtrend on the RSI indicator that supports the upward move with a breakout.
We have a major support area in green that pushed the price higher at 3.70.
Entry price: 3.82.
First target: 3.91.
Second target: 4.05.
Third target: 4.206.
To manage risk, don't forget stop loss and capital management.
When you reach the first target, save some profits and then change the stop order to an entry order.
For inquiries, please comment.
Thank you.

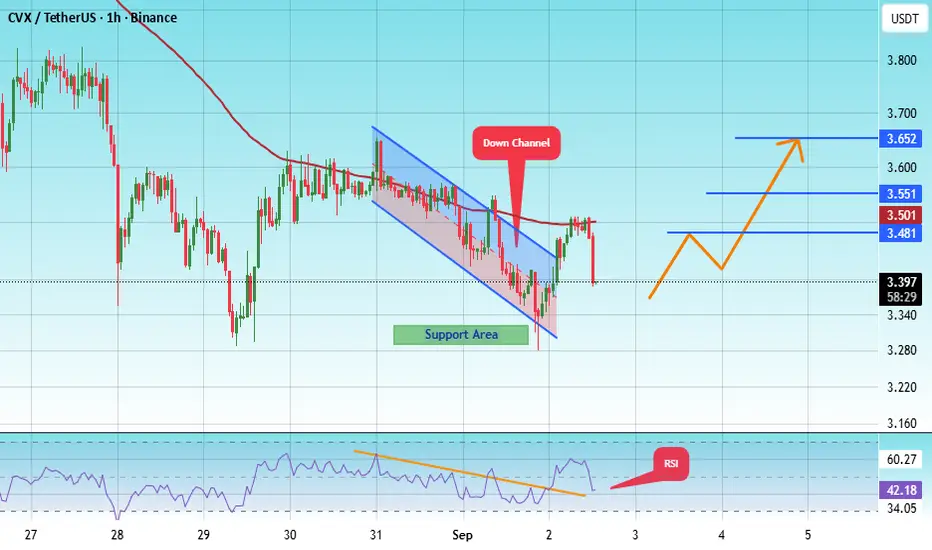
#CVX/USDT : Long-Term Breakout Signals Massive Upside Potentia#CVX
The price is moving within a descending channel on the 1-hour frame, adhering well to it, and is heading for a strong breakout and retest.
We have a bearish trend on the RSI indicator that is about to be broken and retested, which supports the upward breakout.
There is a major support area in green at 3.66, representing a strong support point.
For inquiries, please leave a comment.
We are in a consolidation trend above the 100 Moving Average.
Entry price: 3.70
First target: 3.76
Second target: 3.84
Third target: 3.91
Don't forget a simple matter: capital management.
When you reach the first target, save some money and then change your stop-loss order to an entry order.
For inquiries, please leave a comment.
Thank you.

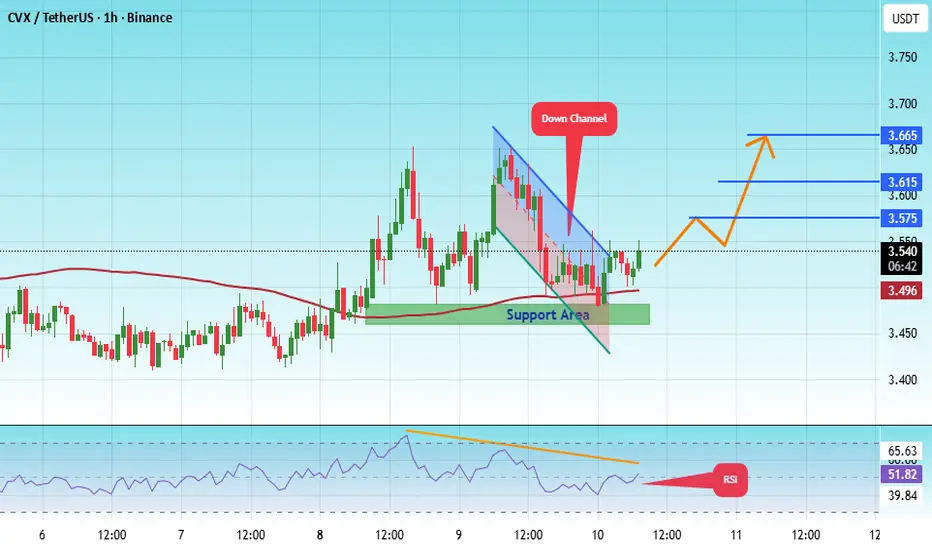
#CVX/USDT : Long-Term Breakout Signals Massive Upside Potentia#CVX
The price is moving within a descending channel on the 1-hour frame, adhering well to it, and is heading for a strong breakout and retest.
We have a bearish trend on the RSI indicator that is about to be broken and retested, which supports the upward breakout.
There is a major support area in green at 3.47, representing a strong support point.
For inquiries, please leave a comment.
We are in a consolidation trend above the 100 Moving Average.
Entry price: 3.52
First target: 3.57
Second target: 3.62
Third target: 3.66
Don't forget a simple matter: capital management.
When you reach the first target, save some money and then change your stop-loss order to an entry order.
For inquiries, please leave a comment.
Thank you.
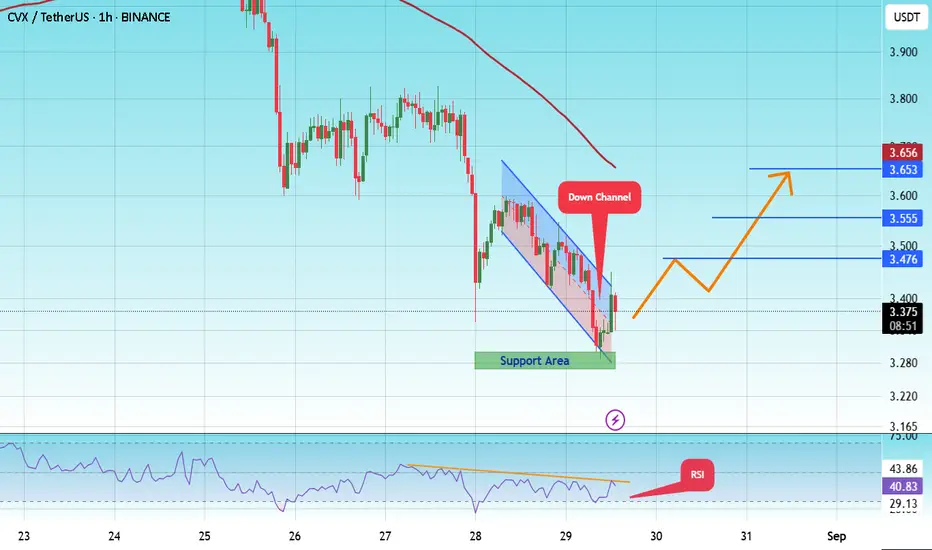
#CVX/USDT : Long-Term Breakout Signals Massive Upside Potential#CVX
The price is moving within a descending channel on the 1-hour frame, adhering well to it, and is heading for a strong breakout and retest.
We have a bearish trend on the RSI indicator that is about to be broken and retested, which supports the upward breakout.
There is a major support area in green at 3.35, which represents a strong support point.
For inquiries, please leave a comment.
We are in a consolidation trend above the 100 Moving Average.
Entry price: 3.49
First target: 3.49
Second target: 3.55
Third target: 3.62
Don't forget a simple matter: capital management.
When you reach the first target, save some money and then change your stop-loss order to an entry order.
For inquiries, please leave a comment.
Thank you.

#CVX/USDT : Long-Term Breakout Signals Massive Upside Potential
#CVX
The price is moving within a descending channel on the 1-hour frame and is expected to break and continue upward.
We have a trend to stabilize above the 100 moving average once again.
We have a downtrend on the RSI indicator that supports the upward move with a breakout.
We have a support area at the lower boundary of the channel at 3.30, acting as strong support from which the price can rebound.
We have a major support area in green that pushed the price upward at 3.27.
Entry price: 3.39.
First target: 3.47.
Second target: 3.55.
Third target: 3.65.
To manage risk, don't forget stop loss and capital management.
When you reach the first target, save some profits and then change the stop order to an entry order.
For inquiries, please comment.
Thank you.
#CVX/USDT : Long-Term Breakout Signals Massive Upside Potential#CVX
The price is moving within a descending channel on the 1-hour frame and is expected to break and continue upward.
We have a trend to stabilize above the 100 moving average once again.
We have a downtrend on the RSI indicator that supports the upward move with a breakout.
We have a support area at the lower boundary of the channel at 3.30, acting as strong support from which the price can rebound.
We have a major support area in green that pushed the price upward at 3.27.
Entry price: 3.34.
First target: 3.47.
Second target: 3.55.
Third target: 3.65.
To manage risk, don't forget stop loss and capital management.
When you reach the first target, save some profits and then change the stop order to an entry order.
For inquiries, please comment.
Thank you.
#CVX/USDT - Get your civix straight again!#CVX
The price is moving within an ascending channel on the 1-hour frame, adhering well to it, and is on its way to break it strongly upwards and retest it.
We have support from the lower boundary of the ascending channel, at 3.90.
We have a downtrend on the RSI indicator that is about to break and retest, supporting the upside.
There is a major support area in green at 3.80, which represents a strong basis for the upside.
Don't forget a simple thing: ease and capital.
When you reach the first target, save some money and then change your stop-loss order to an entry order.
For inquiries, please leave a comment.
We have a trend to hold above the 100 Moving Average.
Entry price: 4.19
First target: 4.33
Second target: 4.51
Third target: 4.73
Don't forget a simple thing: ease and capital.
When you reach the first target, save some money and then change your stop-loss order to an entry order.
For inquiries, please leave a comment.
Thank you.

The key is whether it can rise above 5.886.
Hello, fellow traders!
If you "Follow" me, you'll always get the latest information quickly.
Have a great day.
-------------------------------------
I don't necessarily recommend coins (tokens) that exhibit this behavior.
However, if you have spare funds or have or can generate significant profits from other coins (tokens), I think it's worth looking into these coins (tokens) when they're ready to trade.
The key is to maintain the price above the M-Signal indicator on the 1M chart.
-------------------------------------
(CVXUSDT 1M Chart)
CVX is showing signs of rising above the M-Signal indicator on the 1M chart.
If the price remains above the M-Signal indicator on the 1M chart, the upward trend is likely to continue.
-
(1W Chart)
After a prolonged period of sideways movement, the HA-Low and HA-High indicators on the 1W chart have converged, and the price has risen above the M-Signal indicator on the 1M chart.
Therefore, the 2.862-3.412 range is considered a support area.
If it falls below the 2.862-3.412 range, you should stop trading and wait and see how things go.
The DOM (60) indicator is forming at 5.886, so a break above this level is highly likely to initiate a stepwise uptrend.
Therefore, the key question is whether it can find support near 4.116 and rise above 5.886.
-
(1D chart)
The key question is whether it can find support in the 4.418-4.902 range and rise.
You should observe the transition from the M-Signal on the 1D chart > the M-Signal on the 1W chart > the M-Signal on the 1M chart.
If the M-Signal indicators are aligned correctly, a full-scale uptrend is likely to begin.
-
Thank you for reading to the end.
I wish you successful trading.
--------------------------------------------------
- Here's an explanation of the big picture.
(3-year bull market, 1-year bear market pattern)
I'll explain more in detail when the bear market begins.
------------------------------------------------------

CVX/USDT Weekly Analysis — Strong Reversal Zone CouldTechnical Analysis:
1. Strong Demand Zone (Key Reversal Area)
CVX price has repeatedly tested a strong support zone around $1.43 – $2.20 (highlighted in yellow). This area has acted as a major accumulation zone, showing strong buyer interest and serving as a critical base support.
2. Potential Double Bottom Formation (Bullish Reversal Pattern)
A potential Double Bottom or Adam & Eve pattern is forming within this demand zone — a classic bullish reversal structure, indicating a possible trend shift to the upside.
3. Key Resistance Levels (Bullish Targets):
$2.90 – Minor resistance, likely to be tested in the short term.
$3.46 – Significant psychological and technical resistance.
$4.98 – Major resistance and neckline of the double bottom pattern.
$6.76 – Strong weekly resistance, a potential medium-term target.
$15.77 & $47.97 – Long-term targets if a macro bullish trend emerges.
Bullish Scenario:
If the price holds above the $2.20 support zone:
Gradual upward movement expected toward $2.90 → $3.46 → $4.98.
A confirmed breakout above $4.98 could trigger a rally toward $6.76.
Full bullish confirmation would occur if the price breaks and holds above $6.76, indicating a longer-term trend reversal.
Bearish Scenario:
If price breaks down below the $1.43 support level with a weekly close:
The double bottom structure would be invalidated.
Price could enter new price discovery territory, potentially heading below $1.00.
Market sentiment would turn significantly bearish.
Strategic Conclusion:
CVX/USDT is currently at a critical decision point. A strong historical support zone suggests a high potential for bullish reversal. Confirmation of the bullish structure requires a breakout above $4.98. However, caution is needed if price breaks below $1.43, as it may indicate structural failure.
#CVXUSDT #ConvexFinance #CryptoAnalysis #DoubleBottom #ReversalPattern #BullishSetup #AltcoinAnalysis #SupportResistance #CryptoBreakout #TechnicalAnalysis

#CVX best zone for make some money SOON ?#CVX
The price is moving within a descending channel on the 1-hour frame, adhering well to it, and is heading for a strong breakout and retest.
We are experiencing a bounce from the lower boundary of the descending channel. This support is at 2.30.
We have a downtrend on the RSI indicator that is about to be broken and retested, supporting the upside.
There is a major support area in green at 2.23, which represents a strong basis for the upside.
Don't forget a simple thing: ease and capital.
When you reach the first target, save some money and then change your stop-loss order to an entry order.
For inquiries, please leave a comment.
We are in a consolidation trend above the 100 Moving Average.
Entry price: 2.41
First target: 2.46
Second target: 2.55
Third target: 2.65
Don't forget a simple thing: ease and capital.
When you reach your first target, save some money and then change your stop-loss order to an entry order.
For inquiries, please leave a comment.
Thank you.
