The key is whether it can rise above 5.886.
Hello, fellow traders!
If you "Follow" me, you'll always get the latest information quickly.
Have a great day.
-------------------------------------
I don't necessarily recommend coins (tokens) that exhibit this behavior.
However, if you have spare funds or have or can generate significant profits from other coins (tokens), I think it's worth looking into these coins (tokens) when they're ready to trade.
The key is to maintain the price above the M-Signal indicator on the 1M chart.
-------------------------------------
(CVXUSDT 1M Chart)
CVX is showing signs of rising above the M-Signal indicator on the 1M chart.
If the price remains above the M-Signal indicator on the 1M chart, the upward trend is likely to continue.
-
(1W Chart)
After a prolonged period of sideways movement, the HA-Low and HA-High indicators on the 1W chart have converged, and the price has risen above the M-Signal indicator on the 1M chart.
Therefore, the 2.862-3.412 range is considered a support area.
If it falls below the 2.862-3.412 range, you should stop trading and wait and see how things go.
The DOM (60) indicator is forming at 5.886, so a break above this level is highly likely to initiate a stepwise uptrend.
Therefore, the key question is whether it can find support near 4.116 and rise above 5.886.
-
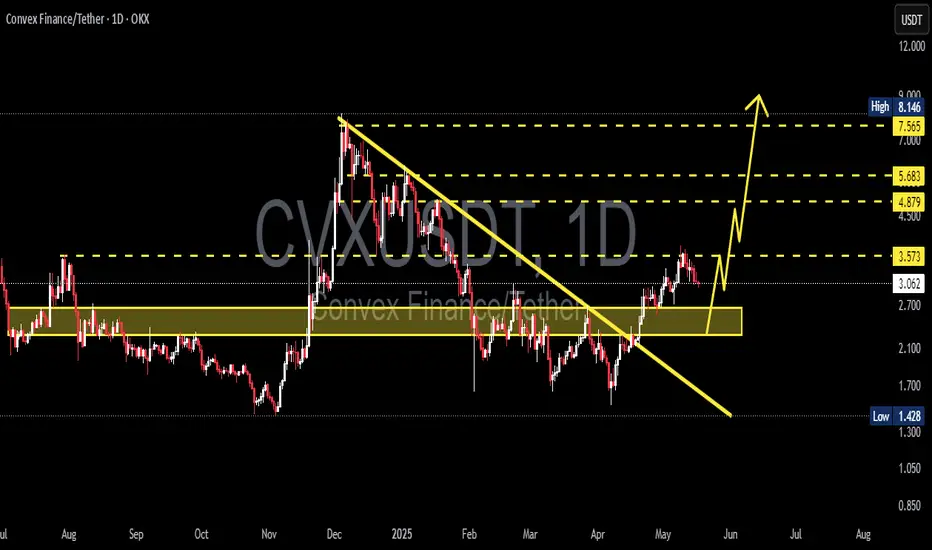
(1D chart)
The key question is whether it can find support in the 4.418-4.902 range and rise.
You should observe the transition from the M-Signal on the 1D chart > the M-Signal on the 1W chart > the M-Signal on the 1M chart.
If the M-Signal indicators are aligned correctly, a full-scale uptrend is likely to begin.
-
Thank you for reading to the end.
I wish you successful trading.
--------------------------------------------------
- Here's an explanation of the big picture.
(3-year bull market, 1-year bear market pattern)
I'll explain more in detail when the bear market begins.
------------------------------------------------------
Cvxusdtperp

CVX/USDT Weekly Analysis — Strong Reversal Zone CouldTechnical Analysis:
1. Strong Demand Zone (Key Reversal Area)
CVX price has repeatedly tested a strong support zone around $1.43 – $2.20 (highlighted in yellow). This area has acted as a major accumulation zone, showing strong buyer interest and serving as a critical base support.
2. Potential Double Bottom Formation (Bullish Reversal Pattern)
A potential Double Bottom or Adam & Eve pattern is forming within this demand zone — a classic bullish reversal structure, indicating a possible trend shift to the upside.
3. Key Resistance Levels (Bullish Targets):
$2.90 – Minor resistance, likely to be tested in the short term.
$3.46 – Significant psychological and technical resistance.
$4.98 – Major resistance and neckline of the double bottom pattern.
$6.76 – Strong weekly resistance, a potential medium-term target.
$15.77 & $47.97 – Long-term targets if a macro bullish trend emerges.
Bullish Scenario:
If the price holds above the $2.20 support zone:
Gradual upward movement expected toward $2.90 → $3.46 → $4.98.
A confirmed breakout above $4.98 could trigger a rally toward $6.76.
Full bullish confirmation would occur if the price breaks and holds above $6.76, indicating a longer-term trend reversal.
Bearish Scenario:
If price breaks down below the $1.43 support level with a weekly close:
The double bottom structure would be invalidated.
Price could enter new price discovery territory, potentially heading below $1.00.
Market sentiment would turn significantly bearish.
Strategic Conclusion:
CVX/USDT is currently at a critical decision point. A strong historical support zone suggests a high potential for bullish reversal. Confirmation of the bullish structure requires a breakout above $4.98. However, caution is needed if price breaks below $1.43, as it may indicate structural failure.
#CVXUSDT #ConvexFinance #CryptoAnalysis #DoubleBottom #ReversalPattern #BullishSetup #AltcoinAnalysis #SupportResistance #CryptoBreakout #TechnicalAnalysis

CVXUSDT 1D AnalysisCVX ~ 1D Analysis
#CVX Buy back on retest of this support block with short term target of at least 10%+ from here.
CVXUSDT 1WCVX ~ 1W Analysis
#CVX Buy gradually from here if you still have a Conviction on this coin with a short -term target of at least 20%+.

#CVX/USDT#CVX
The price is moving in a downward channel on the 4-hour frame upwards and is expected to continue
We have a trend to stabilize above the moving average 100 again
We have a downward trend on the RSI indicator that supports the rise by breaking it upwards
We have a support area at the lower limit of the channel at a price of 1.50
Entry price 1.71
First target 1.87
Second target 2.20
Third target 2.55

Cvxusdt Breakout And retestCvxusdt
CVX/USDT, ,has shown a symmetrical triangle pattern breakout and retest, which has been confirmed on the 4-hour time-frame. A symmetrical triangle is a chart pattern that typically forms when a security's price is consolidating, creating a series of higher lows and lower highs. This pattern indicates that the market is indecisive about the future direction of the asset.
The confirmation of the pattern breakout and retest on the 4-hour time-frame suggests that CVX/USDT is likely to experience a significant price move in the near future. In this case, the breakout is bullish, indicating that prices are expected to move higher. As a result, traders may look to take a long position in the asset.
Based on the breakout and retest pattern, we anticipate a 30-50% bullish move in the upcoming days. This implies that the price of CVX/USDT is expected to rise by 30-50% from its current level. However, it is important to note that trading always involves risk, and there is no guarantee that the price will move in the anticipated direction.
In summary, based on the confirmed symmetrical triangle pattern breakout and retest on the 4-hour time-frame, traders may consider taking a long position in CVX/USDT, with an expectation of a 30-50% bullish move in the coming days. However, traders should always conduct their own analysis and risk management before entering any trade.
